 News
News  Market Data
  Discover
Support: 888-992-3836
Copyright © 2023 InvestorsHub Inc.


Register for free to join our community of investors and share your ideas. You will also get access to streaming quotes, interactive charts, trades, portfolio, live options flow and more tools.
I am now looking for a drop of 350 S&P points to next target.
No.I know a lot of people think it is but it isn't.
Due to the fact so many think it is that is a great question.
the wave structure of the decline from 2872 make it impossible.
Triangle Wave 4 correction ?
If Wave 3 was extended then ...
Is this an ABCDE Triangle 4 Correction, with wave 5 (up) still to come?
3 of 3 of A DOWN ...
on Tuesday?
ABC Correction started Jan 26?
Wave A (down) ( assuming 5 waves down )
Wave 1 (down) of A (down) from Jan 26 to Feb 09
Wave 2 (up__) of A (down) from Feb 09 to Mar 12
Wave 3 (down) of A (down) from Mar 13 to ??? ??
Wave 1 (down) of 3 (down) of A (down) from Mar 13 to Apr 02
Wave 2 (up__) of 3 (down) of A (down) from Apr 02 to Apr 18
Wave 3 (down) of 3 (down) of A (down) from Apr 18 to ??? ??
Possible ?
We are still in Super Cycle (II), on our way to 1810.
Made a lot of money in the last several weeks in this correction.
You can travel along in the forum if you like.
http://indexinsight.com
If we are correcting the five waves up from 666 in 2009 then 1810 is the first logical target for that correction. Remember 1810 was the end of Cycle wave IV. That would be a 48% retrace of the advance.
The whole advance is Super Cycle (I). This correction would be Super Cycle (II). It all makes sense doesn't it?
Agreed that 2500 looks like a goner. Chart looks awful.
But a complete round-trip of the last two years?
And here I thought I was being too pessimistic looking for 2000. 
Thanks and be well.
Heads up, My next target is 2500. Break that hard and next is 1810.
I am sorry Double Top, you ask a question and I didn't answer you.
The answer is yes. But you need to remember that Cycle A will be five Primary waves long. We have only completed [1] and [2] of A.
We are correcting the entire five wave advance from 666.
Double Top - You need to join me in the Trading pit if for nothing else the free week. I think you would really enjoy it.
http://indexinsight.com
Do you see an A-B-C wave forming for Wave (II) green DOWN?
And currently we have 1-2-3-4 (nearly) complete of 5 waves down for Wave A down?
Here is the link to my chart and commentary at my website.
http://indexinsight.com/charts.html
Go to my website. Enter, then drop the menu and click on Charts. That is my last update. I update it every so often at important points.
http://indexinsight.com/
I've seen some bearish price forecasts for $GOLD but none as low as yours.
Even if the price gets only halfway down to that target, we'll see a number of the miners go the way of the dodo. But sub $500 and it will be last miner standing territory. We'll find out which entity had the best hedge book.
Thanks again and keep up the good work.
Thanks, As for GOLD, If wave C equals wave A we will complete this ABC near 460. It is most common for the C wave to roughly equal the A wave. It does not have to, however. C down will be a five wave impulse or an ending diagonal.
Looks like you may have nailed it! Good work. BA could not sustain the indexes all by itself today, though it tried.
As for $GOLD, your sell call also timely. Interest rates headed much higher, $USD headed higher as well. Where do you see $GOLD bottoming?
Thanks.
Here is a heads up. It is possible that we have enough waves to have complete SC (I) at Friday's close. As I have explained many times, the top can only occur when the wave structure allows for it. Friday's close was such a point. Pay attention.
We should know quickly if the top is in or we push higher in another 5 wave impulse. If we push higher I will calculate when the next opportunity will take place.
Gold has completed the triangle. Gold should now drop like a brick.
See chart in last gold post.
GOLD It appears that Cycle wave B has morphed into a triangle.
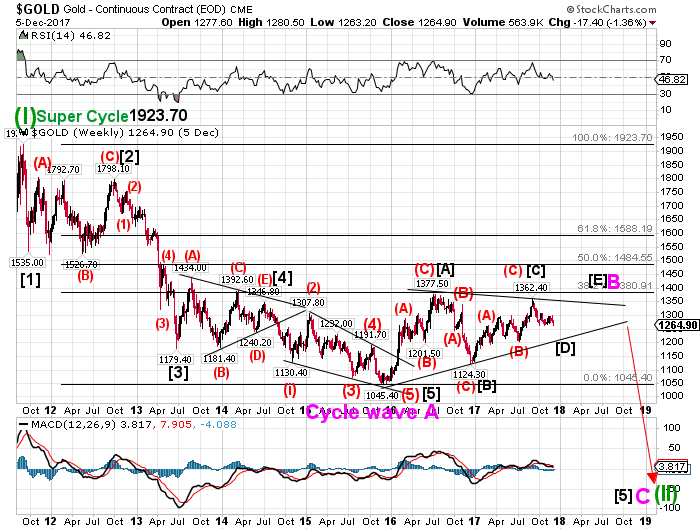
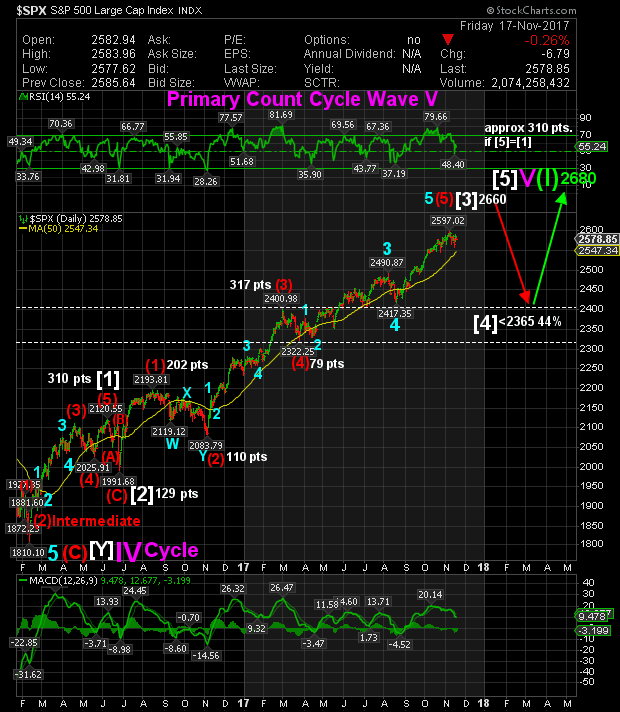
Long term Elliott Wave chart of Cycle wave V of Super Cycle (I).
Charts of all time frames can be found in my forum.
http://indexinsight.com
Click chart twice to enlarge.
GOLD updated chart. We continue toward target.

You can view my latest intermediate term chart at my web site.
http://indexinsight.com
That target of 2359 is still good. Unless this [4] is a triangle. In that case we will not go down below the recent low of 2417 but will probably take the next two months finishing the triangle.
the most common pattern for a four is a flat and then next is the triangle. It can be a zig zag but very seldom is if wave two is a zig zag. From there a four is likely to be any of about 10 different combinations.
For up to the minute charts in all time frames visit.
http://indexinsight.com
correct 4 can only overlap 1 in a leading or ending diagonal and a triangle 4
so if this is the correct count
IV cant go below I, correct?
You are correct DT. Here is the updated chart.

In the gold chart you plotted (green) Wave [ii] at 1241.70.
But that wave appears to have retraced down to 1204.83.
1204.83 is below whereWave 2 started at 1214.30
Does this change the wave count?
I just noticed an error I made in my last post. Wave [3] began at 1991 not 1810. 1810 was the beginning of cycle V.
It appears that Primary [3] of Cycle V ended at 2390.
This primary wave [3] that began at 1810 is having a hard time ending. Target for [3] has been 2500 since July 2016. Two possibilities exist right now. One is that [3] ended at 2485 and the other is that [3] will end at 2500. In either case we will see 2450. What happens there will tell us which is right for the end of [3].
2485 did it. Next target is 2325.
Looks like we will hit that 2500 target after all.
It is possible wave [3] was complete at 2477.62. This would mean that we fell short of target first set in July 2016 by 22 points.
GOLD continue to move higher in [C] of Cycle wave B.
Next target is 1378 which should be hit Prior to mid August.
For daily updates on Gold and up to the minute updates on SPX join me at:
http://indexinsight.com

Target for Primary [3] is 2500.
See chart at http://indexinsight.com
SPX - Next target remains 2400. http://indexinsight.com/
Gold. This continued rise in Gold has revealed a need for a count change. This Cycle B wave is not over as previously thought. It could have been but now we see that is not the case.
Wave Primary [C] of Cycle B will be five waves long and should reach the 50% retrace of Cycle A.
This is the most obvious count at present.

It is possible that 4 is complete at 1246.60 and we go down in 5 for about 114 points in five waves. this
The most common pattern for a four is a flat. That is pictured on the chart.
Regardless which of these two is correct we will decline to near 1125 before turning up.
Upon reaching near 1170 stay alert in case iv is forming a triangle.
In this case we will turn up to about 1210 before dropping again for a short drop then a little bounce to finish the triangle. then we go down in 5.
Bottomline is may hit 1170 and turn up but will most like hit 1125 before turning up.
If we break 1248.90 to the upside from here then there is something else going on and I will have to reconsider.

Paul, Can we get an update on the Gold count? Thank you
I put a long term SPX chart on my website.
http://indexinsight.com/
GOLD has hit the minimum target 1125 for this wave down. It can go lower but stay alert as the minimum has been hit. Expect a wave 4 bounce at any time. Then we go down again.
SPX - Intermediate term is all up. see chart at
http://indexinsight.com/
With break of 2114 target for (2)was 2070-90. Having completed Intermediate (2) of Primary [3] of Cycle V off 1810.10 at 2083.79 we move higher in Int. (3),
Intermediate (3) target with 83% odds is minimum 2400.
2114 Oct.13 low was most probably the end of Intermediate (2) of Primary[3] Of Cycle V. Intermediate (2) was a double three which began at 2187.66 on Aug.9. Next target is 2432 for Intermediate (3.
Cycle V began at 1810.10.
Projections are the most probable outcome based on current evidence.
For targets and direction in every time frame and up to the minute charts go to http://indexinsight.com/
Join me for a free 5 day trial in the Trading Pit forum.
The forum exist for those who have an interest in Elliot Wave and want to profit from the great advantage it gives the trader.
No less than three options after Friday's Break down out of the range.
We could have finished or near finished the drop on Friday. If we do not stop here we go to 2066 to 2089. If we do not stop there we go to near 1955.
So we have three down target zones. At one of these we will stop and turn North and soar to new ATH.
S&P Record breaking range bound action.

GOLD may have completed Cycle wave B of the correction in the decline from 1923. The correction retraced 38.2% of the decline. This is the most common retrace for a B wave in an ABC zig zag. This Cycle ABC is a correction off the 1923 high.
If wave B is complete it is all downhill from here in Cycle wave C. Target for gold is near 500 in this huge correction. Cycle wave C will most probably be a five wave impulse (5-3-5-3-5) but it could be a five wave ending diagonal (3-3-3-3-3) with wave [4] overlapping wave [1].
See board header for information on how to receive a free 5 day trial in the Trading Pit forum. You will see S&P Elliott Wave Charts in all time frames from 1 minute to monthly and timely gold updates.

The theme and focus of this board is Technical Analysis in all of its many forms. Foremost here is Elliott Wave Principle. In my opinion the very best system for predicting turning points and market direction in every time frame is Elliott Wave. The proof of the pudding is in the tasting. Nothing compares with it.
Geopolitical and Economic News is of vital interest. We will all attempt to stay on topic. Posts that are not on topic are subject to deletion.
Technical Analysis is the forecasting of future financial price movements based on an examination of past price movements. Like weather forecasting, technical analysis does not result in absolute predictions about the future. Instead, technical analysis can help investors anticipate what is "likely" to happen to prices over time. Technical analysis uses a wide variety of charts that show price over time.
Taken from StockCharts Chart School.
Please lead with the name of the person you are addressing or the topic of your post.
Personal attacks will not be tolerated and the post will be deleted.
I have a low tolerance for antagonism and your antagonistic posts will be deleted.
Differing opinions are welcome and will be treated with respect.
If you need assistance posting charts or have other questions just ask.
Please remember that everything that I say or imply on this board is strictly for entertainment purposes and is not meant
to be used in any way for trades with real money. POKERSAM
Join me in The Trading Pit
You will get Targets, support and resistance and turning points for ST, IT and LT.
I am there all day, every trading day, to post charts, answer questions, and provide play by play commentary. That is what is different about my Trading Pit Forum.
For more information go to http://indexinsight.com/
"But forecasters' concerns should be not whether human response is rational or irrational, only that it is observable and systematic." Allen Greenspan
"The bottom line is that certain patterns of price movements have proved through observation over time to be consistently repeated in a systematic fashion." POKERSAM
THE FAIR TAX Please read "About The Fair Tax" before passing judgement. I believe the more you learn about it the more you will appreciate it and become a supporter. https://fairtax.org/about/how-fairtax-works?gclid=COa8kfnH684CFQQGaQodMfINNw
THE LIBERTARIAN PLATFORM http://www.lp.org/platform
Always remember, "It's not done till it's over done."
If you are a "Rigged Market Conspiracist" please talk about it somewhere else. That topic is totally off topic on this board.
US Dept Clock http://www.usdebtclock.org/
The big challenge for every American is to separate the truth from the propaganda.
What is the richest and most powerful criminal organization on the planet?
It is the first duty of every patriot to protect and defend his country from its government.
"government even in its best state is but a necessary evil; in its worst state an intolerable one"
| Volume | |
| Day Range: | |
| Bid Price | |
| Ask Price | |
| Last Trade Time: |


