 News
News  Market Data
  Discover
Support: 888-992-3836
Copyright © 2023 InvestorsHub Inc.


Register for free to join our community of investors and share your ideas. You will also get access to streaming quotes, interactive charts, trades, portfolio, live options flow and more tools.
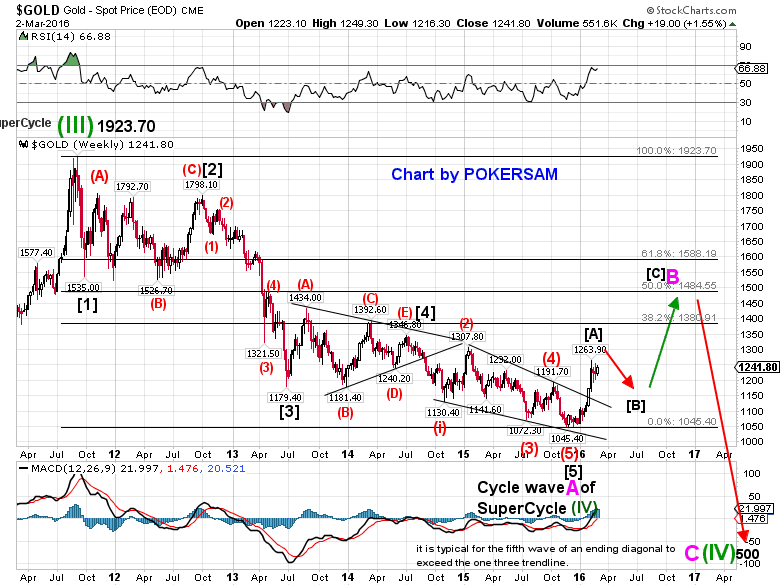
IMO we are just beginning [iii] of 3 of (3) of [3] of Cycle wave V.
Cycle wave V began at 1810.10. Cycle V has a target of <2550.
For up to the minute charts in all time frames go to my web site.
See header for information on free week.
Gold has higher to go in this Cycle wave B. It looks like [C] of B is forming an ending diagonal.
The bullish scenario is primary. Cycle wave V target is north of 2550.
SPX = A lot has happened since my last SPX post here. We had the Brexit drop and pop and hit an ATH on the pop.
Fortunately we were looking for a large down move off the 2120 high and were looking for a 1,2,3 down. The pattern was correct but it was an A,B.C rather than a 1,2,3. It did not matter at all to the profits made.
After the too far, too fast Brexit drop we went long at 2000 and were surprised when the market climbed to a new ATH. We are appreciative of the profits, however.
The new ATH has opened the possibility of a trip to 2500 in a Cycle wave V. There remains the possibility of a massive collapse down.
The question of which of these two possibilities is correct will be resolved by the depth of this next correction down which is due.
GOLD - Still going up in (3) of [C]. Gold has completed three nested 1,2s since it completed the wave [B] correction at 1201.50.
GOLD wave (2) target hit now up in (3). All gold calls can be found in the Trading Pit. See header
Top call of 2120 still standing. Just thought I would remind you.
Now looking for primary wave [3] down.
Enjoy.
Great call POKERSAM. Even more impressive is that you've had the 2120 target for a VERY long time.
Will be watching the 1995 level on the trip down.
Pat S.
SPX - Now that target of 2120 has been reached we must continue to impulse down to get confirmation that 2120 was an important high.
The reversal is very very young.
My expectation is that we will do so. The advance from 1810 has put in five waves. The 3 extended and the 5 was near the length of 1 and surpassed the top of 3. This all indicates it was a complete five waves. We will know real soon if this correct.
This five waves from 1810-2120 would have to be a wave one or a wave C. In either case there needs to be at least a 50% retrace of the 1810 advance. If we continue down hard after that it was a C wave ending a wave [2] correction. That would mean we are in Primary [3] down.
So we will see the market does at this important point.
It is all about probabilities.
Your feedback would be appreciated.
GOLD - 1. If gold breaks 1258 right away the next target is 1480.
2. If gold does not break 1258 right away it has another leg down to go. Target area is 1165.
Thanks much.
$GOLD chart looks heavily overbought, $USD heavily oversold.
What's worrisome is that even with this drop in the buck, equities can't make new highs.
GOLD - Dollar will trend up and gold will trend down. Gold target is about 1185 to 1197. This move should take a month or so.
For S&P and gold charts of all time frames visit me at
http://indexinsight.com/
So where is $GOLD headed next? The daily chart looks vulnerable but the weekly chart looks strong.
Is the next move to 1500 or back to 1100?
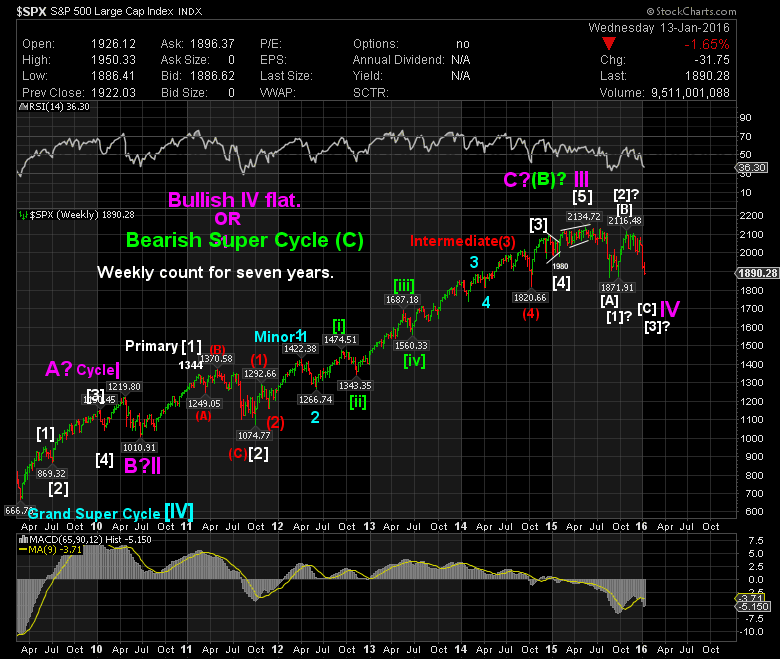
My target for the end of [2] at 2115-2125 is still my favored outcome. Primary wave [2] began in Sept. 2015 at 1871 and is playing out as an expanded flat. We are near the top of the (C) wave that began at 1810 last Feb.
The crash of 2016 will follow the completion of wave [2] as we go down in Primary [3]. This move down will seem bottomless and continue LT.
The alternate is not really that much better for the intermediate term. A new ATH break of 2134 will alter the count but the intermediate term result will be the same. A decline to near 1800 will follow a ST top. Then we will move higher to the 2425-2500 area.
For charts and running commentary covering all time frames go to http://indexinsight.com/
Sign up for five day free trial. Why not?
As happens often when there is a long impulse with many distinct waves there is more than one way to count it.
We have advanced from 1810 with many waves in an impulse.
If we hit the area of 2115-2125 and drop dramatically one count of the 300 point advance from 1810 will be correct.
If we hit the area of 2115-2125 and go on to a new ATH the other count will prove correct.
Bottom line is that going flat for a while once we hit 2115-2125 would seem the prudent thing to do until the question is resolved. In either case there will be plenty of time and plenty of dramatic moves to play.
Well, 9 days stuck in a 2% trading range stretched the time out so we did not make it to target today. Target remains the same but we have a couple of small degree waves to put in first.
Wave[2]should end April 15 @ 2115-2125. Then we will begin the crash of 2016.
http://indexinsight.com/
Yes, that is still my count. [2] is not complete. First target is 2098.
Pokersam
this count is possibly still in place?
http://www.siliconinvestor.com/readmsg.aspx?msgid=30517353
SPX - Every indication is that top of [2] occurred at 2056.
That means we are in Primary [3] down. So we are looking for the epicenter of Primary [3] down. eh? LOL
We broke 2019 and hit 2046 today. So as we begin the big drop tomorrow it will take a little longer to get to 1690.
Guys listen. This move from 1810 up to 2046 was a bear market rally. That is all.
Look at a daily chart or an hourly chart of the past 5 months.
Note the volume has not supported this rally. It has declined as the market climbed.
On the 60 note the huge negative divergence on the MACD.
This bear market short covering rally will not end well for the bulls.
When will it end? Well, we hit 2046 today and it is possible to count five complete waves from 1810. It could be all of (C) of [2] off the May 2015 ATH at 2134. In other words it could have ended today. We will see.
A break of 2134 and a new ATH will invalidate that of course. That break would mean near 2500 for a top.
da cheif, I call him Duh Chump, is what is known as a perma bull.
He was bullish throughout the last two cyclical bear markets of 2000 and 2007. In my mind that makes him a Chump. heh heh
He thinks our next stop is 5000 S&P.
We definitely will reach 5000 S&P but not before a trip down to less than 666 and decades pass. I don't think he or I will live to see it. LOL
Yes, he is the same guru who called for 60,000 INDU in 7 years about 4 years ago. Not doing so good, at least so far. LOL
SPX As long as we do not break 2019.39 we will hit 1690 the first of April. If we do break 2019.39 we will still hit 1690 but not till later.
For the very best Elliott Wave charts in all time frames every trading day visit http://indexinsight.com/
GOLD May be nearing the end of A. Looks like one more push may do it.
$SPX Well, we did plus a little more. We should get(5)now.
My thoughts through the words of another.
http://www.cnsnews.com/commentary/charlie-daniels/charlie-daniels-open-letter-americas-enemies-you-see-obama-you-dont-know
No worries on the delay.
Thanks for the chart.
So it looks like 1500 later this year, then the collapse? If $GOLD goes back to 500, then surely $USD is going WAY up.
That thesis makes a lot of sense with what I'm reading with other long-term cycle forecasts.
The rest of the world crashes first, leaving the U.S. as last man standing. Mad dash for dollars and U.S. Treasuries.
SPX - Intermediate (4) of Primary [3] off the 2116 high may have completed at 1947. If not it will. If it did, which is probable, we are in a long (5) down.
For up to the minute charts in all time frames join me in my Trading Pit forum for a free five day trial. Just Email your prefered username and password. paulstrunk@sbcglobal.net
str8 - Sorry for the delay. My target of 960 on the down side which I have had for over a year proved to be too low. I now have us in wave A of Cycle B.
Note time on the chart is just a guess. As you pointed out the last couple of weeks have been dramatic. With the dramatic moves of all markets lately, time may be compressed.

Just wondering what your target is for $GOLD?
Powerful move in a little more than a week.
hi POKERSAM,
Someone over at TT pointed out this post. Great analysis. I see the same long term conundrum with cycles.
cheers,
john
n the past 9 months the market has moved down 5,500 points. The perma bulls never made a dime on it.
They were watching the sky and looking for the epicenter of primary wave 3 up.
The only thing dumber than a perma bull is a perma bear. The market goes up in five and down in three. The three down normally retraces 50-60% of the five up. Over the long term the market gains more points than it loses. That is why a very long term chart of the stock markets shows a line traveling from the lower left to the upper right. History has shown that the markets always come back. It may take weeks, months, years or decades.
The problem is that we have a beginning and an ending. Our life as a trader is limited.
During the time we have we need to ride the market in whatever direction it is going at the time. It doesn't matter if it is going North or South. You will not always get it right. Most of the time is enough.
There is nothing wrong with being wrong. There is something terribly wrong with staying wrong.
There are more perma bulls than there are perma bears. Being bullish is easy, anybody can do it. It is the natural state of man to be optimistic. The problem with that is that we do not live forever.

stkboy1 - I watched it all. Thank you.
This is a good video from Chris Ciovacco. Compares previous market tops and bottoms using monthly averages.
http://ciovaccocapital.com/wordpress/index.php/stock-market-us/monthly-stock-signals-hard-to-ignore/
It appears wave 4 of (3) from the 2116 high was incomplete. It also looks like it will take the form of a triangle. I hate fours as you know. They can take so many different patters and combination of patterns. They can drag on forever and just when you think they are over and you are in 5 you find out it is not so. The bad thing about them is that there is no way to tell if they are over till they are, and then you cannot be sure. LOL
Anyway we are in 4 of (3) of either [C]down or [3]down. If have explained that befor. If you have a question about it ask it.
We are in a bear market. Play by bear market rules. Sell the bounces. Early or late the market falling will rescue you.
You can join me and see charts of all timeframes for a free week.
Just send me an Email with your preferred username and password.
I'll email a link to the forum.
It's just that simple.
See header or go to. http://indexinsight.com/
lol I think I got frustrated for a while there. I took a lot of heat over the years for keeping the door open to one more leg down.
Then when it drug on and on going up I lost heart. heh heh
Yes, It is probable that the long awaited wave (C) down has begun.
I have explained this so many times over the years I could do it in my sleep. http://investorshub.advfn.com/boards/read_msg.aspx?message_id=119829558

I see Tony Caldaro has received a bearish confirmation and has now switched sides. I know you always had the two options open but did declare in December 2014 that the bear did end at 666 and that we are now in a new secular bull market. That did surprise me at the time as I just couldn't see it, perhaps because the TSX and the global economy did seem weak. http://investorshub.advfn.com/boards/read_msg.aspx?message_id=109331384
The market has been difficult to read and we now see many with bearish calls when just a couple of weeks ago they were all bullish. Even those point and figure charts are the same way.
I just hope this is the long awaited Wave C to finish off the bearish trend and make the final flush to finish things off.
Gold - It likely topped at 1113 missing my target of 1118. If so it is all downhill from here.
In the second paragraph I meant to say we go to a new ATH in Cycle Wave V rather than IV.
There are two options at this point. From the top at 2134 we have a Primary [123] or a Primary [ABC]. We are in Primary [3] or Primary [C]. One is bullish and one is bearish.
If it is a Primary [ABC], when it is complete we go to new ATH in Cycle wave IV of Super Cycle (1). Target of about 2425 to end Super Cycle (1) off the 666 low. The secular bear market Grand Super Cycle IV ended at 666.
If it is a Primary [123] then we are in a Big Cyclical Bear market with a target below 666. We are in Super Cycle (C)down of Grand Super Cycle IV. The secular bear market that began in 2000 did NOT end at 666. 666 was the end of a flat Super Cycle (A). The advance from 666 to 2134 was Super Cycle (B) and we are in Super Cycle (C) of Grand Super Cycle IV.
The bounce from [3] or [C] will tell us which it is. I have been pointing to this bounce for several years as the tell. Both of these options have been in the works for 6 years. The big question for me has always been "did Grand Super Cycle IV end at 666". Is the secular bear market of 2000 over at 666 or does it have another leg down?
For up to the minute charts in all time frames. http://indexinsight.com/
You still counting this as a [2] ? ............and what count will you have if we break below 1871? Will you change that to a IV and V hadn't really started?
TSX has taken a big hit since September because of energy and it looks like we haven't found a bottom yet.
TIA for your thoughts.
SPX and GOLD Yeah, If we bottomed and bounce from 1918 we should hit 1980.
Gold - Same target since 1045 early Dec. 1118-25
http://indexinsight.com/ For free, no obligation, five day visit.
Just send me an Email.
Yes, I would expect no less than a 60 point bounce in $SPX within the next few trading sessions.
How about $GOLD? Still holding to the 1118 to 1125 call? Not far away from here.
That was the right move. We should get about a 70 point bounce here soon. It definitely should be sold. Just a word to the wise.
Tues was a Bradley turn date.
Dec of '15 was a down month as was Dec of '14. Uncommon to have a down Dec (even '08 was positive) but to have two years back to back like that is rare.
2015: The year of distribution.
Hence, I prepped for the worst this year.
SPX - My next major target is 1690 to 1705.
For charts covering all time frames go to http://indexinsight.com/
Take advantage of no obligation free five day trial.
SPX Well, I had resistance at 2076 and support at 1993. Break the top at 2076 and I am all bullish. Break the support at 1993 and I am all bearish. So what does the market do? First it breaks 2076 and I have to pen up the bear for 2016. Then it drops and breaks 1993 and I have loose the bear and he rips the bulls head off.
The essence of a down trend is lower highs and lower lows. We clearly have lower highs. 2134, 2132, 2116, 2104, 2081 A lower low below 1867 will confirm the bear is loose by providing another lower low.
He may be coming for you yet. At inflection points when the market's count can go either way you must remain flexible. Of course if you are a perma and wrong you will be killed. When a bullish count and a bearish count will both work you just have to find the points that invalidate one or the other.

SPX Chart including 2016. The general consensus among the board posters seems to be that 2016 will be a bear. At the present I do not share that opinion. Late 2016 to early 2017 we should hit 2500. Then we enter two years of recession and markets will decline hitting 1500 to 1600.
REMEMBER: It's never done till it's overdone.
What are your thoughts?

GOLD - Target remains the same.
The theme and focus of this board is Technical Analysis in all of its many forms. Foremost here is Elliott Wave Principle. In my opinion the very best system for predicting turning points and market direction in every time frame is Elliott Wave. The proof of the pudding is in the tasting. Nothing compares with it.
Geopolitical and Economic News is of vital interest. We will all attempt to stay on topic. Posts that are not on topic are subject to deletion.
Technical Analysis is the forecasting of future financial price movements based on an examination of past price movements. Like weather forecasting, technical analysis does not result in absolute predictions about the future. Instead, technical analysis can help investors anticipate what is "likely" to happen to prices over time. Technical analysis uses a wide variety of charts that show price over time.
Taken from StockCharts Chart School.
Please lead with the name of the person you are addressing or the topic of your post.
Personal attacks will not be tolerated and the post will be deleted.
I have a low tolerance for antagonism and your antagonistic posts will be deleted.
Differing opinions are welcome and will be treated with respect.
If you need assistance posting charts or have other questions just ask.
Please remember that everything that I say or imply on this board is strictly for entertainment purposes and is not meant
to be used in any way for trades with real money. POKERSAM
Join me in The Trading Pit
You will get Targets, support and resistance and turning points for ST, IT and LT.
I am there all day, every trading day, to post charts, answer questions, and provide play by play commentary. That is what is different about my Trading Pit Forum.
For more information go to http://indexinsight.com/
"But forecasters' concerns should be not whether human response is rational or irrational, only that it is observable and systematic." Allen Greenspan
"The bottom line is that certain patterns of price movements have proved through observation over time to be consistently repeated in a systematic fashion." POKERSAM
THE FAIR TAX Please read "About The Fair Tax" before passing judgement. I believe the more you learn about it the more you will appreciate it and become a supporter. https://fairtax.org/about/how-fairtax-works?gclid=COa8kfnH684CFQQGaQodMfINNw
THE LIBERTARIAN PLATFORM http://www.lp.org/platform
Always remember, "It's not done till it's over done."
If you are a "Rigged Market Conspiracist" please talk about it somewhere else. That topic is totally off topic on this board.
US Dept Clock http://www.usdebtclock.org/
The big challenge for every American is to separate the truth from the propaganda.
What is the richest and most powerful criminal organization on the planet?
It is the first duty of every patriot to protect and defend his country from its government.
"government even in its best state is but a necessary evil; in its worst state an intolerable one"
| Volume | |
| Day Range: | |
| Bid Price | |
| Ask Price | |
| Last Trade Time: |


