 News
News  Market Data
  Discover
Support: 888-992-3836
Copyright © 2023 InvestorsHub Inc.


Register for free to join our community of investors and share your ideas. You will also get access to streaming quotes, interactive charts, trades, portfolio, live options flow and more tools.
Working fine for me. Also just checked the PingDom monitoring site and it shows no interruptions recently.
stats.pingdom.com/g0fdmqv6vgnb
Seems to have resolved. I guess if no one else experienced that, it must have been a local issue or something with my ISP.
Anyone else experiencing a problem with charts not loading this morning?
Cush…….thank you for your timely response and for the link. Hopefully there will be a fair amount of good info there to answer my questions and other questions as they arise. Thanks again!
Hi quanti,
You are dealing with a portion of the market that I do not trade and I know nothing about.
If I had a question like yours I would probably ask it over on the StockCharts Answer Network. A lot of the contributors there are working with scans every day.
Here's the link.
http://scan.stockcharts.com/
Cush
In need of help with scanning parameters………I want to scan for all stocks under .01 which have dropped 50% or more either at open or intraday. And I want to be able to scan for a complete list of stocks which are priced at .0002 and under or .0001 and under.
HEEEELLLLLPPPPP!
Where can I find charts that show where a stock was at premarket and after hours?
During the trading day today, the chart reflected the premarket price but at the end of the day, it's now gone.
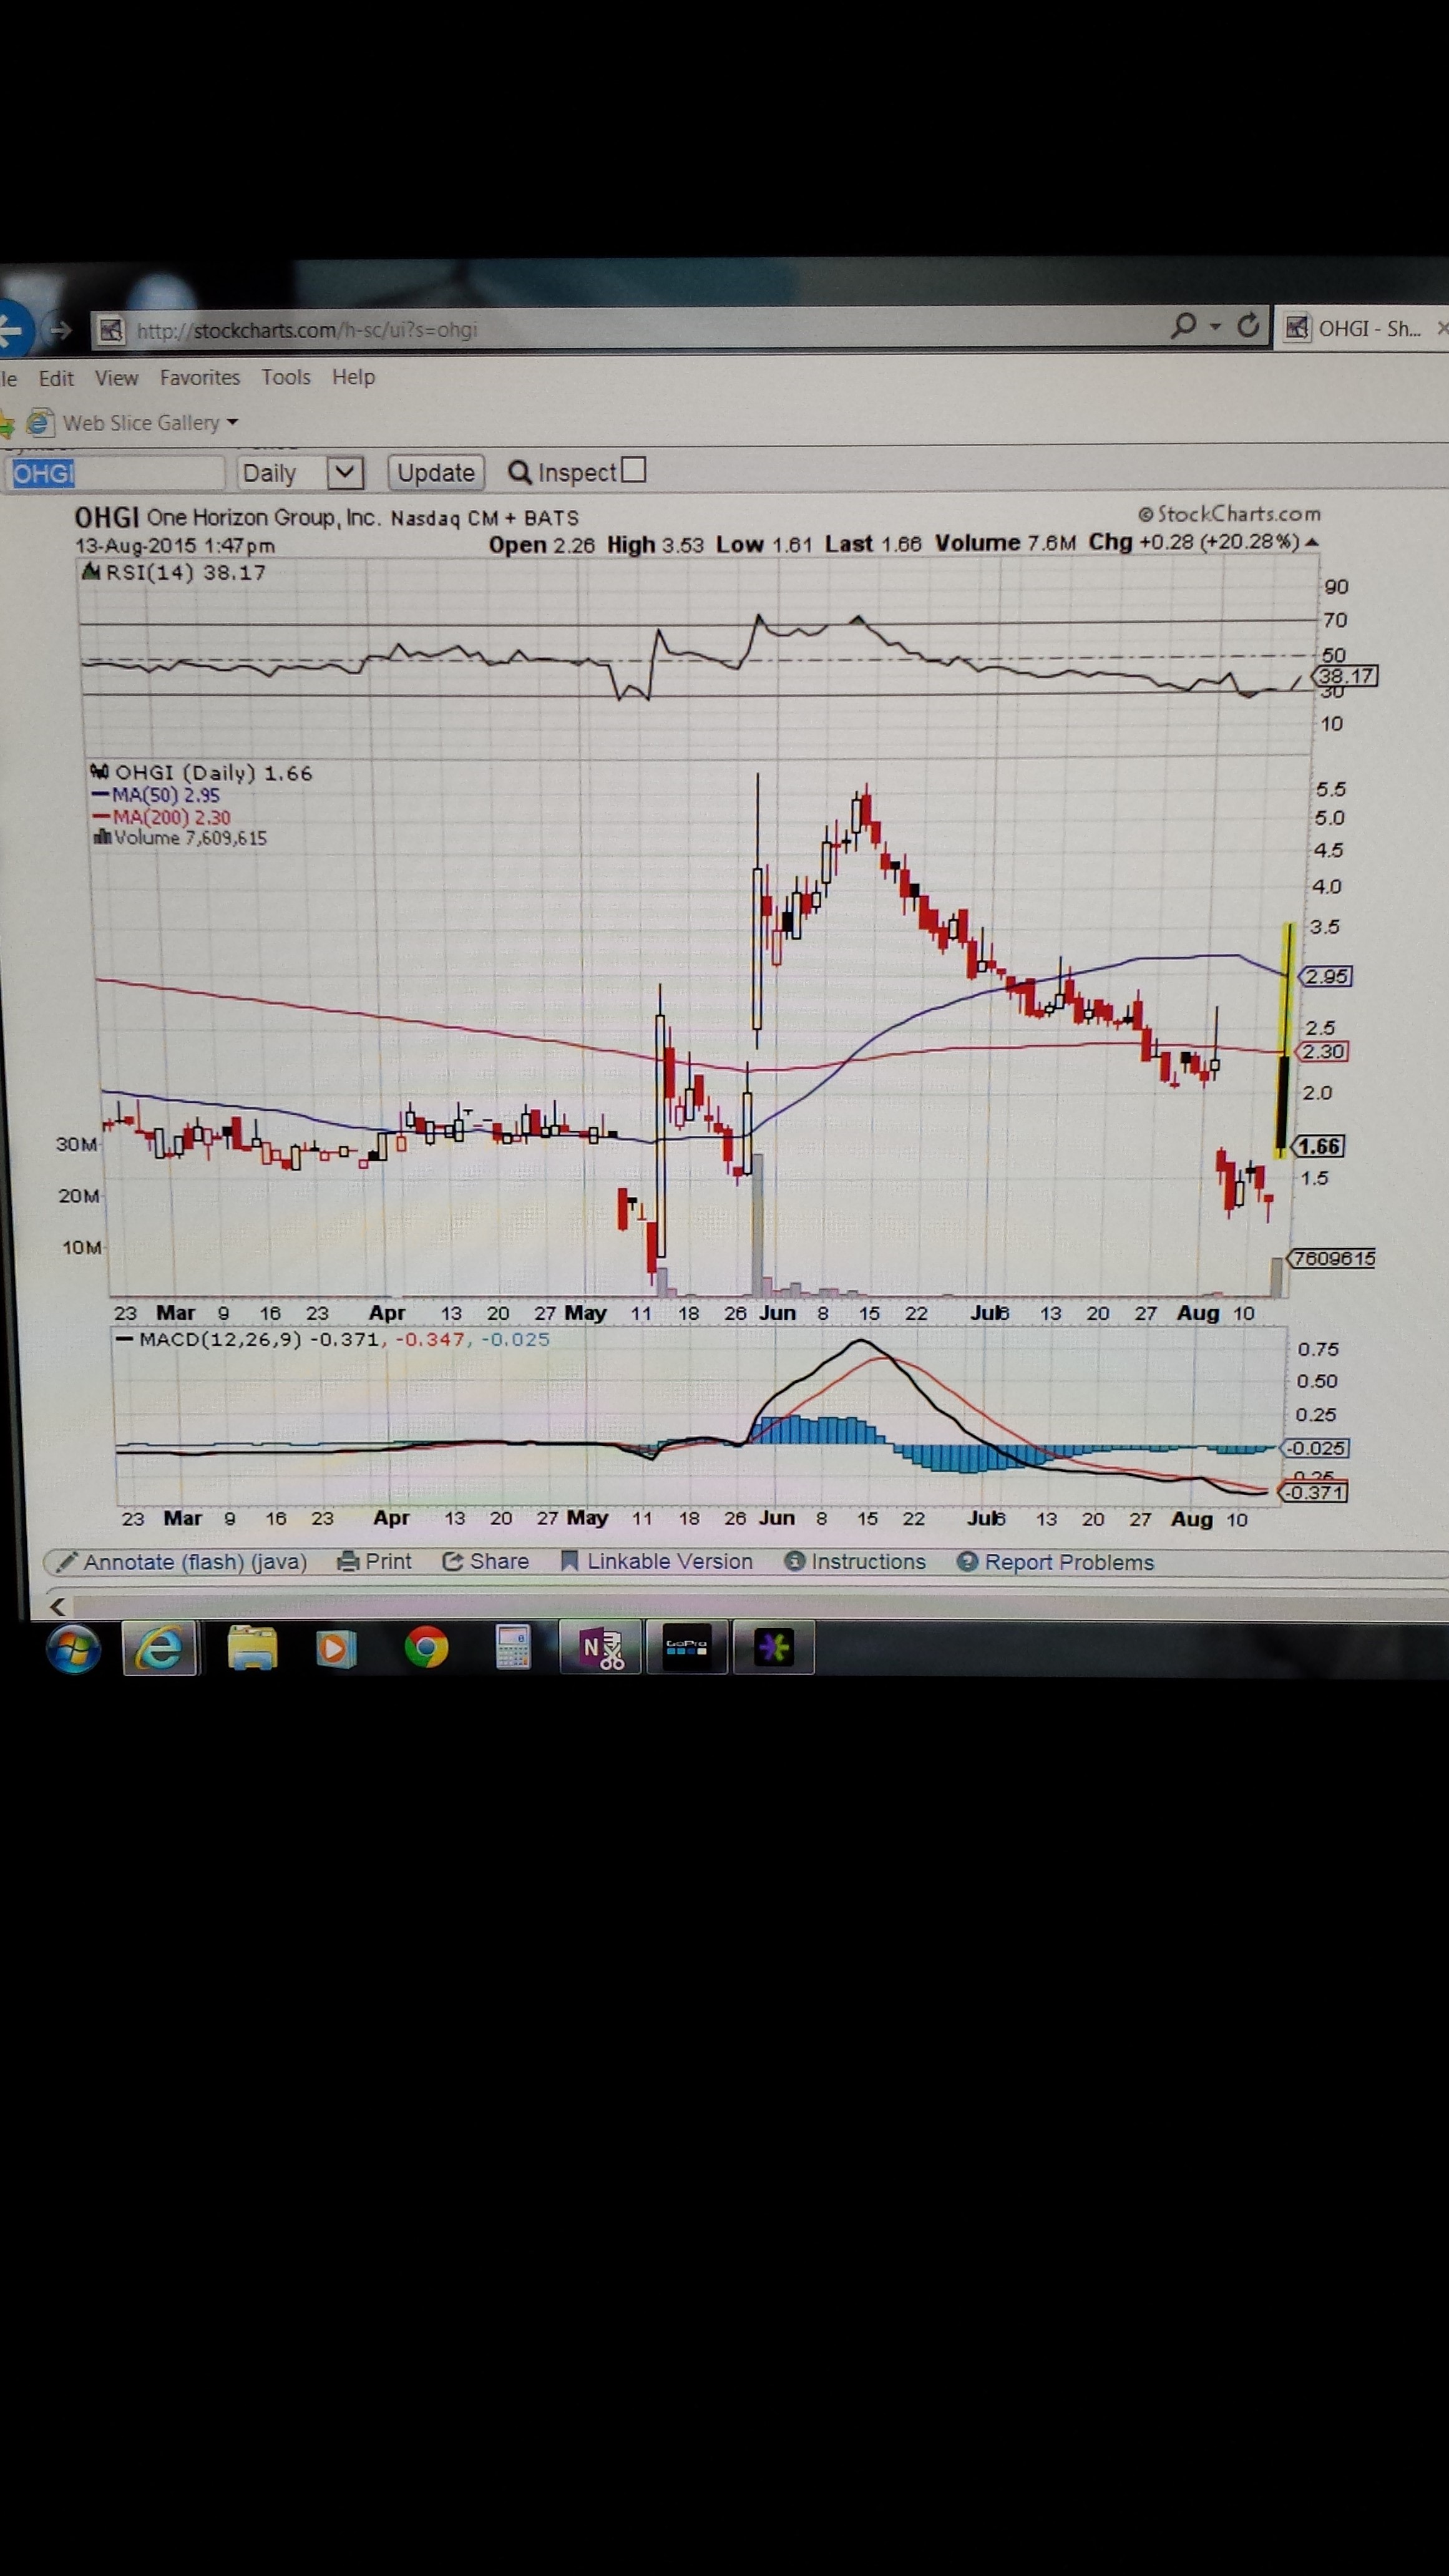
OHGI went up to over $3.5 in premarket this morning.
I'd love to know where I could find charts that show pre/after hours prices.
Thanks to anyone who can help. Maybe its not stockcharts.com I don't care ~ Help a guy out 
For reference, here's what the chart looks like now on stockcharts.com
And here's what it looked like before market closed, having gone up to $3.5
Just seeing your note now. 3:30 am? I spend a lot of hours on my charts, but that's sleep time for me. Obviously it was resolved. Hope it wasn't too long. The site was working as usual by the time I logged in early yesterday morning.
Cush
Site down -- I first got a mostly blank yellow screen, then I got the s.c.a.n. page. The European markets are opening, and it would be nice to be able to work on my charts. Anyone know what the problem is? Thanks
My charts don't say recession yet, but certainly a good sized correction.
Hi Duma,
"Step by Step Trading"
I liked some of the ideas he presented and have incorporated them into my own TA method.
Once again, we've entered some interesting times in the markets.
Take care,
Cush
What was the name of the Elder book you downloaded. There are several listed. Thanks.
Still Recovering After a Local Power Outage - We hope to be fully back up within the hour. Sorry for the problem. A free day of service has been added to all member accounts. Follow our Twitter feed for more updates.
The above note is now showing on the StockCharts.com site.
Back online again.
Gone again. It was a relief to have it for that little while. Please post if you notice it back up. Thanks.
Ditto but no explanation on the home page or member's page.
Back online, and working normally for me.
The home page does not even redirect to a generic information page, so the outage must be widespread IMO.
If anyone notices the site back online, please post here.
StockCharts.com is not working for me this morning. At first, I could access the site, but charts were not updating with today's data.
I cannot log on now.
I agree with you that the charting software is great, and I have learned so much over the years from the ChartSchool and now the Webinars.
Hope you find a solution to your issues. Perhaps Quasi will have some ideas for you next time he's around.
Cush
Here is a typical support question:
"For two years, I have been trying to get my account on S.C.A.N. to be confirmed by your system so I can participate in discussions. I never receive any email from your system to confirm my email address. Can someone help me with this?"
Your response further confirms to me that there are people that stockcharts.com deliberately ignores, simply because the person either asks too many questions or is seen as too opinionated. I found two old time posters on the prior S.C.A.N. system who also complain they cannot get new registrations confirmed.
They have such nice charting software, so it's a shame to be treated so horribly.
I have never been ignored by Support. I've been a Subscriber for 14+ years now. In that time though, I have only needed Support a couple of times. When I needed them, they answered promptly.
I do follow the S.C.A.N. discussion forum that was created. Same thing there - had no problem registering or posting. Some very interesting ideas posted there.
I am a heavy user of the StockCharts.com site. I am in there pretty much every day from before the markets open until sometime in the evening.
What sort of issues would require frequent Support requests? Maybe some of the people who follow this forum could help you.
Cush
Is anyone else being ignored by support? Are any of you ever getting confirmations that support ever receives your support requests, submitted through the stockcharts online support ticket form?
Unfortunately, stockcharts.com never talks to customers by phone. They hide behind a web form to submit support requests. Unfortunately, I only get a response one times out of 10. They claim they respond to every ticket, but I have our mail server log - before there is any spam filtering performed - and they are not sending any emails at all nine times out of 10. At very least, you would expect a company to generate a support ticket number and tell you what that is. They do not do this.
They have a new discussion forum as well. You register for that but many of us never get any confirmation of the registration, and therefore you never can post in the forum. Since there is no phone number to call, no support email or support form for the forum, and since the main support personnel do not respond, you never have any way to resolve the problems.
I distinctly get the impression that there are some users that stockcharts intentionally targets in the above ways, so it is less about ignoring everyone than it is about ignoring people that they see as troublesome in any way, for any reason.
If stockcharts is really this overworked, couldn't they resort to having a system where you spend $25/support ticket and then get a higher level of service? There has to be a way for them to pay some of their support costs without just abandoning users for years on end?
If anyone has any insight on how to get support from this company please share.
Scanning Saturday Webinars !!
I just did the first Scanning Saturday Webinar with Chip, bit of a learning curve with new software and live on the fly format, but great fun and great content, (I think).
Here's a compendium article with links to the Webinar recording and all the charts (with settings), used during the presentation.
http://stockcharts.com/articles/scanning/2015/04/scanning-saturday-web1-compendium.html
cheers Gord
I agree Cush, this is an excellent perk from StockCharts and a great read.
I met Dr. Elder at ChartCon 2014, he is an excellent presenter and trainer, I enjoyed listening and talking to him. If anyone gets the chance to go to the next ChartCon in Seatle, I highly recommend it. Always lots of great presenters and discussions with other users.
cheers
Elder's free e-book. Step by Step Trading.
On the weekend, I downloaded Alexander Elder's free e-book from the StockCharts.com site. As far as I know it is available to anyone who uses the site.
I have been at this trading game for a few decades now and I have developed my own system that works for me, but I am always looking for ways to improve my trading. There are some great ideas in the book; some regarding discipline, some regarding certain indicators - including those developed by Elder.
It's a fairly quick, easy read. I have read through once and made some notes, and I will be reading through again for sure.
Worthwhile, I think.
If you are interested, you'll find the download link in a March 30th update on the StockCharts.com site.
Cush
I am glad everything is working as it should. I have had to remind myself about clicking that linkable version button, as well.
That is a useful link to the Economic Calendar that you've placed in your profile - thanks.
Decided to follow your Cycle Trading forum, too.
Cush
Thanks for your response. I did go back through the procedure again this morning. I probable got lazy and did not hit the likable version before just coping the URL address. Thanks. I will pay better attention to what I am doing.
Hi Duma, I don't know why that is happening, but from time to time I post charts here on iHub.
The last time I was posting some charts I was having troubles so I reviewed the step by step for posting charts. I pinned a link at the head of this forum to the StockCharts.com explanation of how to post charts, depending on which browser you are using. When I followed those directions, the charts showed up in my posts as I wanted them to, and I just took a look back at some of those posts from months ago. The charts are still there in my format.
Maybe try going back through that StockCharts.com explanation. It worked for me.
Cush
I do a lot of posting of Stock Charts on iHub by coping the URL, pasting it into a iHub post and then using "image" to complete the format.
Sometimes my link will last for forever and sometimes it will corrupt and go to the standard SC format in just a few hours.
Anyone have an idea what is causing this or what I can do to stop it?
RRG graphs. Yesterday, I watched a very interesting presentation by Julius de Kempenaer (the RRG guy) as part of the Tuesday Webinar.
If anyone has had an interest in these RRG graphs, I recommend taking a look at the Webinar. A video of it can be accessed on the StockCharts.com Member page.
Here's a brief description of RRG's from the ChartSchool.
"Relative Rotation Graphs™ or RRGs as they are commonly referred to are a unique visualization tool to analyze trends in relative strength of multiple securities against a common benchmark and against each other."
This is something I think I will begin incorporating into my own system of evaluating stocks.
Cush
Webinars at StockCharts.com
I watched my first StockCharts Webinar this week, Arthur Hill, whose techniques and ways of explaining them I really admire. One of the things he did at the end of his presentation was to review the charts of stocks that those viewing the Webinar had requested. Well worth watching one of these if you are a subscriber. The Webinars are free for subscribers.
There is one scheduled for Saturday from 1 to 2 pm EST. It will be Chip Anderson with special guest Gatis Roze from The Traders Journal blog. The Traders Journal blog is full of valuable ideas about trading. Should be a good Webinar. If you are interested, here's the link to register.
https://attendee.gotowebinar.com/register/5170210802056216834
I don't know if that link will work, but you should be able to find a link when you login at StockCharts.com.
Cush
Thanks for your reply Quasi. Yes, you are right! But there is some buzz going on around that since they have money in the bank including reputable board of directors. So the low volume might change...Chart will always be helpful.
Did you use the request a symbol form, link below.
http://stockcharts.com/support/symbolrequest.html
However I have looked at the historical data on Sahara Energy and it may not meet the basic Technical Analysis criteria to be added to the data base. Being a penny stock with low volume and many days at a time without trades its not really suitable for Technical Analysis.
Remember data costs money to purchase and then there is the maintenance on that data. StockCharts is primarily a Technical Analysis charting site and that is their goal on applicable stocks.
That said if they do decide to add the data, it usually takes a few days, its not instant.
I have emailed Stockcharts to create a chart for SAH.V but nothing yet. Anyone know what can I do?
Yep you've got it.
http://investorshub.advfn.com/boards/read_msg.aspx?message_id=74409478
- How'd they do that ?
Users often see a chart and ask how'd they do that, what settings did they use? Well often you just have to experiment with settings, but first check the image properties, if it starts with something like "…ih.fotothing.com/76643.gif" start experimenting as its just a screenshot picture. However if it starts with "..stockcharts.com/c-sc/sc?s=XXX", you're in luck, it's from the Stockcharts image server. Copy everything after the equals sign (make sure to get it all), then open the Stockcharts charting page, pull up one of your saved charts or just create a new chart and click the link version button. Notice in the URL address bar it will start with ".. stockcharts.com/h-sc/ui?s=XXX", now just replace the chart link info copied above into the address bar after the equals sign and refresh the screen. You will now have the subject chart with all the settings displayed from the input charting server rather than from the image server, just scroll down and look at the settings.
"..stockcharts.com/c-sc/sc?s=XXX" Image server
"..stockcharts.com/h-sc/ui?s=XXX" Charting server
I haven't had any problems at all.
I would try a different browser and see if that works.
I am having no problem accessing the StockCharts.com web site. I am in there pretty much all day, every day. This morning, I have been on the site for the past hour or so.
I use the latest version of Firefox to access the site, but I also use IE most market days because of the way I like to configure my screens.
Have you added any recent software that might be blocking the site?
Cush
For whatever reason I am and have been unable to use stockcharts.com for the past few days now. I cant even get the site to open. I am not experiencing any other issues with any of the other programs/websites I use...
Anyone else having issues?
I tried a systems restore to see if the latest update to my computer was the cause...didn't help...
How to find a posted chart's setting ?
Right-click/properties only leads to static pic, no settings.
I searched a bit the StockCharts site but no success yet.
I remember not long ago reading somewhere about it, but can't remember where, was it iHub, was it StockCharts, can't tell.
thank you
EDIT:
is it :
- How'd they do that ? in Post 6917 (down the page) ?
http://investorshub.advfn.com/boards/read_msg.aspx?message_id=74409478
To add to that (though I may not be anywhere close to answering the initial question about images), if a person backtested a predefined scan and saved the results in a Chart List, it would be possible to apply start and end dates to one of the charts on the List in SharpCharts, then save that, then apply the saved settings to all charts on the List.
Cush
Ditto what Quasi said. I don't either.
If I wanted to see what a predefined scan produced several days ago, I would backtest the scan for that day.
And you probably know, any individual chart can be set for a defined start date and end date using SharpCharts.
Cush
I don't and I don't know anyone else who does.
Sorry.
Does anyone keep images for each day of Stockchart's Predefined Scans?
I post several charts a week to my Ahh Canada thread using those steps.
It seems to work better for me when I use Firefox.
Usually, I open the chart I want,
do the linkable version button beneath the chart,
reload with the link,
then right click the linkable version chart that results
and choose the "Copy Image Location".
I paste that link into my messages, after an intro with about ten words or so.
I highlight the link, then click the Image button on the left of the post window. That removes the http and puts in the Image brackets.
Keep at it. I am sure it just some little thing.
Cush
Thanks for the reply. I tried that method as well and it still shows up for me as just an icon that links to a new page.
Hi, about posting a chart from StockCharts.com
In the posting window, on the left side, there is an "Image" button.
If you post the linkable version from StockCharts, highlight the link, and click the "Image" button, it will remove the http: for you.
Should work.
There's no need to add the [chart - /chart] boxes.
This link at StockCharts explains it.
http://stockcharts.com/articles/step_by_step/2012/05/adding-a-live-sharpcharts-to-an-investorshub-post.html
Give it a go again. Let me know if it works for you. There is a test forum here at iHub if you want to try it there.
Cush
*** Important: Per the StockCharts TOS, IHUB users are allowed to post a MAXIMUM of 4 live embedded charts in a post or IBOX. ****
(this is a Privelge NOT a Right that IHUB users enjoy, please don't let a few abusers cause the loss of this feature for everyone)
This is a public area for StockCharts.com users to share information on the best ways to use the site. This board is not officially supported by StockCharts.com. The official StockCharts.com support page is http://stockcharts.com/support/techsupport.html
StockCharts.com Frequently Asked Questions (FAQ's)
http://stockcharts.com/FAQ.html
If the home page is offline, use the following URL links for access to sections which are on alternate servers.
Status Blog located on the Typepad servers at SixApart.
http://stockcharts.typepad.com/status/
Support Desk located on the servers at Zendesk
http://support.stockcharts.com/portal
Uptime reports on the servers at Pingdom
http://www.pingdom.com/reports/g0fdmqv6vgnb/
Instructions for embedding a live StockCharts chart in your post. Note this method should only be used where a live chart is needed, in most cases a static snapshop is better as it will still jive with your comments when someone reads it several days or weeks from now.
http://blogs.stockcharts.com/step_by_step/2012/05/adding-a-live-sharpcharts-to-an-investorshub-post.html
Chart and Link Posting 101 see #msg-74409478
, includes screen shots for all the steps along with some tricks and tips.
| Volume | |
| Day Range: | |
| Bid Price | |
| Ask Price | |
| Last Trade Time: |


