 News
News  Market Data
  Discover

Support: 888-992-3836
Copyright © 2023 InvestorsHub Inc.


Register for free to join our community of investors and share your ideas. You will also get access to streaming quotes, interactive charts, trades, portfolio, live options flow and more tools.
Heads Up, MAX -4- live charts per post or IBox
Notice to all IHub users who enjoy posting the odd live chart in their posts or IBoxes. It seems there are a few users who are not following the rules and are putting us all in jeopardy of losing this feature altogether.
Please follow the rules, MAXIMUM -4- live embedded charts per post or IBox
A little background...(as I understand it)
IHub / SI are the ONLY sites where we can post StockCharts live embedded charts in our posts. These sites were legacy supporters of Stockcharts when they started back in 1999 and as such they have allowed us the privilege to embed (hot link) charts into our posts and IBoxes, but within limits. If those limits are abused then we will all lose this privilege and none of us want that to happen. Remember this is a special Privilege only for IHUB users, its not a Right.
I am seeing users posting 10, 30, 50 or more charts in a post or IBox. Just tons of charts with no commentary or annotations, basically posted for no reason. The server horsepower ($$ Cost $$) to do this comes from StockCharts not IHub and as such it is up to us to keep the impact on their servers low. Now if you want to take static snapshots of tons of charts everyday and upload them to IHub and then paste them into your post that’s fine, this method is not a continuous ongoing server load for StockCharts, it becomes IHubs cost.
It’s the live embedded chart requests that cause problems with server loads (and cost) when many many charts are requested at once and no one is actually looking at them, but they still have to be generated by the servers at StockCharts and if any user has the IBOX turned on, the charts in the Ibox are regenerated on every visit or page refresh on that board. It is also a problem as it violates the members TOS with respect to using the StockCharts servers and re-publishing of charts from StockCharts.
Here's some links on the subject under the Polices section of the StockCharts website.
Supported message boards
http://support.stockcharts.com/entries/22648-supported-message-boards
Max live charts per message board post
http://support.stockcharts.com/forums/31090/entries/22647
Excessive chart requests policy
http://support.stockcharts.com/entries/21012-excessive-chart-requests-policy
Chart reprint policy, electronic media
http://support.stockcharts.com/entries/20524-chart-reprint-policy-electronic-media
(Except IHUB message boards are allowed 4 live charts per post for embedded charts, served up from StockCharts servers, ie using IMG tags).
Anyway I hope this info helps and gives you a little background into the whole story.
Please give this some thought and pass it on. I hope we can all put a stop to this abuse before this Privilege from StockCharts is revoked.
Thanks
Quasi
Chart & Link Posting 101, updated; April 15, 2012
The following explains the techniques for posting charts or links in various forms, directly from Stockcharts with various membership levels, for basic or annotated images. The examples are shown using FireFox, (IE users may have to massage the instructions slightly as menus and image properties are in different locations).
- Inserting a Web Page Link in your Post, (just a link NO image / picture)
To insert a link to the Stockcharts charting creation webpage, select your stock and set up all your overlays and indicators. Then hit the Linkable Version button (ID #1) just below the chart. This is a link which will take readers to Stockcharts and open your chart in the charting window, they will be able to see the settings for the chart and make changes, however user functions will be limited to the membership functionality of the reader. (ie free users will not see all the indicators & overlays if the chart is fairly complicated)
Note if you forget to make the chart linkable the URL (ID #2) will not include all the required information and readers clicking the link will be directed to the default $INDU chart and their default chart settings, (the linkable version button will add some coding and a "PXXX" number at the end of the URL, as shown below).
before hitting link version button
http://stockcharts.com/h-sc/ui
after hitting link version button
http://stockcharts.com/h-sc/ui?s=$SPX&p=D&b=3&g=0&id=p09964719132&a=112245579

To put this link in your post, just copy the URL (ID #2) and paste it into your new post message window and it will appear just as the link above. If you want to get fancy and have "Some Text" which is the link to the same URL page, then highlight the URL by dragging your mouse across it and then hit the URL button on the side. This will strip off the http:// at the beginning, add the URL tags around the link and it will add the "insert text here" tags at the end. Just replace the "insert text here" with whatever text you want. The following 4 images show the steps for this process and what the message would look like when submitted.
Hit Submit and it looks like this.
- Inserting an Image / Picture in your Post, (No link, just the image)
*** Important: Per the StockCharts TOS, IHUB users are allowed to post a MAXIMUM of 4 live embedded charts in a post or IBOX. ****
....(this is a Privelge NOT a Right that IHUB users enjoy, please don't let a few abusers cause the loss of this feature for everyone)
Note there are now 2 methods, A) old manual method, and B) new Stockcharts "Share a Chart" feature.
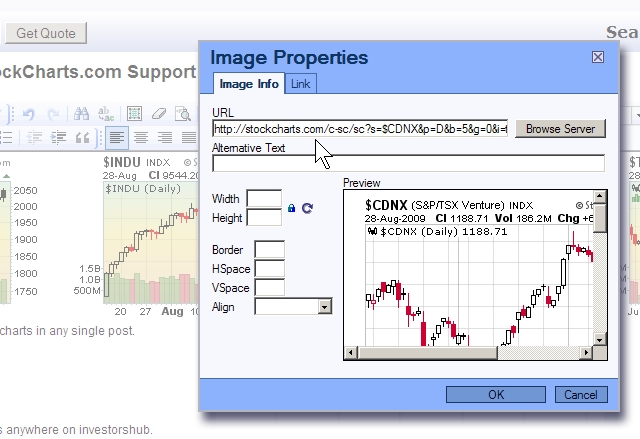
A) The original method to embed just the chart / image in your post we need to find the URL for just that image element in the webpage. Right click on the chart or image, then select properties (1) and then copy the location URL from the element properties box, be sure to get all of the link, swipe your curser from top left to bottom right, they often extend beyond the box a fare amount. Then insert the copied URL code into your post as shown below.

B) New "Share a Chart" feature at Stockcharts. This system automatically obtains the correct chart URL for you and eliminates all the problems associated with the many different operating systems currently being used. Just copy the URL code provided and paste into you post as shown below.
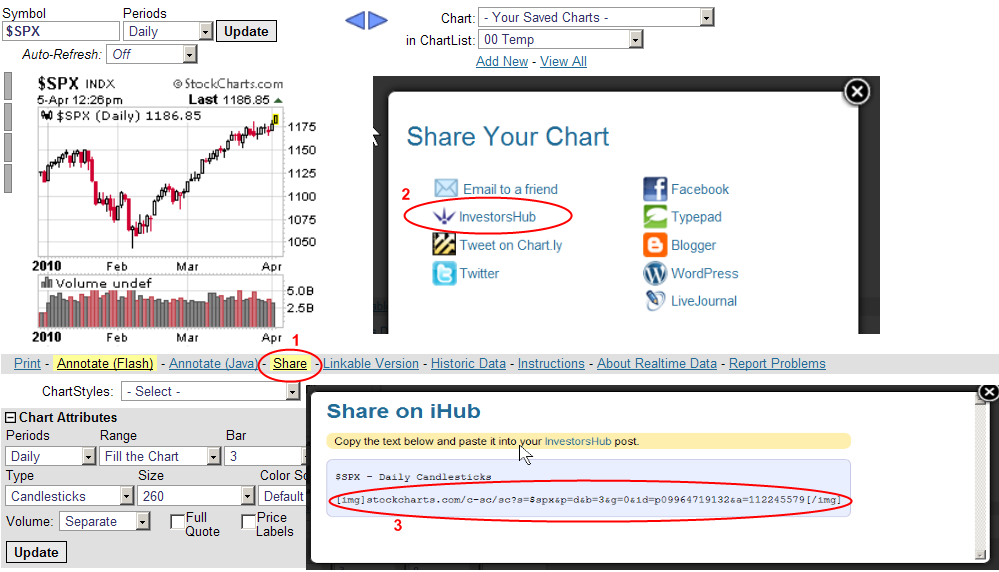
Now open the "Post New Message" or "Public Reply" window. Type your message and at the location where you want the image to appear just paste in the image URL. Then highlight the URL by dragging your mouse over it, then hit the Image button on the side. This will strip off the http:// at the beginning and add img tags around the URL. The following 3 images show the steps for this process and what the message would look like when submitted. Note if you've used the "Share a Chart" method, system (B) above, then you can skip this step as the http:// has already been stripped off and the IMG tags have been added, just paste directly into your post.
Hit submit and it looks like this.
Note in the previous IHUB message system the URL had to be edited and the tags had to be added manually, that system used the "Chart" tag (example below), which can still be used, however now the "IMG" tag brings IHUB more in line with other websites and standard internet HTML coding.

Single embedded chart
For Two charts side by side, just paste in the code sections right after the other, no spaces, no comma.
For one after the other just put them on separate lines.
- How'd they do that ?
Users often see a chart and ask how'd they do that, what settings did they use? Well often you just have to experiment with settings, but first check the image properties, if it starts with something like "…ih.fotothing.com/76643.gif" start experimenting as its just a screenshot picture. However if it starts with "..stockcharts.com/c-sc/sc?s=XXX", you're in luck, it's from the Stockcharts image server. Copy everything after the equals sign (make sure to get it all), then open the Stockcharts charting page, pull up one of your saved charts or just create a new chart and click the link version button. Notice in the URL address bar it will start with ".. stockcharts.com/h-sc/ui?s=XXX", now just replace the chart link info copied above into the address bar after the equals sign and refresh the screen. You will now have the subject chart with all the settings displayed from the input charting server rather than from the image server, just scroll down and look at the settings.
"..stockcharts.com/c-sc/sc?s=XXX" Image server
"..stockcharts.com/h-sc/ui?s=XXX" Charting server
- Annotated Charts
Posting an annotated chart from Stockcharts for Free or Basic level see the following. Note for members with Extra and above they can save the annotated charts on the Stockcharts server and then post them the same way as a normal chart, unless they require annotations which are not available in the Stockcharts Java tool, then this method can also be used.
Step 1, annotate the chart
Pull up your stock in the Stockcharts charting window, adjust all the settings to your preferences then hit the annotation button just below the chart. After the Java annotation window opens, mark up your chart as desired.
Step 2, save an image of the annotated chart on your computer by taking a screen shot.
(note screen shots are just pictures of whats on the screen at the time, if you have a large chart and have to use scroll bars to move up an down then go back and make the chart smaller or change your screen resolution so you can seen the whole chart)
Method 1, Windows Print Screen Utility
Use the Windows print screen utility to copy a screen shot (picture) to your computers clipboard, use the "Print Screen" button to copy the whole screen, or hold down the "ALT" button while hitting the "Print Screen" button to copy only the active window, ie the Java annotation window.
Now we have to get that image out of the clipboard and save it on your computer. One method is to open an image program such as MS Paint, select the "edit" menu and then the "paste" option, if there is a message asking to make the canvas larger, accept. Now select the "File" menu, then "Save As" menu. Type in a name for your image file, select the "Save as type" to be GIF or JPEG (the only ones allowed on IHUB) and navigate to the folder where you want to store it and hit the save button.
Method 2, Third party "Screen Shot Software Programs"
There are plenty of third party programs for taking screen shots, some are free and some cost $ but give you more features. I've used Gadwin for years and find it to be excellent for this purpose, you can copy the entire visible area of page or select just a specific rectangle.
Download and install Gadwins free print screen utility.
http://www.gadwin.com/printscreen/
Another option I've used is "FireShot", it is an addon for both FireFox and IE, its main advantage is that it can capture the whole web page, not just the visible area. This is a great help for larger charts as you get the whole chart and can just crop it to the size you want later.
http://screenshot-program.com/downloads.php
Step 2B, Third Party Annotations
At this point you have an image copy of your chart on your computer and you could add more annotations or special affects with a third party software program. MS Paint, PaintNet, PhotoShop etc.
Step 3, Upload your image to IHUB
There are other third party image hosting services both free and paid, or you could also upload to your own web server if you have one, but I will only cover the IHUB system here.
On the IHUB top menu bar, far right, 1- click the "Other" tab, this will bring up a screen which defaults to the "Image Upload" feature. 2 - Click the "Browse" button, navigate to your saved image and select "Open". Your file location and name will now be in the box, 3- hit the "Upload" button. You should now see "Image Uploaded Successfully" and a box at the bottom with the text to be inserted in your post to display the image. 4 - VERY IMPORTANT copy and save (paste) this information immediately, as you won't be able to find it again later if using the old Fotothing system. In the new IHUB image system you can review your library, however if your library is very large you may still have problems finding things.
The above steps in a screenshot annotated form, the old Fotothing system

The above steps in a screenshot annotated form, the new IHUB system
Hitting the add pictures link will bring up this window

Step 4, Create your post with embedded image(s)
Open the link for "Post New Message" or "Public Reply". Type your message and at the location where you want the image to appear just paste in the image URL (without the prefix http:// or www. ) and surround the URL with the IHUB chart image html tags, can't show them as text here so will use an image.

How to place a chart in the IBox
Open your IBox editor using the "Manage" link and then the "edit iBox" link, note you must be the moderator or an assistant on the board to see these links. Then use the insert image link which will open a box where you can input the URL for the chart, then just hit OK and save the IBox page.

In summary I trust these instruction will be of some help, happy chart posting.
Quasi
Myself and lots of others are reporting no unusual problems today. Their independent monitoring site also shows no down time or abnormal response times.
http://stats.pingdom.com/g0fdmqv6vgnb/72122
Quasi
StockCharts Server Problem Today?
Everything else is running for me just fine, bu SC is crapping out.
fringe
Yes I understand the situation, I'm still on FF 10 haven't done the ver 11 update yet. But yes they have had some quirks happening with some to the updates.
I can't seem to duplicate your specific problem, but one thing I did notice is I can just double click on the symbol box and it highlights the whole old symbol, then I just type in the new one. Of course I can still highlight it and hit delete, then type in the new one.
Maybe there are also some new mouse settings that are now a little different.
good luck
Quasi
Quasi and Cush, thanks for the replies. I am using Windows 7 Home Premium and Firefox 11.0. The problem started about a week ago. Let me try to describe it a little differently.
If the symbol is already highlighted, I can type in a new one without any problem. However, if the symbol is not highlighted (because I clicked on a different window, etc., then came back to the Stockcharts window), and I run the cursor over the symbol to "re-highlight" it, as soon as I take my finger off the mouse, the highlighting disappears. Then I have to re-highlight it again, and the second time it usually takes.
However, if I'm not paying attention and type in a new symbol without highlighting the box a second time, the new symbol appears in front of the old symbol (e.g., "AAPLMSFT"), and then I get no chart when I click to bring up the new chart.
Put another way, until about a week ago, if the symbol was not highlighted, I simply had to run the cursor over the box once to be able to enter a new symbol, and now I have to do it twice. Perhaps it coincided with a FF update about a week ago?
This should be my biggest problem in life, lol, but it is a nuisance when I'm trying to run through charts rapidly. Any thoughts? Thanks!
Working the same as it always has for me, same as described by Quasi. I am using Windows 7 Home Premium with Firefox Version 3.6.16
I haven't seen that type of problem, I'm running Win XP SP3 and Firefox ver 10.
For me the symbol in that box can be highlighted or not, depending on whether you just pulled up a chart from a Fav list or entered a new symbol or changed some setting on the chart.
If the symbol is highlighted, means my cursor is already there and I can just type in a new symbol which will overwrite the existing. If that symbol is not highlighted I have to move my cursor their and highlight it, delete the old symbol or highlight and just type over.
Now if the symbol is not highlighted and I just put my cursor behind the old symbol and start typing, yes it will just add more text to the existing symbol text and this will result in a bad symbol if I not paying attention.
If this doesn't seem to work for you, let us know what OS and browser type & ver you are using, perhaps someone can duplicate your problem.
Cheers Quasi
For the past week or so I've been having a problem with the "symbol" box in the upper left corner above the stock chart. When I run the cursor over the stock symbol to type in a new symbol, what I type doesn't replace the previous stock symbol, but instead just enters new text to the left of the old symbol, and when I hit enter, I end up with an invalid symbol response. This is happening on multiple computers, and only started about a week ago.
Any thoughts? Thanks!
Sounds like you want to schedule the running of a scan, then automatically copy the results into an email and send it to an address automatically.
I don't know of any way to do that automatically with StockCharts. But if you have access to read the email, why not just run the scan and see the results.
Is there a way to email myself a daily scan?
If not in SC, in some other program?
-Thanks!
I see on the sign up page right now is the coupon code "BESTCHARTS" for a 10% off special on your first month.
Here's a link which describes the membership specials, there are usually two times a year, spring & fall, when extra discounts are available. With respect to the special discount coupon, I think you are talking about the loyalty discounts which are accumulated and increase the longer you are a member.
http://blogs.stockcharts.com/chartwatchers/2011/05/celebrating-12-years-of-charting-with-our-spring-special.html?st=membership+specials
this info should get you started, not sure when the spring special will start this year, just keep an eye on the home page.
Quasi
Hi ChipA I want to get me a paid subscription of stockcharts.com I am tired of posting all those charts, thanks
Hi ChipA the message i receive from here at ihub was 4 to 6 charts was the limit, so on my last two post i use seven after seeing the post about the charts i am going with 7 will that be fine, i can live with 7, stocksharts.com has never personal said anything to me so do you think you guys can live with 7 if so i will honor no more than 7 charts, ChipA i need the the 7 chart frames buddy i can not afford the stockcharts.com charting package at this time.
I was original ask to limit my posting of charts to 4 to 6.
maybe by someone on your board i guess it was about two weeks a go.
so can we agree on the 7 charts.
My last two chart post have 7 charts not 20 as the person alamanjani said, after i seen all his post, but he is correct about the amount before i seen his postings.
http://investorshub.advfn.com/boards/read_msg.aspx?message_id=63098682
Thanks ChipA god bless and always the best of trading.
Tony
Hi ChipA I have a question to ask now that I can finally afford to get a stockcharts.com subscription how can I obtain a coupon to help with the monthly fee? ChipA can you help me to get a stockcharts.com coupon?
I want to sign up for the stockcharts.com sub / the $ 14.95 or the $ 24.95 per mo sub.
How can I obtain a stockcharts.com coupon?
Click here if you have a coupon code.
Order Summary
You are purchasing a new subscription to:
Basic Charting
for 1 month
This subscription will expire on Apr 12, 2012.
Click here if you have a coupon code.
Thanks ChipA god bless and always the best of trading.
The credit goes to you Quasi. The new chart looks very good in the DDCC iBox now. Your help is much appreciated.
re ProfitScout,
Just checked and the chart looks good and is updating as it should. Good work, you can also move that code to somewhere else in the IBox if you wanted to.
Quasi
Let us know if it doesn't update or if you have any other problems.
cheers Quasi
I just gave you credit on the DDCC board too. Thanks again.
Yes I see you got it, glad I could help.
Quasi
Quasi, that did the trick. My thanks to you for delivering a real solution to the problem that worked.
OK here's a shortcut to the code that should work for you, just remove the ? in front of the first [?img] I had to put it there so you could see the code, if it wasn't there you would just see the chart.
[?img]stockcharts.com/c-sc/sc?s=ddcc&p=d&b=5&g=0&id=p55819912615[/img]
Just copy and paste this into your IBOX, in the location where you want it.
Quasi
Quasi, I am just looking for a simple, daily self-updating chart on DDCC to put in the iBox of the board. Here is a url that I have been trying to use: http://stockcharts.com/c-sc/sc?s=DDCC&p=D&b=5&g=0&i=p55819912615&r=9858
I have tried posting this directly and with the chart bracket code commands but it still will not show up as a chart in the iBox. I have also tried to follow the instructions in your post but still no luck. All I want it the exact text to post in the iBox to make the chart appear. If you can provide that to me I would very much appreciate it. Thanks.
re ProfitScout, can you post a link to the chart you want for DDCC and I'll tell you the URL you need to insert.
Quasi
Quasi, I did see your Sticky post with instructions and also got other instructions on another board. So far, nothing I do gets the chart to appear in the DDCC iBox even though I am trying to follow all instructions given. This is why I asked for the very specific help in my last post. If you or anyone can specifically address the three simple points I asked about that should give me the information needed in the most simple and straightforward way.
Thank you.
---------------------------------------------------------------
ProfitScout Saturday, February 18, 2012 7:12:34 PM
Re: None Post # of 6894
I would appreciate the help of anyone here. I am trying to get a stock chart posted to the DDCC iBox which will update itself daily. So far I have had no luck getting one to appear or getting anyone to give me the exact steps I need to follow. I would really appreciate it if anyone here could give me the very specific help I need as posted below. Thanks.
Information Needed:
1. Find a specific source url for a technical stock chart which will automatically update itself every day. I do see these self-updating charts on many iHub boards. So far it looks like http://www.stockcharts.com is the site to use for a source.
2. Tell me exactly what I need to capture (and/or delete) from the chart url once it is called up.
3. Tell me exactly how to present the needed url in the iBox area of the DDCC board to get the chart to show up and self-update every day. This includes what brackes and commands are needed around the url.
If someone here can just give me the information needed above that is what I am seeking.
Re ProfitScout, there is a sticky post at the top of this fourm, Chart and Link posting 101. or use the link below to get to it.
http://investorshub.advfn.com/boards/read_msg.aspx?message_id=48603233
This should give you all the info you need to get the job done, note towards the end there are specific examples of how to put a chart in the IBox.
Quasi
I would appreciate the help of anyone here. I am trying to get a stock chart posted to the DDCC iBox which will update itself daily. So far I have had no luck getting one to appear or getting anyone to give me the exact steps I need to follow. I would really appreciate it if anyone here could give me the very specific help I need as posted below. Thanks.
Information Needed:
1. Find a specific source url for a technical stock chart which will automatically update itself every day. I do see these self-updating charts on many iHub boards. So far it looks like http://www.stockcharts.com is the site to use for a source.
2. Tell me exactly what I need to capture (and/or delete) from the chart url once it is called up.
3. Tell me exactly how to present the needed url in the iBox area of the DDCC board to get the chart to show up and self-update every day. This includes what brackes and commands are needed around the url.
If someone here can just give me the information needed above that is what I am seeking.
Not sure what problem you are having, seems to be working OK for me. Last post with chart is still the same, hasn't changed.
Haven't seen or heard of that one before?
Are you hitting the "linkable version" button under the chart before grabbing the URL, because your URL is different than what I normally see.
Here's the URL with your chart.
http://stockcharts.com/h-sc/ui?s=NEP&p=D&b=5&g=0&i=t00754384028&r=527
I changed the SMA's to 20, 40, and added pivot points to the chart. Link and image should be below, lets see if they change over time.
http://stockcharts.com/h-sc/ui?s=NEP&p=D&b=5&g=0&id=p31869931623
Quasi
Linking to a chart with user defined criteria doesn't show the modifications. The chart defaults to 50 and 200 sma regardless of what you defined in the chart you linked to..didn't use to be this way until recently..strange! For example, I put pivot points in on this chart @ stockcharts, but when I post the image link they show up at first, but revisit the chart later and it has defaulted.
Testing. A user said this no longer works:
and yet it seems to...
Hey Quasi,
Good post. The Advanced Scan Library is a great addition at StockCharts. Great place for someone to start if they are interested in building scans. How many times over the years have we (you mostly) been asked for advice on how to build scans?
The site just continues to grow. So many good things have been added over the years. If someone is wondering where to start, I would recommend attending ChartCon 2012 coming this summer. Last year's event opened my eyes and reminded me of some of the great features that have come along since I joined. It's well worth attending if there is still room to register.
Cush
New StockCharts, Advanced Scan Library..
Not everyone reads the StockCharts home page or members page, "Whats New Section", but you should.
Chip released the first edition of a new "ChartSchool" training section, the "Advanced Scan Library", take a look at it, lots of interesting examples. A great place to review after you have read the "Advanced Scan Workbench - User Documentation".
http://stockcharts.com/school/doku.php?id=chart_school:scan_library
http://support.stockcharts.com/forums/30077/entries/21297
Another post from the early days of scan S.C.A.N. "Advanced Scan Coding Examples", contains a few more examples, (maybe some will get added into the ChartSchool pages).
http://scan.stockcharts.com/questions/5/examples-of-advanced-scan-coding-and-help-information
http://blogs.stockcharts.com/scanning/2011/08/scan-coding-sample-blocks.html
I know Chip would be very interested in your comments, pro/con, please let him know thru the comments link on the article on the home page.
Anyone have some other code or recommendations they would like to add ?? There are no right or wrong answers, everything is right or wrong for somebody at some particular time.....
Things are always getting better around here.
Cheers Quasi
You thinking maybe dividend related, aye? Interesting.
Will do as suggested and pass inquiry on directly to Stockcharts.com
Thank you for your time Quasi. Have a great weekend!
Scov.
If you suspect there has been an error in the adjustment for the historic data prior to the dividend, I would suggest you send a note to StockCharts support. Include all the details so they can quickly see the problem and it should be resolved quickly.
http://stockcharts.com/support/techsupport.html
Quasi
Question re possible charting technical flaw for GAME?
The Mod on that GAME board brought up what looked to me to be a good question, #msg-71368378, regarding StockChart.com depiction of the daily PPS activity leading up to and following Friday Jan 20?
Other charts and historical data are reflecting an intra day high of $4.85 on Jan 20 followed by a down gap of about $1.00 next trade day Monday Jan 23.
Hope you've had a good week and thanks in advance for your time to review.
A couple more random charting sites for comparison convenience…….
http://www.stockta.com/cgi-bin/analysis.pl?symb=GAME&cobrand=&mode=stock
http://www.stockfetcher.com/stockdb/fetcher?p=mysym&sym=GAME&sub=&wait=1&taskid=2404393&qrid=1327675414
http://clearstation.etrade.com/cgi-bin/details?Symbol=game&Refer=http://clearstation.etrade.com/
yes . . it is easy to post charts . . .
just enter the URL address to the chart
select the URL text in your post box
and click on IMAGE to the side of the post box.
I'm using photobucket for posting my charts. Can I do the same thing here.....or not? I use stockcharts/big charts for free. Why pay when I don't need the other stuff they offer. I like stockcharts the best because they have P&F counts. I don't have the time right now to try to learn how to post charts and this wk-end I'm running a junior tennis tournament at my club.....so it may be awhile before I post any charts. The good news is....I think we're heading above Dow 13,000 very soon. Good trading.
The Slammer
Thanks for posting back Peter_Pan,
Yes Ekwongs brute force solution, you linked to, seems to be the best solution at this time. Note you could also change the "close - open" functions to "High - Low" if you wanted to include the tails rather than just the candle bodies.
I was trying to develop a short form scan using the AbsVal and Max over time functions, no syntax errors, but couldn't get the correct results. Something strange about the AbsVal mixed with math functions.
Glad you found something that will work and Yes I'm surprised more people are not using the S.C.A.N. forum. It is pretty well the go to place for users helping users, with lots of ideas and expertise.
Quasi
Well, I guess this forum is kind of inactive.
After I wrote my question here, I found (through Quasi) the S.C.A.N. forum, and most answers are right there, and I got my answer here:
http://scan.stockcharts.com/questions/3778/how-to-scan-for-tallest-candlestick
I would suggest the reader to go take a look at the scan stockchart forum. It's aimed precisely for those who need answers to their scan.
Scanning for longest candlestick.
I'm trying to scan for this:
1) Today's candle (open-close) is the longest since 10 days ago.
2) And today's close is highest since 10 days ago.
I know how to scan for the second one, I'm still searching for 1.
Any ideas? And thanks for your help.
If it works, here is what I am looking for (last candlestick.)
http://www.tiikoni.com/tis/view/?id=22f6213
thanks Quasi and the thing that was tripping me up was ~
how to word the scan for current price ~
and now I see that the 'close' paramenter works for the current price while scanning intraday.
thank you 
RE: Alive, PM scan question..
Q: know how to write a scan for stocks trading at the high of day?
Well you can scan for daily values during the trading day using the "last intra-day update" setting on the scan interface page.
So the OHLC values are just the current values at the time of day that you run the scan, they won't be the official OHLC values until the trading day is closed. The open won't change but the HLC probably will by the end of the day.
However you could scan for the current price, which at the time is the current closing price and compare that to the current value for the high today. If the two are equal then you are at the high of the day, however as these values will probably only be equal for a second I would recommend scanning for the current close which is within say 99.9% of the high.
[type = stock]
and [country is US]
and [group is SP500]
and [close > high * 0.999 ]
play with the numbers as necessary
Quasi
ChartCon 2012 - The Second Annual StockCharts User's Conference
There is an announcement in the ChartWatchers Newsletter.
http://stockchartscom.createsend4.com/t/ViewEmail/r/79FEAE250D044A06#chipanderson
And more info here
http://stockcharts.com/sales/events/chartcon2012/
Last year's event was excellent. Very informative.
Cush
Scan backtesting days ago....
Yes when running scans, using the starting date as days ago, this is trading days ago rather than calender days ago. Also note that this is trading days ago based on US trading days.
Not all continents have the same holidays so StockCharts had to pick one as a reference, USA, so you may have to adjust the days ago if you are looking for scans of Canadian or European stocks. In most cases this is not an issue but for a few particular holidays it will require an adjustment, ie we don't have universal holidays.
Cheers
Quasi
Response to PM question on weekly indicator of overlay scan...
I assume the question was in regards to scanning for overlays of indicators, as described in this article on StockCharts.
http://blogs.stockcharts.com/scanning/2011/08/question-is-it-possible-to-use-an-ema-of-an-indicator-in-a-scan-for-example-if-i-wanted-to-know-when-rsi5-is-above-a.html
The example coding was as follows, note the tight price bracket was used just to pick up a particular stock which I knew met the criteria.
[type = stock] and [country = us]
and [Close >=48] and [Close <=49]
and [RSI(7) X EMA(14,RSI(7))]
To do the same thing on a weekly basis just add the weekly parameter infront of each section, as follows.
[type = stock] and [country = us]
and [weekly Close >=48] and [weekly Close <=49]
and [weekly RSI(7) X weekly EMA(14,weekly RSI(7))]
hope this helps
Quasi
DarkLady - Customer Service
DarkLady,
I have been a member of StockCharts for seven years. I really like the charts and the capability that is provided, as you said you do. There are some problems, but I work around them.
I also greatly appreciate and respect the help that Quasi provides to SC users, but I have to disagree with him regarding what I call StockCharts "Customer Disservice".
Your observation regarding customer service is their standard mode of operation based on my experiences with them. If you care to read about some of them, I did a couple of posts on it in May, 2009. You can also read posts #6172 and #6185 to hear about others' experiences. Apparently it hasn't gotten better since then and probably won't until a better value is available somewhere else. And that happens to all complacent businesses sooner or later.
The only help you're likely to find is at this forum and at S.C.A.N. as Quasi mentioned.
Best regards,
Casey
I haven't heard anything like this at all. Are you submitting a request or question thru the Support input page.
http://stockcharts.com/support/techsupport.html
Have you tried the new users support forum, S.C.A.N, just like IHUB there are even more knowledgeable users who can often help point you to a solution, or explain why it's not possible.
http://scan.stockcharts.com/questions/
Last try posting your problem here and we'll see if one of us can find a solution.
Cheers Quasi
Hi guys,
Don't misunderstand me, I love StockCharts and believe every serious trader should be on board. However I am having a serious problem. I have sent at least ten Emails to them over the last six months and they have not answered a single one. Is anyone else having a problem with that? Have they been told to ignore members? It is very discouraging to me. I have them set up as a favorite with full access.
Take Care.
Darklady
Kajulie, no problem always glad to help.
You should also consider having a look at and joining the new users help forum hosted on the StockCharts servers. It is becoming the new source for users helping users on the tips and tricks of Stockcharts.
Ask a question or help out with an answer, the database is building quickly, there is a great bunch of users willing to share tips and lots of great questions and answers.
http://scan.stockcharts.com/
cheers Quasi
*** Important: Per the StockCharts TOS, IHUB users are allowed to post a MAXIMUM of 4 live embedded charts in a post or IBOX. ****
(this is a Privelge NOT a Right that IHUB users enjoy, please don't let a few abusers cause the loss of this feature for everyone)
This is a public area for StockCharts.com users to share information on the best ways to use the site. This board is not officially supported by StockCharts.com. The official StockCharts.com support page is http://stockcharts.com/support/techsupport.html
StockCharts.com Frequently Asked Questions (FAQ's)
http://stockcharts.com/FAQ.html
If the home page is offline, use the following URL links for access to sections which are on alternate servers.
Status Blog located on the Typepad servers at SixApart.
http://stockcharts.typepad.com/status/
Support Desk located on the servers at Zendesk
http://support.stockcharts.com/portal
Uptime reports on the servers at Pingdom
http://www.pingdom.com/reports/g0fdmqv6vgnb/
Instructions for embedding a live StockCharts chart in your post. Note this method should only be used where a live chart is needed, in most cases a static snapshop is better as it will still jive with your comments when someone reads it several days or weeks from now.
http://blogs.stockcharts.com/step_by_step/2012/05/adding-a-live-sharpcharts-to-an-investorshub-post.html
Chart and Link Posting 101 see #msg-74409478
, includes screen shots for all the steps along with some tricks and tips.
| Volume | |
| Day Range: | |
| Bid Price | |
| Ask Price | |
| Last Trade Time: |


