 News
News  Market Data
  Discover
Support: 888-992-3836
Copyright © 2023 InvestorsHub Inc.


Register for free to join our community of investors and share your ideas. You will also get access to streaming quotes, interactive charts, trades, portfolio, live options flow and more tools.
SGAS: cash merger. Shareholders receive $1.30 per share. FINRA deleted symbol:
http://otce.finra.org/DailyList
10K out with great figures, book value moved higher...
http://www.sec.gov/Archives/edgar/data/1326364/000114420414022304/v371237_10k.htm
I am no longer in this stock but I bought it cheap and it made me money. I should have hung in for the buyout but hey I did ok on it and im happy. I think its a real company not a scam
Yes!!! US$1.30 per share
http://ih.advfn.com/p.php?pid=nmona&article=61704252
Guess I'm calling "BS"
Artificial .50 cent cap on this thing.
Manufactured "blood in the streets" that non-binding JPM Private Equity offer.
Who would buy or hold when the pps is capped at .50?
In at .50
I gather this ain't got a chance in heck.
Sino Gas International Holdings, Inc. Announces Receipt of Renewed "Going Private" Proposal at $0.50 Per Share
http://www.benzinga.com/pressreleases/13/12/n4138972/sino-gas-international-holdings-inc-announces-receipt-of-renewed-going-#ixzz2myslmtk4
Sino Gas International Holdings, Inc. Announces Second Quarter and First Half of 2011 Earnings Conference
| 12:30 AM | By PR Newswire Association LLC. |
BEIJING, Aug. 15, 2011 /PRNewswire-Asia-FirstCall/ -- Sino Gas International Holdings, Inc. (OTC Bulletin Board: SGAS), ("Sino Gas" or the "Company") today announced that it will conduct a conference call at 8:00 a.m. Eastern Time on Tuesday, August 16, 2011 to discuss second quarter and...
Related News: Similar Content, By PR Newswire Association LLC. http://www.prnewswire.com/news-releases/sino-gas-international-holdings-inc-announces-second-quarter-and-first-half-of-2011-earnings-conference-127717423.html#rssowlmlink
Share Structure
Market Value1 $9,504,816 a/o Aug 12, 2011
Shares Outstanding 27,156,617 a/o Mar 28, 2011
http://www.sino-gas.com/

[img][/img]
[img][/img]
RedChip Virtual Conference! Sino Gas Int'l Holdings (SGAS) will be presenting in the RedChip virtual conference on February 16, 2011. CFO Yugang Zhang will be representing SGAS and earnings will be released. Here is a quick link to get signed for the Virtual Conference.
www.redchip.com/visibility/conferencePages/virtualconferences/virtualmainConference.asp
Do Not Miss Out!
FWIW
Form 4 Sino Gas International For: Oct 11 Filed by: JAYHAWK CAPITAL MANAGEMENT, L.L.C. 10/13 06:04 PM
xml.10kwizard.com/filing_raw.php?repo=tenk&ipage=7190768
Filed on: October 13, 2010
Well they closed the gap today...That's for sure.
I been following for about 4 months now. Everything I see looks good here. Expecting to see a volume increase over the next two weeks. I see the gap below, but it seems to be having a tough time getting to
that level. I'm looking to buy some on any dip below .44, but right now I'm holding on to what I have. I would like to average down some, but I'm ok with my holding and I feel this is a good investment. GLTY
"China's NG consumption jumps 22.1% in past 6 months compared to the same time last year" the Global Times reports.
Natural Gas to be cornerstone of green energy supply
Sino Gas International Holdings SGAS has exclusive concession rights in 35 secondary and tertiary cities with 30 year concessionary rights agreements with local governments. SGAS currently services approx 152,000 residential customers and seven industrial customers. They have the rights to approx. 1.4 Million residential households.
Free SGAS Company Profile
I can name a ton of companies. Go check out the China board.
Their 10-K looks excellent!
Seekingalpha-article last year was right, this thing is as solid as a rock and keeps on rocking :)
I'm keeping this baby for the long haul!
Together with ALIF somebody had yet to show me 2 better OTC stocks then these two, but if you have other suggestions as well feel free to post ;)
Can't wait for SGAS and ALIF to uplist and show us the money!!!!!
Team,
I am removing myself as moderator today. This is not because I have lost faith in this being a good company. It has made me money, but I reallocated these funds into a new holding. Good luck to all!
tburr,
Last year they filed their 10-K on 3/24/09, so we should see it within the next 7-10 days, IMO!
Corvis,
I agree with your comments. We are very close to this stock hitting the radar screen for a number of reasons. My money has been in this one since .70, and I see no reason to change it...looking for better days ahead!
IMHO..it will be the "dog and pony" show at "R&R" on March7-9 that might/will put SGAS.ob on the radar of potential investors.
Thus I think that scalping a few shares at the present 0.80 level could possibly make a savvy investor a "quick buck" (20%) by the time the company presents its story to the "big boyz" next month.
If you follow T/A,the chart is just touching the 50ma at 0.79 (support) and the MACD looks like it's about to "round the corner" and start heading north.
Let's see what the share price is by the time the R&R starts and whether or not an investor could have turned $10,000 @0.80 into $11,600(20% or 0.96)!And a GIC pays how much per year??
Although SGAS.ob is a "specky" the T/A, fundamentals and upcoming Investors conference & quarterly #'s appear to point to a higher share price in the not too distant future.
I'm putting my $$ on it!
SGAS'ers,
The iBox had an article in it from 2007. Seems we need to tout this stock as a good value growth stock. I have asked to be moderator, not because I think I will be great at it, or even good for that matter, but I will update information for possible new investors who visit. Please feel free to make suggestions.
Check it out and let me know what you think!
I agree with you. A lot of retail common investors seem to be thinking the same thing.
SGAS is basing at 0.80 (due to recent market pull-back and"selling the news re:growth financing") but should start to rise in value as we get closer to both the quarterly report(best seasonal "Q") and their presentation at the "R&R".
"IF" the EPS is correct,it will only be a matter of time before this stock is noticed and a fair value attached to the pps.
It wouldn't surprise me if a company like CHNG is keeping a close eye on SGAS.ob and would be ready to "pounce" to gain extra infrustructure and "clients" that would instantly be accretive to its earnings.
Time will tell.
SGAS chart
Last 10Q
http://www.sec.gov/Archives/edgar/data/1326364/000114420409058627/v165857_10q.htm
More filings
http://eresearch.fidelity.com/eresearch/evaluate/fundamentals/secFilings.jhtml?stockspage=secFilings&symbols=SGAS
Institutional ownership
http://finance.aol.com/company/sino-gas-intl-hldgs-inc/sgas/nab/institutional-ownership
Geo alerts
http://geoinvesting.com/companies/sgas_sino_gas_intl/alerts
Rames peer group list
http://spreadsheets.google.com/pub?key=tyCt3DfoEPUY92ce9hrl6tA&output=html
FTD chart, type in SGAS and look at raw data
http://failstodeliver.com/default.aspx
I'm not really sure if this affects China pricing or not, but we do know there is a shortage in China of natural gas. For what's it's worth,
7:44AM Natural gas surging this morning and has recently traded to tis best levels at $5.283; now up 14.2 cents to $5.28 (COMDX) :
I see that CHNG (almost the exact same company at SGAS) will also be at the "R&R" Annual Investment Conference Mar.7-9/10.....looks like Natural Gas in China is going to get a wee bit more exposure to the Investment community....
I also read that the present CEO was the "R&D" guy at Petro China in which SGAS still has ties with....interesting.
Clean/"green" energy...think of where North America is with natural gas and then think how big the potential in China is and I'll let YOU put one and one together!
Locked and loaded....speaking of which,time to get loaded on a "couple" of "wobbly pops"!
I just stumbled across SGAS here. How do you feel about this one, trying to so some DD on it.
This baby is about to "pop".....with a "dragon fly" candle yesterday and volume really building up today...let's see how good my "T/A" is and I'm not talking t*t's and a$$ because I know I'm am expert in that department already!
:()
Corvis,
You're right, welcome to the hub. As more exposure is given to this compan, investors will realize the opportunity!
Have you guys noticed that SGAS.ob will be presenting at the "Rodman&Renshaw ACIC" March7-9/2010.
That might garner a little more attention to this company as there are a few other "big" companies also going to be there(ie:FEED,RINO).Other companies that have been tied to "R&R" have been known to up-lift to bigger/New York exchanges.
With their recent financing and growth stategy the pieces of the puzzle appear to be starting to fall into place for SGAS for 2010!We can only hope!
Sorry, none I know of, might wanna check stockhouse.com, they may have something of interest for you.
Anyone recommend a few junior NG producer / explorer company?
tia
natural gas sounds like a great investment. this
one seems to be moving up with volume.
someone on the yahoo board thinks they'll acquire
a state owned Gas company with the cash.
http://messages.finance.yahoo.com/Stocks_%28A_to_Z%29/Stocks_S/threadview?m=tm&bn=44700&tid=319&mid=360&tof=1&rt=2&frt=2&off=1
http://seekingalpha.com/instablog/487383-charles-hicks/27849-sino-gas-international-holdings-otc-sgas-a-compelling-value
roscoe,
Yes, I do hold SGAS. I got in on 12/17, and am currently up about 25%. I keep a spreadsheet on all my holdings with pertinent info and 1 year price target. I checked and my target is $3.50 end of year, but due your own DD, this is simply my best estimate. I hope this helps, but as I said, JMO!
Harley Are you holding this one? I bought it on a whim, now that I'm up 13% I'm wondering where it's heading. I would have asked the ECSC guys but they have the no more deadbeats rule.
Sino Gas International Holdings Completes Growth Funding Plan
Capital Raised in Overseas Market and Bank Loan Commitments in China will Stimulate Future Growth
Companies:Sino Gas Intl Hldgs Related Quotes
Symbol Price Change
SGAS.OB 0.76 0.00
Press Release Source: Sino Gas International Holdings, Inc. On Thursday January 7, 2010, 6:00 am EST
BEIJING, Jan. 7 /PRNewswire-Asia-FirstCall/ -- Sino Gas International Holdings, Inc. (OTC Bulletin Board: SGAS), today announced that it has taken several actions to ensure that the Company has sufficient capital for both the speed-up of the build-out of its existing connection systems and for other growth opportunities in the natural gas industry.
The Company completed a $6.04 million (U.S.) private equity placement with several accredited investors on November 30th, 2009 and on December 23rd, 2009. The placement was arranged by Axiom Capital Management, based in New York City. Terms of the placement are more fully disclosed in Form 8-K filings that the Company made on December 4, 2009 and December 30, 2009.
This $6.04 million, together with bank loans recently secured, will provide the Company with approximately $14.5 million of available capital over the near term. Included in this new $14.5 million capital infusion are approximately $4.37 million of loan approvals from the Bank of Communications, one of the five largest commercial banks in China, and another approximately $4.37 million of loan approvals from the China Development Bank, a major infrastructure lender to the energy sector in China.
As Mr. Yu-Chuan Liu, Chairman and Chief Executive Officer of Sino Gas, stated, "We are proactively taking advantage of the capital markets in China and the U.S., in order to better enable us to take advantage of the growth opportunities that exist in China in the natural gas arena. We are glad that two world-class banks like the Bank of Communication and the China Development Bank have recognized our great potential through their loan commitments."
Mr. Yugang Zhang, Chief Financial Officer of Sino Gas, added, "We will continue to bring natural gas access to more and more residents and industrial users in our markets and increase the penetration rate in the existing markets. The continued emphasis of the Central Government regarding the use of clean energy by the construction sector together with the positive growth trends in new construction in China should continue to stimulate growth in our industry. The addition of these capital sources should allow Sino Gas to be better able to take advantage of these opportunities."
About Sino Gas International Holdings, Inc.
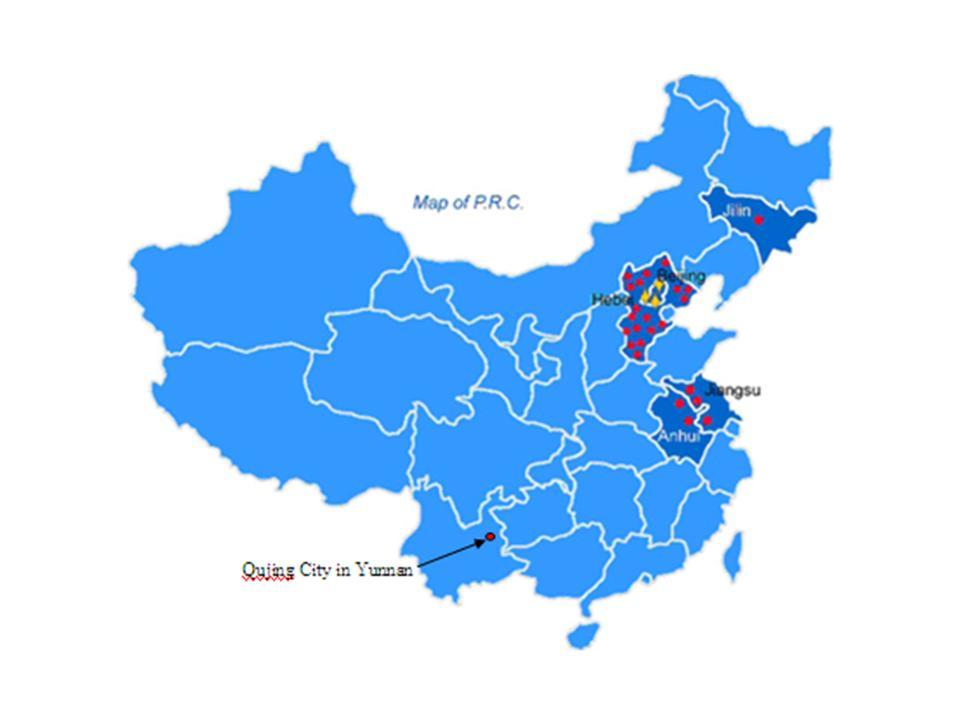
The Company, through its indirectly wholly-owned subsidiary, Beijing Zhong Ran Wei Ye Gas Co., Ltd. ("Beijing Gas"), and the subsidiaries of Beijing Gas, is a leading developer of natural gas distribution systems in small and medium size cities in China, as well as a distributor of natural gas to residential, commercial and industrial customers in China. The company owns and operates 37 natural gas distribution systems serving approximately 100,900 residential and five commercial and industrial customers. Facilities include approximately 710 kilometers of pipeline and delivery networks with a daily capacity of approximately 89,000 cubic meters of natural gas. The Company owns and operates natural gas distribution systems in Beijing, Hebei, Jilin, Jiangsu, Anhui and Yunnan Provinces. The Company's website is: http://www.sino-gas.com .
aml,
As a small investor living in the Netherlands I'm not that familiar with all the different statements like the 8K or 10K required in the US and everything they entail.
I try to check the financial statements of companies and if I look at the last quarterly report I mainly try to look at assets and liabilities and number of outstanding shares to determine book value.
The main points I see is steadily increasing assets and investments/construction and a good asset to liability ratio, them make a profit per share at present and looking at the number of shares I come to a higher book value then I'm seeing.
It just seems to look like a decent company with an easy to understand business model and my hope is they will move away from the OTC market in the future. For me it's a comfortable long term investment, time will tell where SGAS will go.
Interesting article on Natural Gas and Asia....just fyi!
Asia is going to make investors rich with this commodity1/2/2010 9:16:54 AM | Matt Badiali, DailyWealth
Becoming the ‘new’ fuel of choice around the world
Energy investors need to remember three things to make incredible returns in the coming decades:
Asia, Asia, and Asia.
Asia is going to make energy investors rich. Specifically, India and China will. And more specifically, they'll make folks rich in natural gas. I know you've heard the "billions of people need this and that resource" argument before, but hear me out...
From 1997 to 2007, China's total energy consumption rose from 38 quadrillion British Thermal Units (BTUs) to 76 quadrillion BTUs, roughly equal to 74 trillion cubic feet of natural gas. However, coal supplied 75% of that energy, while natural gas contributed a scant 2%.
Japan and South Korea already consume trillions of cubic feet of imported natural gas per year. India became a net importer in 2004. China became a net importer of natural gas in 2007, and that's not going to change. The country wants natural gas to supply about 7% of its energy needs by 2015. Even if China's energy consumption remained flat (and it won't), it would need to add five trillion cubic feet of natural gas from somewhere.
The problem is, China produced just 2.7 trillion cubic feet of gas in 2008. To add five trillion cubic feet of supply, the country must TRIPLE its production... or look elsewhere. But it'll face a lot of competition for natural gas in Asia.
In 2008, China, India, Japan, South Korea, and Taiwan imported a combined 5.5 trillion cubic feet of natural gas. China's natural gas imports are up 53% from 2008. India's natty imports are up 23%. Annual growth in global demand jumped from 7.5% in 2009 to a predicted 17% in 2010.
While coal and oil are still huge parts of the Asian energy picture, natural gas is becoming the "new" fuel of choice around the world.
(The demand for natural gas isn't just for energy. According to Indian hedge-fund manager Rahul Saraogi, a recent natural gas discovery in India will be used to manufacture fertilizer.)
ExxonMobil is the smartest oil company on the planet. It's also the best energy investment house on the planet. ExxonMobil's people know the facts on natural gas. They plan to supply that soaring demand. ExxonMobil is participating in several giant liquefied natural gas (LNG) projects in the Asian sphere, including the giant Gorgon project offshore Northwestern Australia.
The entire Gorgon complex contains about 40 trillion cubic feet of natural gas reserves. That's why China's interested. PetroChina agreed to buy 100 billion cubic feet per year from the project for 20 years. The estimated value of the deal is around $41 billion.
But natural gas isn't just a big boy's game. Asia needs so much gas that companies of all sizes are getting into the act. There are junior companies listed on the London Aim Exchange, the Toronto Venture Exchange, and the Australian Stock Exchange. Mid-cap energy companies are also poking around the region.
One thing every energy investor must understand: The age of natural gas is dawning around the world, even if it's still dormant here in the U.S.
We need to position ourselves to profit from that demand. At the very least, we should own shares of major oil companies like ExxonMobil, which is positioning itself to profit from Asia's voracious demand. But the sweet spot will be finding small companies in the right places.
At the S&A Resource Report, my plan is to find the most promising juniors – companies looking to discover energy supplies for China. With great teams working in far-away places, a few of those companies will make investors rich.
I am looking at this as a 2010 poss investment. I noticed a recent S-1A and looked at 10K '08; trying to fathom the diluted stock picture from convert PFs, warrants & options= does anyone have a number? the convert debt also (?convert @.62); would appreciate any help.
also a thought: will the government control of gas costs cap the revenue? I recall CCGY (china clean energy) a few years ago had to change their construction for a diesel production plant to include chemical productions because the government cap on diesel fuel affected their potential revenues.
thanks in advance for any help or insight.
I think it's unlikely SGAS will expand into other sectors until they've uplisted.
For 2010 it's likely to assume they will give more priority to maintaining decent expansion and organic growth in their existing model and get the company, corporate governance and management performing at a level whereby uplisting becomes the next logical step. If they then uplist in 2010 or later in 2011 is less important. They should not try to rush.
Besides for existing small shareholders I don't mind having a bit more time to progressively build up a bit more position, because if the seekingalpha article and information in the fox business interview was pretty much correct you will have to buy at much higher levels after uplisting looking at book value, but then it's still OTC so who knows how it will play out.
If you see how those SPNG investors got burned it's sad to see how some companies try to operate, but then WHI and SGAS seem to have much better potential. If a company doesn't have a predicatable, easy to understand business model you should stay away. I rather have Sinogas underpromise and overdeliver then the other way around!
uplisting per terms of the financing, as well as entry into CoalBed methane sector?
This could be a top 2010 performer that nobody knows about yet?
Anyone following this stock???
It's a good environment for Sino Gas to expand and make money, from what the CFO is saying. It's clearly a priority for the government to provide adequate housing for the growing middle class, and every new house you build will need to be connected to the grid to supply gas for cooking and heating.
A solid business model in itself, but in this instance government control would seem to be an added benefit. To be able to have a artificially low cost price, if the government deems necessary, will certain provide a bigger spread and less fluctuation when it comes to their operating margin.
It also seems pretty unusual for a CFO of an OTC listed company to be interviewed by a Business program. Perhaps somebody has more information on when they are maybe planning to uplist the company and what may happen to the number of outstanding shares between now and then?
Looking at the seekingalpha article it should have a lot of potential in the next decade, but it's difficult to determine how much position to build up when it's still OTC traded. For that you really need a timeline for uplisting to AMEX or Nasdaq, which wasn't provided in the interview.
|
Followers
|
12
|
Posters
|
|
|
Posts (Today)
|
0
|
Posts (Total)
|
83
|
|
Created
|
09/08/06
|
Type
|
Free
|
| Moderators | |||
SINO GAS 
| Profitability | ||||||||||||||||||||||||||||||
|
| |||||||||||||||||||||||||||||
| Valuation | Financial Strength | |||||||||||||||||||||||||||||
|
| |||||||||||||||||||||||||||||
| Management Effectiveness | Growth | |||||||||||||||||||||||||||||
|
| |||||||||||||||||||||||||||||
| Income Statement | Per Share Data | |||||||||||||||||||||||||||||
|
| |||||||||||||||||||||||||||||
| Company Contact | |
| Address | No.18 Zhong Guan Cun Dong St. Haidian District Beijing, BEJ 100083 |
| Telephone | (108) 260-0527 |
Form 10-Q for SINO GAS INTERNATIONAL HOLDINGS, INC.
13-Nov-2009
Quarterly Report
The following discussion of our financial condition and results of operations should be read in conjunction with our consolidated financial statements and the notes to those financial statements appearing elsewhere in this Form 10-Q. This discussion contains forward-looking statements that involve significant risks and uncertainties. As a result of many factors, such as those set forth elsewhere in this Form 10-Q, our actual results may differ materially from those anticipated in these forward-looking statements.
Economic & Industrial Trend
We generate revenue from two sources: connection fees for constructing connections to our natural gas distribution network and sales of natural gas. Our connection activities are closely related to the development of the real estate industry in our targeted cities in China, given the fact that almost all of our connection fees are from new residential apartments. Natural gas facilities in new apartments are often required by local governments, which aim to promote the use of natural gas to improve local residents' quality of life.
We have experienced growth of our connection activities since inception of our business due to the Chinese real estate boom in the past years. However, starting 2007, the Chinese government implemented a series of policies and regulations to curb inflation and the property market. These policies, together with the worldwide financial crisis in 2008, has resulted a slowdown of the real estate market in China and our business, in turn, was affected in 2008. Recently, the Chinese government has changed its policies and prioritized boosting of the economy. The Chinese government has adopted new policies to address the slowdown of the real estate market, such as reducing stamp duties and transactions fees, lowering interest rates, and loosening bank lending policies. The Chinese government has also decided to inject stimulus package to boost the overall economy, including allocation of funds for mass housing projects. We have seen signs of recovery of the real estate market in China in recent months.
There are three pillars in Chinese economy: domestic consumption (both private and public), net exports, and domestic investment. Chinese Government RMB 4 trillion stimulus package has great impacts on China's domestic production and investments in the past several months. Signs of Improvements in investments, retail sales, and industrial output data are encouraging. Retail sales are rebounding in the past three months. Massive government spending on infrastructure boost China's Fixed Asset Investment (FAI) year on year growth average over 30% in the first five months of the year. However, exports and imports, continues to decline. Export decreased 26.4% in the month of May compared with the same period of last year. The export has been negatively affected by the economic slowdown of the U.S. and European countries. In summary, China's economy is gradually improving with government support.
GDP growth rebounded to 7.9 per cent in the second quarter from 6.1per cent in the first, which represented a 10-year low. In the third quarter, China's economic growth accelerated to 8.9 per cent.
Our gas users are composed of industrial and residential users. Gas sales to residential users are much less affected by economic and industrial factors and we anticipate that such sales would maintain stable growth in the future, due to the increasing pool of our residential customers. Gas sales to industrial users are subject to the performance of the end industrial users. As we expand into more cities, we expect to add more industrial users in the coming year if capital is available.
Material Opportunities
The gas distribution market is quite fragmented in the small to medium sized cities (population less than 1,000,000). We have been in active talks with potential project targets. The size of the projects varies from small cities, like the ones we have, to medium-sized cities. For small city markets, many of them are still untapped or undeveloped. The development of these markets is generally considered our major growth components. The current worldwide financial crisis has created pricing opportunities for us to acquire projects since we may have opportunities to acquire projects at attractive prices.
Most medium-sized or large cities have already been developed by large gas distributors or are still operated by state-owned companies. Acquisition opportunities exist in state-owned companies, as the central government encourages suppliers to turn them into privately-owned companies. The expansion into these markets would have material impact on the Company, increasing the Company's assets and revenues significantly. The Company would require additional fundraising for such acquisitions.
Material Challenges
There are a vast number of small-to-medium sized cities left undeveloped by our industry, but the competition is intense, as there are many small new players in the market attracted by the profitability and growth potentials of the natural gas business. Meanwhile, from time to time, we are also facing competitions from stronger competitors, as large city markets are getting saturated and our competitors are beginning to expand into smaller cities.
We have limited opportunities in developing into first-tier cities in China, as most of them have already been taken by other large gas distributors, such as Xin'ao Gas Co. Ltd (largest in China), in the past decade.
Still, potential residential users in small and medium-sized cities need to be educated about the benefits of using natural gas. Time is required for residents to realize the benefits of natural gas. This is especially true for new markets, where there is no use of natural gas. Small cities tend to be more reluctant for use of new energy resources, such as natural gas, than large cities, and residents depend more on coal.
China's energy market is highly regulated by the government with regard to the purchase and sale price of natural gas. When an adjustment to the purchase price by the government occurs, gas distributors will correspondingly increase the sale price, subject to a public hearing and government approval. The increase of natural gas price in China is lagging behind that in the international markets, which has soared in the past year. The Chinese government has not often adjusted natural gas price, but we cannot rule out the possibilities of the increase of natural gas prices in the future. We can adjust the sale price accordingly after the increase of purchase price. However, passing the increase to end users would make natural gas more expensive, as compared to other alternative energies. Thus this increase of price will deter our business development.
Risks in Short-Term and Long-Term Periods
In each of the cities we are developing and aiming to develop, the real estate market is the major factor that impacts us. Most of our residential customers are new home buyers. If the real estate market turns downward, the demands for new homes would decrease, resulting in fewer natural gas connections, and thus negatively impacting our business.
To reduce the Company's heavy dependence on connection fees, the Company is exploring opportunities to diversify our business by expanding into related areas, such as pipeline and gas station businesses. However, we do not expect to expand into these areas in large scale in the near future.
Liquidity and Capital Resources
Natural gas distribution is a capital-intensive industry that requires large amounts of capital for the construction of pipelines and gas stations, and the purchase of transportation vehicles. The Company would be constrained by inadequate capital when developing into larger cities or engaging in merger and acquisition activities. With such situations, the Company would require additional fundraising to finance such business activities.
Three Months Ended September 30, 2009 Compared to Three Months Ended September 30, 2008
During the three months ended September 30, 2009, net revenues were $6,988,621, representing an increase of 28.46 % from the same period of last year. Gross profit for the three months ended September 30, 2009 was $2,483,551, representing an increase of 8.93% from the same period of last year. Our operating income for the three months ended September 30, 2009 was $1,538,616, representing an increase of 9.65% from the same period of 2008. Net income for the three months ended September 30, 2009 was $1,208,636, representing an increase of 15.82% from $1,043,591 for the same period of 2008.
For the 3 months ended
September 30, 2009 2008 Change US$ US$ Net Revenues 6,988,621 5,440,212 28.46 % Gross Profit 2,483,551 2,280,022 8.93 % Operating Income 1,538,616 1,403,225 9.65 % Net Income 1,208,636 1,043,592 15.82 % Gross Margin 35.54 % 41.91 % -15.21 % Net Margin 17.29 % 19.18 % |
Net Revenues
We generate revenues from two sources: connection fees for constructing connections to our natural gas distribution network, and sales of natural gas.
Total net revenues for the three months ended September 30, 2009 were $6,988,621, compared to $5,440,212 for the same period in 2008, representing an increase of 28.46%. The increase was mainly due to the increase of gas sales. During this period, we connected 7,239 new residential households to our gas distribution network, resulting in total connection fees of $3,342,309. Gas sales during the same period were $3,646,312. In comparison, we connected 6,857 new residential households to our gas distribution network for the same period in 2008, resulting in total connection fees of $3,401,014. Gas sales during the period were $2,039,198.
For the 3 months ended September 30, 2009 2008 Change (In $ million) US$ % US$ % %
Net Revenues 6.99 100 % 5.44 100 % 28.46 % Connection Fees 3.34 48 % 3.40 63 % -1.73 % Gas Sales 3.65 52 % 2.04 37 % 78.81 % |
The increases in our net revenues for the three months ended September 30, 2009 were mainly due to the increase of gas sales. With more customers added to our existing gas network distribution system, our gas sales increased accordingly.
Connection Fees
Connection fees during the three months ended September 30, 2009 were $3.34 million, representing a slightly decrease of 1.73% over the same period of 2008, accounting for 48% of the total net revenue as compared with approximately 63% of the total net revenue for the same period in 2008. The source of connection fees was mainly from the development of new residential users.
For the 3 months ended September 30, (in US$ millions) 2009 2008 Change US$ % US$ % %
Connection Fees 3.34 100 % 3.40 100 % -1.73 % Residential Users 3.339 99.91 % 3.40 100 % -1.81 Industrial Users 0.003 0.09 % 0.00 0 % |
Gas Sales
In terms of volume, we sold 10.55 million cubic meters of natural gas during the three months ended September 30, 2009, compared with 5.91 million cubic meters for the same period of 2008. In terms of monetary value, gas sales were $3.65 million during the three months ended September 30, 2009, accounting for 52% of total net revenue for the three months ended September 30, 2009, representing an increase of 78.81% over the same period of 2008. Gas sales to residential users increased 222.31% to $1.45 million for the three months ended September 30, 2009 from $0.45 million in the same period of 2008. Gas sales to industrial and commercial users increased 38.36% to $2.20 million for the three months ended September 30, 2009 from $1.59 million in the same period of 2008.
For the 3 months ended September 30, 2009 2008 Change ($ million) US$ % US$ % %
Gas Sales 3.65 100 % 2.04 100 % 78.81 % Residential Users 1.45 40 % 0.45 22 % 222.31 % Industrial and Commercial Users 2.20 60 % 1.59 78 % 38.36 % |
Overall, the increases of gas sales were primarily due to the fact that our invested projects maintained steady development, and more users were added to our gas distribution network.
As our residential customer base grows, gas sales to residential users would increase gradually.
Cost of Revenues Cost of revenues for the three months ended September 30, 2009, which includes cost of connection and cost of gas sales, was $4.51 million, representing an increase of 42.56% from $3.16 million in the same period of 2008. For the 3 months ended September 30, 2009 2008 Change ($ million) US$ % US$ % % Cost of Revenues 4.51 100 % 3.16 100 % 42.56 % Connection Cost 1.04 23 % 1.16 37 % -10.18 % Gas Cost 3.46 77 % 2.00 63 % 73.2 % |
Cost of Connection
The cost of connection decreased 10.18% to $1.04 million during the three months ended September 30, 2009 from $1.16 million for the same period in 2008.
Cost of connection includes depreciation of major pipelines, the cost of courtyard pipelines, valves, gas meters, and installation and maintenance fees.
Considering the city's overall planning and our long-term interests, the capacity of the gas pipeline network we designed to distribute gas for a city usually greatly exceeded the number of households we served at the beginning of our service, which makes the cost of connection, specifically the depreciation of pipelines and maintenance cost relatively high if the number of residential users connected is low. However, with the connection of more households to the gas pipelines, the average cost to each household will be gradually reduced.
Cost of Gas Sales
The cost of gas sales increased 73.2% to $3.46 million during the three months ended September 30, 2009 from $2.0 million for the same period in 2008.
The cost of natural gas sales includes the purchase and transportation of natural gas and depreciation of delivery equipment.
Gross Profit
During the three months ended September 30, 2009, gross profit was $2.48 million, representing an increase of approximately 8.93% from the same period of 2008. Gross profit from connection fees was $2.3 million for the three months ended September 30, 2009, accounting for 93% of total gross profit. In comparison, gross profit from connection fees was $2.24 million for the three months ended September 30, 2008, accounting for 98% of total gross profit. Gross profit from gas sales was $0.18 million for the three months ended September 30, 2009, accounting for 7% of total gross profit, compared to $0.04 million, accounting for 2% of total gross profit in the same period of 2008.
For the 3 months ended September 30, 2009 2008 Change ($ million) US$ % US$ % %
Gross Profit 2.48 100 % 2.28 100 % 8.93 % Connection 2.30 93 % 2.24 98 % 2.66 % Gas 0.18 7 % 0.04 2 % 356.62 % |
Gross margin during the three months ended September 30, 2009 was 35.54%, compared to 41.91% during the same period in 2008.
Gross margin for connection fees for the three months ended September 30, 2009, was 68.79%, compared to 65.85% in the same period of 2008.
Gross margin for sales of natural gas was 5.06% for the three months ended September 30, 2009, compared to 1.98% during the same period of 2008.
Selling and Marketing Expenses
Our selling and marketing expenses in the three months ended September 30, 2009 were $0.29 million, approximately 4.13% of our net revenues, compared with $0.23 million or 4.17 % of our net revenues in the same period of 2008.
General and Administrative Expenses and Other Expenses
General and administrative expenses were $0.66 million for the three months ended September 30, 2009, which were 0.93% higher than $0.65 million for the same period of 2008. Other expense was $23.5 thousand for the three months ended September 30, 2009, compared with other income of $58.3 thousand for the same period of 2008.
Operating Income
The operating income for the three months ended Sep.30, 2009 was $1.54 million, representing an increase of 10%, compared to the operating income of $1.4 million for the same period of 2008.
Income tax
Income tax was $0.31 million for the three months ended September 30, 2009, compared to $0.42 million for the same period of 2008.
Net Income
Net income for the three months ended September 30, 2009 was $1.21 million, representing an increase of 15.82% from $1.04 million for the same period of 2008. The improvement is mainly due to the increase of gross margin and reduction of income tax expense.
Nine Months Ended September 30, 2009 Compared to Nine Months Ended September 30, 2008
During the nine months ended September 30, 2009, our net revenues and gross profit were $19,357,933 and $5,283,466, respectively, representing an increase of 29.89% and 1.34%, respectively, from those of the same period in the previous year. Our operating income in 2009 was $2,671,882, representing an increase of 35.49% from 2008. Net income for the nine months ended September 30, 2009 was $1,975,407, representing an improvement of 201.12% from $656,031 for the same period of 2008.
For the 9 months ended September 30, 2009 2008 Change US$ US$ %
Net Revenues 19,357,933 14,903,850 29.89 % Gross Profit 5,283,466 5,213,597 1.34 % Operating Income 2,671,882 1,972,024 35.49 % Net Income 1,975,407 656,031 201.12 % Gross Margin 27.29 % 34.98 % -21.98 % Net Margin 10.2 % 4.4 % |
Net Revenues
We generate revenues from two sources: connection fees for constructing connections to our natural gas distribution network and sales of natural gas.
Total net revenues for the nine months ended September 30, 2009 were $19,357,933, compared to $14,903,850 for the same period in 2008, representing an increase of 29.89%. The increase was due to increase of both natural gas and connection fees revenue, resulting from the higher connection per unit we charged to the customer. During this period, we connected 17,452 new residential households to our gas distribution network, resulting in total connection fees of $7,494,485. Gas sales during the same period amounted to $11,863,448. In comparison, we connected 18,543 new residential households to our gas distribution network in 2008, resulting in total connection fees of $6,310,753. Gas sales during the period amounted to $8,593,097.
For the 9 months ended September 30, 2009 2008 Change (In $ million) US$ % US$ % %
Net Revenues 19.36 100 % 14.9 100 % 29.89 % Connection Fees 7.49 39 % 6.31 42 % 18.76 % Gas Sales 11.86 61 % 8.59 58 % 38.06 % |
Connection Fees Connection fees during the nine months ended September 30, 2009 were $7.49 million, representing an increase of 18.76% over the same period of 2008, accounting for 39% of the total net revenue compared with approximately 42% for the same period in 2008. With regard to the source of connection fees, almost all connection fees came from the development of new residential users. We connected 17,452 residential users during the nine months ended September 30, 2009. For the 9 months ended September 30, (in US$ millions) 2009 2008 Change US$ % US$ % % Connection Fees 7.49 100 % 6.31 100 % 18.76 % Residential Users 7.41 99 % 6.31 100 % 17.37 % Industrial Users 0.09 1 % 0.00 0 % % |
Such increase was primarily attributable to the higher average connection fees per unit compared to the same period of 2008. In the first half of 2009, we developed certain residential projects with higher connection fees per unit. The higher connection fees per unit helped to increase the total connection fees revenue.
Gas Sales
Overall, the increases of gas sales were primarily due to the fact that our invested projects maintained steady development, and more users were added to our gas distribution network. In terms of value, gas sales were $11.86 million during the nine months ended September 30, 2009, accounting for 61% of total net revenue in 2009, representing an increase of 38.06% over the year 2008. Gas sales to residential increased 129.56% from $2.07 million in 2008 to $4.76million in 2009. Gas sales to industrial and commercial users increased 9%, from $6.52 million in 2008 to $7.11 million in 2009.
For the 9 months ended September 30, 2009 2008 Change ($ million) US$ % US$ % % Gas Sales 11.86 100 % 8.59 100 % 38.06 % Residential Users 4.76 40 % 2.07 24 % 129.56 % Industrial and Commercial Users 7.10 60 % 6.52 76 % 9.00 % |
Cost of Revenues Cost of revenues for the nine months ended September 30, 2009, which includes cost of connection and cost of gas sales was $14.07 million, an increase of 45.24%, from $9.69 million in the same period of 2008. For the 9 months ended September 30, 2009 2008 Change ($ million) US$ % US$ % % Cost of Revenues 14.07 100 % 9.69 100 % 45.24 % Connection Cost 2.67 19 % 1.98 20 % 34.83 % Gas Cost 11.4 81 % 7.71 80 % 47.92 % |
Cost of Connection
The cost of connection increased 34.83% to $2.67 million during the nine months ended September 30, 2009 from $1.98 million for the same period in 2008. This increase, which outpaced the 18.76% increase in connection fees revenue during the same period, is mainly due to higher cost of raw materials, parts, and installation and maintenance fees.
Cost of connection includes depreciation of major pipelines, the cost of courtyard pipelines, valves, gas meters, and installation and maintenance fees.
Considering the city's overall planning and the long-term interests of our company, the capacity of the gas pipeline network we designed to distribute gas for a city usually greatly exceeded the number of households we served at the very beginning, which makes the cost of connection, specifically the depreciation of fixed assets and maintenance cost greatly increase. However, with connection of more households to the gas pipelines, the average cost to each household will be gradually reduced.
Cost of Gas Sales
The cost of gas sales increased 47.92% to $11.4 million during the nine months ended September 30, 2009 from the same period in 2008, when it was $7.71 million. This increase, which surpassed the 38.06% increase in sales of natural gas during the same period, is largely due to the increase of rental expenses on gas delivery equipments and higher fuel costs.
The cost of natural gas sales includes the purchase and transportation of natural gas and depreciation of delivery trucks.
Gross Profit Gross profit slightly increased from $5.21 million in 2008 to $5.28 million for 2009. For the 9 months ended September 30, 2009 2008 Change ($ million) US$ % US$ % % Gross Profit 5.28 100 % 5.21 100 % 1.34 % Connection 4.82 91 % 4.33 83 % 11.4 % Gas 0.46 9 % 0.89 17 % -47.84 % |
During the nine months ended September 30, 2009, gross profit was $5.28 million, a slightly increase of approximately 1.34% from the same period of 2008. Gross profit from connection fees is $4.82 million for the nine months of 2009, accounting for 91% of total gross profit. In comparison, gross profit from connection fees was $4.33 million for the nine months of 2008, accounting for 83% of total gross profit. Gross profit from gas sales was $0.46 million, accounting for 9% of total gross profit, compared to $0.89 million, 17% of total gross profit in the same period of 2008.
| Sino Gas Distribution Business Model | ||||||
| Year | Gas customers | Gas consumption (m3) | Gas price | Gas sales | Gas sales gross margin | Gas Sales Gross profit |
| 2006 | 63000 | 187 | $0.31 | $3.65 | 22.19% | $0.81 |
| 2007 | 87500 | 371 | $0.28 | $9.14 | 12.60% | $1.15 |
| 2008 | 100900 | 344 | $0.35 | $12.20 | 8.85% | $1.08 |
| 2009 | 120000 | 358 | $0.35 | $15.21 | 8.33% | $1.27 |
| 2010 | 150000 | 368 | $0.40 | $22.09 | 8.00% | $1.77 |
| 2011 | 190000 | 379 | $0.41 | $29.40 | 7.00% | $2.06 |
| 2012 | 230000 | 391 | $0.42 | $37.39 | 8.00% | $2.99 |
| 2013 | 270000 | 402 | $0.42 | $46.12 | 9.00% | $4.15 |
| 2014 | 310000 | 414 | $0.43 | $55.63 | 10.00% | $5.56 |
| 2015 | 350000 | 427 | $0.44 | $65.98 | 11.00% | $7.26 |
| 2016 | 390000 | 440 | $0.45 | $77.24 | 12.00% | $9.27 |
| 2017 | 430000 | 453 | $0.46 | $89.48 | 13.00% | $11.63 |
| 2018 | 470000 | 466 | $0.47 | $102.75 | 14.00% | $14.38 |
| 2019 | 510000 | 480 | $0.48 | $117.13 | 15.00% | $17.57 |
| 2020 | 550000 | 500 | $0.50 | $137.50 | 16.00% | $22.00 |
| Sino Gas Connections Business Model | |||||
| Year | New Connections | Price per new connection | Connection sales | Connections Gross margin percent | Connection gross profit |
| 2006 | 24500 | $294 | $7.20 | 78.53% | $5.66 |
| 2007 | 39306 | $330 | $12.97 | 75.77% | $9.83 |
| 2008 | 26770 | $347 | $9.29 | 68.71% | $6.38 |
| 2009 | 36268 | $350 | $12.69 | 60.00% | $7.62 |
| 2010 | 37000 | $350 | $12.95 | 60.00% | $7.77 |
| 2011 | 37000 | $350 | $12.95 | 60.00% | $7.77 |
| 2012 | 37000 | $350 | $12.95 | 60.00% | $7.77 |
| 2013 | 37000 | $350 | $12.95 | 60.00% | $7.77 |
| 2014 | 37000 | $350 | $12.95 | 60.00% | $7.77 |
| 2015 | 37000 | $350 | $12.95 | 60.00% | $7.77 |
| 2016 | 37000 | $350 | $12.95 | 60.00% | $7.77 |
| 2017 | 37000 | $350 | $12.95 | 60.00% | $7.77 |
| 2018 | 37000 | $350 | $12.95 | 60.00% | $7.77 |
| 2019 | 37000 | $350 | $12.95 | 60.00% | $7.77 |
| 2020 | 37000 | $350 | $12.95 | 60.00% | $7.77 |
| Sino Gas Earnings Forecast | ||||||
| Year | Total sales | Sales and Admin as a percent to sales | Total gross profit | Sales and admin expense | Net income | Discounted earnings using 20% rate |
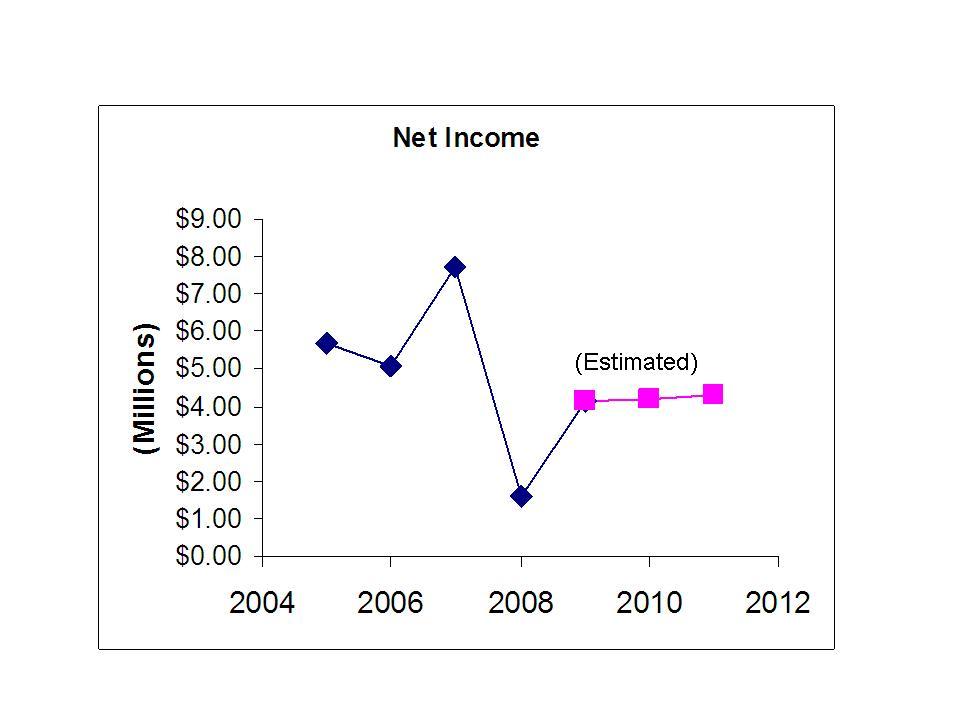
| 2006 | $10.85 | 12.87% | $6.47 | $1.40 | $5.07 | N/A |
| 2007 | $22.11 | 14.83% | $10.98 | $3.28 | $7.70 | N/A |
| 2008 | $21.49 | 27.28% | $7.46 | $5.86 | $1.60 | N/A |
| 2009 | $27.90 | 17.00% | $8.88 | $4.74 | $4.14 | $4.14 |
| 2010 | $35.04 | 15.25% | $9.54 | $5.34 | $4.19 | $3.49 |
| 2011 | $42.35 | 13.00% | $9.83 | $5.51 | $4.32 | $3.00 |
| 2012 | $50.34 | 12.00% | $10.76 | $6.04 | $4.72 | $2.73 |
| 2013 | $59.07 | 11.00% | $11.92 | $6.50 | $5.42 | $2.62 |
| 2014 | $68.58 | 10.00% | $13.33 | $6.86 | $6.48 | $2.60 |
| 2015 | $78.93 | 10.00% | $15.03 | $7.89 | $7.13 | $2.39 |
| 2016 | $90.19 | 9.50% | $17.04 | $8.57 | $8.47 | $2.36 |
| 2017 | $102.43 | 9.00% | $19.40 | $9.22 | $10.18 | $2.37 |
| 2018 | $115.70 | 8.50% | $22.15 | $9.83 | $12.32 | $2.39 |
| 2019 | $130.08 | 7.75% | $25.34 | $10.08 | $15.26 | $2.46 |
| 2020 | $150.45 | 7.00% | $29.77 | $10.53 | $19.24 | $2.59 |
| Dollars in millions excluding price per share | |
| Discounted earnings | $33.15 |
| book value | $58.60 |
| enterprise value | $91.75 |
| price per share (using 30M shares) | $3.06 |
| Volume | |
| Day Range: | |
| Bid Price | |
| Ask Price | |
| Last Trade Time: |


