 News
News  Market Data
  Discover
Support: 888-992-3836
Copyright © 2023 InvestorsHub Inc.


Register for free to join our community of investors and share your ideas. You will also get access to streaming quotes, interactive charts, trades, portfolio, live options flow and more tools.
So if I understand him right from that video: although NG prices have gone down quite a bit this year, they make money from a constant gov-regulated spread b/w purchase and sale prices (like LPIH?). And they should benefit from the rapid urbanization of China. Any thing else important that I missed?
Sino Gas (SGAS) CFO Yugang Zhang @ Fox Business!
http://www.foxbusiness.com/search-results/m/26237828/sino-gas-sees-395-growth-in-4-years.htm
Did anybody here what was said on conferance call the other day. I didn't get to hear
so far all i've found out is that they are filing late.
no, i dont even own this. i'm just trying to figure out if it is a legitimate claim.
ARE YOU Pumping? 7.5 mil income against 0.5 mil prior Q? Not likely unless asset sale profit
digging deeper, heard rumors of 30 cents eps. looking to confirm.
Not a bad day!
Sino Gas International Holdings, Inc. Announces Conference Call to Discuss First Quarter 2009 Financial Results
May 19, 2009 5:30:00 AM
Email Story Discuss on ZenoBank
View Additional ProfilesBEIJING, May 19 /PRNewswire-Asia-FirstCall/ -- Sino Gas International Holdings, Inc. (OTC Bulletin Board: SGAS), ("Sino Gas" or the "Company") today announced that it will conduct a conference call at 8:00 a.m. Eastern Time on Wednesday, May 20, 2009 to discuss the first quarter of 2009 financial results.
Joining Mr. Yu-chuan Liu, President and Chief Executive Officer of Sino Gas, will be Mr. Yugang Zhang, Chief Financial Officer, and Ms. Chunying Chai, IR Officer.
Prior to the conference call, the Company plans to release its first quarter 2009 financial results on Tuesday, May 19, 2009.
To participate in the live conference call, please dial the following number: 888.481.7939 or 617.847.8707 for International callers, access Code 750 725 52.
If you are unable to participate in the call at this time, a replay will be available from 9:45 a.m. May 20, 2009. To access the replay, dial 888-286-8010 or 617-801-6888 for international callers, access Code 15012245.
About Sino Gas International Holdings, Inc.
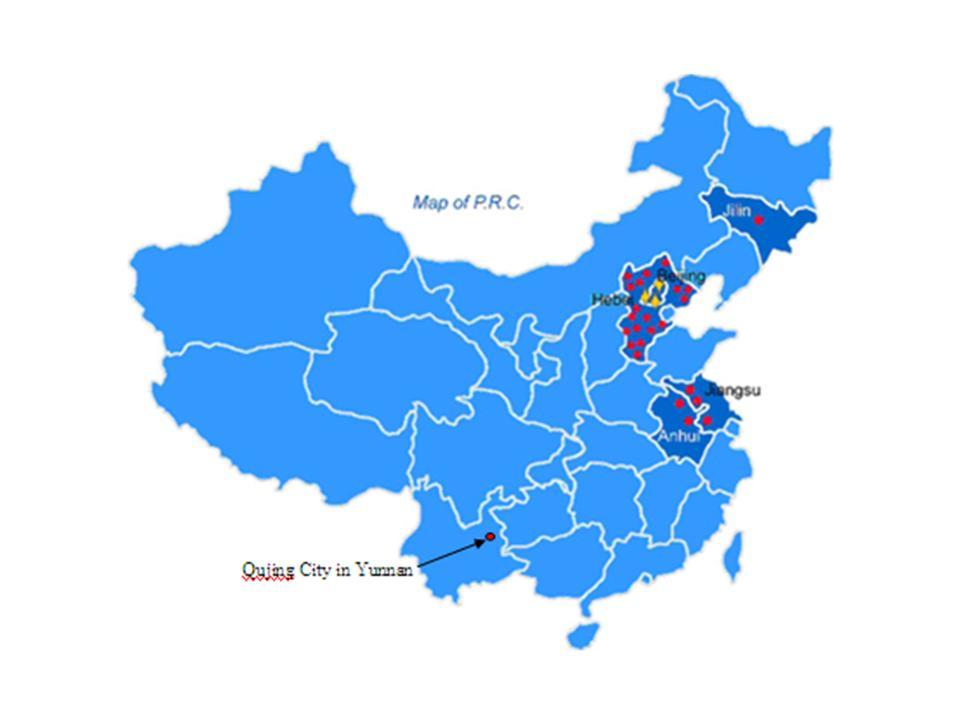
The Company, through its indirectly wholly-owned subsidiary, Beijing Zhong Ran Wei Ye Gas Co., Ltd. ("Beijing Gas"), and the subsidiaries of Beijing Gas, is a leading developer of natural gas distribution systems in small and medium size cities in China, as well as a distributor of natural gas to residential, commercial and industrial customers in China. The Company owns and operates 37 natural gas distribution systems serving approximately 100,900 residential and five commercial and industrial customers. Facilities include approximately 710 kilometers of pipeline and delivery networks with a daily capacity of approximately 89,000 cubic meters of natural gas. The Company owns and operates natural gas distribution systems in Beijing, Hebei, Jilin, Jiangsu and Anhui Provinces. The Company's website is: http://www.sino-gas.com .
For more information, please contact:
Sino Gas International Holdings, Inc.
Yugang Zhang, CFO
Tel: +86-10-8260-0041 x883
Email: zhangyugang@sino-gas.com
Investor Relations Contact:
Strategic Growth International,
Richard Cooper
Tel: +1-212-838-1444
Email: rcooper@sgi-ir.com
Web: http://www.sgi-ir.com
SOURCE Sino Gas International Holdings, Inc.
----------------------------------------------
Yugang Zhang
CFO
Sino Gas International Holdings
Inc. at +86-10-8260-0041 x883 or zhangyugang@sino-gas.com; Investor Relations Contact: Strategic Growth International
Richard Cooper at +1-212-838-1444 or rcooper@sgi-ir.com
This thing must be dead..............
Is that the John I think it is?
I just noticed no one has posted for a year! lol
Looks like there's a lot of green oil plays right now
Yeah..now if only I had some shares left.. ;)
Wow Spark! Looks like you guys had a nice day over her!

What is the deal with this thing?. Still keeps gaining, no attention though.
Thats good.. :)))
Well without that RS mentioned this baby would be having lotsa volume right now..just really nice potential..
my opinion is that it may or may not happen, and even if it does the revenue stream might be enough to carry this forward. I think that the way that r/s was expressed was indecisive at best because no date was offered. If they truly intended to go in that direction I think that they would have set a date in the 8K, so I am holding my breath here to see what will happen. My gut says it is good to go, and my gut has always been smarter than my brain. We will see.
What you think of the enormous reverse split planned?
schlitz, in my opinion very few traders bother to read the filings through, especially when they are very voluminous, as the 8K here, howevever, if anyone bothers to read it through they would quickly realize that this stock is bound to go up in price. If you just look at the pricing of the warrants, they indicate a price of between $3-$5 !!! So, I am in and will hold until the traders figure this out at some point. My opinion is that this will be a no brainer down the road. All we need to trigger it is a decent pr from the company announcing earnings, that will do it.
We will see but good luck to all holders here and everywhere.
just wondering if anyone noticed the net income from Beijing Gas on the 8k?
nice news on reverse merger:
"Beijing Gas and its subsidiaries in China are engaged in the development of natural gas distribution systems and the distribution and supply of natural gas primarily in the Hebei, Jiangsu, and Shandong provinces in China. It owns and operates 20 natural gas distribution systems serving approximately 23,000 residential and four commercial and industrial customers. Its facilities include approximately 200 kilometers of pipeline and delivery networks with a designed daily capacity of approximately 40,000 cubic meters of natural gas. Beijing Gas is constructing an additional four natural gas distribution systems and is planning two more natural gas distribution systems."
http://biz.yahoo.com/pz/060913/105154.html
Reverse split planned..too bad..
You want someone else to do ya DD?
|
Followers
|
12
|
Posters
|
|
|
Posts (Today)
|
0
|
Posts (Total)
|
83
|
|
Created
|
09/08/06
|
Type
|
Free
|
| Moderators | |||
 SINO GAS
| Profitability | ||||||||||||||||||||||||||||||
|
| |||||||||||||||||||||||||||||
| Valuation | Financial Strength | |||||||||||||||||||||||||||||
|
| |||||||||||||||||||||||||||||
| Management Effectiveness | Growth | |||||||||||||||||||||||||||||
|
| |||||||||||||||||||||||||||||
| Income Statement | Per Share Data | |||||||||||||||||||||||||||||
|
| |||||||||||||||||||||||||||||
| Company Contact | |
| Address | No.18 Zhong Guan Cun Dong St. Haidian District Beijing, BEJ 100083 |
| Telephone | (108) 260-0527 |
Form 10-Q for SINO GAS INTERNATIONAL HOLDINGS, INC.
13-Nov-2009
Quarterly Report
The following discussion of our financial condition and results of operations should be read in conjunction with our consolidated financial statements and the notes to those financial statements appearing elsewhere in this Form 10-Q. This discussion contains forward-looking statements that involve significant risks and uncertainties. As a result of many factors, such as those set forth elsewhere in this Form 10-Q, our actual results may differ materially from those anticipated in these forward-looking statements.
Economic & Industrial Trend
We generate revenue from two sources: connection fees for constructing connections to our natural gas distribution network and sales of natural gas. Our connection activities are closely related to the development of the real estate industry in our targeted cities in China, given the fact that almost all of our connection fees are from new residential apartments. Natural gas facilities in new apartments are often required by local governments, which aim to promote the use of natural gas to improve local residents' quality of life.
We have experienced growth of our connection activities since inception of our business due to the Chinese real estate boom in the past years. However, starting 2007, the Chinese government implemented a series of policies and regulations to curb inflation and the property market. These policies, together with the worldwide financial crisis in 2008, has resulted a slowdown of the real estate market in China and our business, in turn, was affected in 2008. Recently, the Chinese government has changed its policies and prioritized boosting of the economy. The Chinese government has adopted new policies to address the slowdown of the real estate market, such as reducing stamp duties and transactions fees, lowering interest rates, and loosening bank lending policies. The Chinese government has also decided to inject stimulus package to boost the overall economy, including allocation of funds for mass housing projects. We have seen signs of recovery of the real estate market in China in recent months.
There are three pillars in Chinese economy: domestic consumption (both private and public), net exports, and domestic investment. Chinese Government RMB 4 trillion stimulus package has great impacts on China's domestic production and investments in the past several months. Signs of Improvements in investments, retail sales, and industrial output data are encouraging. Retail sales are rebounding in the past three months. Massive government spending on infrastructure boost China's Fixed Asset Investment (FAI) year on year growth average over 30% in the first five months of the year. However, exports and imports, continues to decline. Export decreased 26.4% in the month of May compared with the same period of last year. The export has been negatively affected by the economic slowdown of the U.S. and European countries. In summary, China's economy is gradually improving with government support.
GDP growth rebounded to 7.9 per cent in the second quarter from 6.1per cent in the first, which represented a 10-year low. In the third quarter, China's economic growth accelerated to 8.9 per cent.
Our gas users are composed of industrial and residential users. Gas sales to residential users are much less affected by economic and industrial factors and we anticipate that such sales would maintain stable growth in the future, due to the increasing pool of our residential customers. Gas sales to industrial users are subject to the performance of the end industrial users. As we expand into more cities, we expect to add more industrial users in the coming year if capital is available.
Material Opportunities
The gas distribution market is quite fragmented in the small to medium sized cities (population less than 1,000,000). We have been in active talks with potential project targets. The size of the projects varies from small cities, like the ones we have, to medium-sized cities. For small city markets, many of them are still untapped or undeveloped. The development of these markets is generally considered our major growth components. The current worldwide financial crisis has created pricing opportunities for us to acquire projects since we may have opportunities to acquire projects at attractive prices.
Most medium-sized or large cities have already been developed by large gas distributors or are still operated by state-owned companies. Acquisition opportunities exist in state-owned companies, as the central government encourages suppliers to turn them into privately-owned companies. The expansion into these markets would have material impact on the Company, increasing the Company's assets and revenues significantly. The Company would require additional fundraising for such acquisitions.
Material Challenges
There are a vast number of small-to-medium sized cities left undeveloped by our industry, but the competition is intense, as there are many small new players in the market attracted by the profitability and growth potentials of the natural gas business. Meanwhile, from time to time, we are also facing competitions from stronger competitors, as large city markets are getting saturated and our competitors are beginning to expand into smaller cities.
We have limited opportunities in developing into first-tier cities in China, as most of them have already been taken by other large gas distributors, such as Xin'ao Gas Co. Ltd (largest in China), in the past decade.
Still, potential residential users in small and medium-sized cities need to be educated about the benefits of using natural gas. Time is required for residents to realize the benefits of natural gas. This is especially true for new markets, where there is no use of natural gas. Small cities tend to be more reluctant for use of new energy resources, such as natural gas, than large cities, and residents depend more on coal.
China's energy market is highly regulated by the government with regard to the purchase and sale price of natural gas. When an adjustment to the purchase price by the government occurs, gas distributors will correspondingly increase the sale price, subject to a public hearing and government approval. The increase of natural gas price in China is lagging behind that in the international markets, which has soared in the past year. The Chinese government has not often adjusted natural gas price, but we cannot rule out the possibilities of the increase of natural gas prices in the future. We can adjust the sale price accordingly after the increase of purchase price. However, passing the increase to end users would make natural gas more expensive, as compared to other alternative energies. Thus this increase of price will deter our business development.
Risks in Short-Term and Long-Term Periods
In each of the cities we are developing and aiming to develop, the real estate market is the major factor that impacts us. Most of our residential customers are new home buyers. If the real estate market turns downward, the demands for new homes would decrease, resulting in fewer natural gas connections, and thus negatively impacting our business.
To reduce the Company's heavy dependence on connection fees, the Company is exploring opportunities to diversify our business by expanding into related areas, such as pipeline and gas station businesses. However, we do not expect to expand into these areas in large scale in the near future.
Liquidity and Capital Resources
Natural gas distribution is a capital-intensive industry that requires large amounts of capital for the construction of pipelines and gas stations, and the purchase of transportation vehicles. The Company would be constrained by inadequate capital when developing into larger cities or engaging in merger and acquisition activities. With such situations, the Company would require additional fundraising to finance such business activities.
Three Months Ended September 30, 2009 Compared to Three Months Ended September 30, 2008
During the three months ended September 30, 2009, net revenues were $6,988,621, representing an increase of 28.46 % from the same period of last year. Gross profit for the three months ended September 30, 2009 was $2,483,551, representing an increase of 8.93% from the same period of last year. Our operating income for the three months ended September 30, 2009 was $1,538,616, representing an increase of 9.65% from the same period of 2008. Net income for the three months ended September 30, 2009 was $1,208,636, representing an increase of 15.82% from $1,043,591 for the same period of 2008.
For the 3 months ended
September 30, 2009 2008 Change US$ US$ Net Revenues 6,988,621 5,440,212 28.46 % Gross Profit 2,483,551 2,280,022 8.93 % Operating Income 1,538,616 1,403,225 9.65 % Net Income 1,208,636 1,043,592 15.82 % Gross Margin 35.54 % 41.91 % -15.21 % Net Margin 17.29 % 19.18 % |
Net Revenues
We generate revenues from two sources: connection fees for constructing connections to our natural gas distribution network, and sales of natural gas.
Total net revenues for the three months ended September 30, 2009 were $6,988,621, compared to $5,440,212 for the same period in 2008, representing an increase of 28.46%. The increase was mainly due to the increase of gas sales. During this period, we connected 7,239 new residential households to our gas distribution network, resulting in total connection fees of $3,342,309. Gas sales during the same period were $3,646,312. In comparison, we connected 6,857 new residential households to our gas distribution network for the same period in 2008, resulting in total connection fees of $3,401,014. Gas sales during the period were $2,039,198.
For the 3 months ended September 30, 2009 2008 Change (In $ million) US$ % US$ % %
Net Revenues 6.99 100 % 5.44 100 % 28.46 % Connection Fees 3.34 48 % 3.40 63 % -1.73 % Gas Sales 3.65 52 % 2.04 37 % 78.81 % |
The increases in our net revenues for the three months ended September 30, 2009 were mainly due to the increase of gas sales. With more customers added to our existing gas network distribution system, our gas sales increased accordingly.
Connection Fees
Connection fees during the three months ended September 30, 2009 were $3.34 million, representing a slightly decrease of 1.73% over the same period of 2008, accounting for 48% of the total net revenue as compared with approximately 63% of the total net revenue for the same period in 2008. The source of connection fees was mainly from the development of new residential users.
For the 3 months ended September 30, (in US$ millions) 2009 2008 Change US$ % US$ % %
Connection Fees 3.34 100 % 3.40 100 % -1.73 % Residential Users 3.339 99.91 % 3.40 100 % -1.81 Industrial Users 0.003 0.09 % 0.00 0 % |
Gas Sales
In terms of volume, we sold 10.55 million cubic meters of natural gas during the three months ended September 30, 2009, compared with 5.91 million cubic meters for the same period of 2008. In terms of monetary value, gas sales were $3.65 million during the three months ended September 30, 2009, accounting for 52% of total net revenue for the three months ended September 30, 2009, representing an increase of 78.81% over the same period of 2008. Gas sales to residential users increased 222.31% to $1.45 million for the three months ended September 30, 2009 from $0.45 million in the same period of 2008. Gas sales to industrial and commercial users increased 38.36% to $2.20 million for the three months ended September 30, 2009 from $1.59 million in the same period of 2008.
For the 3 months ended September 30, 2009 2008 Change ($ million) US$ % US$ % %
Gas Sales 3.65 100 % 2.04 100 % 78.81 % Residential Users 1.45 40 % 0.45 22 % 222.31 % Industrial and Commercial Users 2.20 60 % 1.59 78 % 38.36 % |
Overall, the increases of gas sales were primarily due to the fact that our invested projects maintained steady development, and more users were added to our gas distribution network.
As our residential customer base grows, gas sales to residential users would increase gradually.
Cost of Revenues Cost of revenues for the three months ended September 30, 2009, which includes cost of connection and cost of gas sales, was $4.51 million, representing an increase of 42.56% from $3.16 million in the same period of 2008. For the 3 months ended September 30, 2009 2008 Change ($ million) US$ % US$ % % Cost of Revenues 4.51 100 % 3.16 100 % 42.56 % Connection Cost 1.04 23 % 1.16 37 % -10.18 % Gas Cost 3.46 77 % 2.00 63 % 73.2 % |
Cost of Connection
The cost of connection decreased 10.18% to $1.04 million during the three months ended September 30, 2009 from $1.16 million for the same period in 2008.
Cost of connection includes depreciation of major pipelines, the cost of courtyard pipelines, valves, gas meters, and installation and maintenance fees.
Considering the city's overall planning and our long-term interests, the capacity of the gas pipeline network we designed to distribute gas for a city usually greatly exceeded the number of households we served at the beginning of our service, which makes the cost of connection, specifically the depreciation of pipelines and maintenance cost relatively high if the number of residential users connected is low. However, with the connection of more households to the gas pipelines, the average cost to each household will be gradually reduced.
Cost of Gas Sales
The cost of gas sales increased 73.2% to $3.46 million during the three months ended September 30, 2009 from $2.0 million for the same period in 2008.
The cost of natural gas sales includes the purchase and transportation of natural gas and depreciation of delivery equipment.
Gross Profit
During the three months ended September 30, 2009, gross profit was $2.48 million, representing an increase of approximately 8.93% from the same period of 2008. Gross profit from connection fees was $2.3 million for the three months ended September 30, 2009, accounting for 93% of total gross profit. In comparison, gross profit from connection fees was $2.24 million for the three months ended September 30, 2008, accounting for 98% of total gross profit. Gross profit from gas sales was $0.18 million for the three months ended September 30, 2009, accounting for 7% of total gross profit, compared to $0.04 million, accounting for 2% of total gross profit in the same period of 2008.
For the 3 months ended September 30, 2009 2008 Change ($ million) US$ % US$ % %
Gross Profit 2.48 100 % 2.28 100 % 8.93 % Connection 2.30 93 % 2.24 98 % 2.66 % Gas 0.18 7 % 0.04 2 % 356.62 % |
Gross margin during the three months ended September 30, 2009 was 35.54%, compared to 41.91% during the same period in 2008.
Gross margin for connection fees for the three months ended September 30, 2009, was 68.79%, compared to 65.85% in the same period of 2008.
Gross margin for sales of natural gas was 5.06% for the three months ended September 30, 2009, compared to 1.98% during the same period of 2008.
Selling and Marketing Expenses
Our selling and marketing expenses in the three months ended September 30, 2009 were $0.29 million, approximately 4.13% of our net revenues, compared with $0.23 million or 4.17 % of our net revenues in the same period of 2008.
General and Administrative Expenses and Other Expenses
General and administrative expenses were $0.66 million for the three months ended September 30, 2009, which were 0.93% higher than $0.65 million for the same period of 2008. Other expense was $23.5 thousand for the three months ended September 30, 2009, compared with other income of $58.3 thousand for the same period of 2008.
Operating Income
The operating income for the three months ended Sep.30, 2009 was $1.54 million, representing an increase of 10%, compared to the operating income of $1.4 million for the same period of 2008.
Income tax
Income tax was $0.31 million for the three months ended September 30, 2009, compared to $0.42 million for the same period of 2008.
Net Income
Net income for the three months ended September 30, 2009 was $1.21 million, representing an increase of 15.82% from $1.04 million for the same period of 2008. The improvement is mainly due to the increase of gross margin and reduction of income tax expense.
Nine Months Ended September 30, 2009 Compared to Nine Months Ended September 30, 2008
During the nine months ended September 30, 2009, our net revenues and gross profit were $19,357,933 and $5,283,466, respectively, representing an increase of 29.89% and 1.34%, respectively, from those of the same period in the previous year. Our operating income in 2009 was $2,671,882, representing an increase of 35.49% from 2008. Net income for the nine months ended September 30, 2009 was $1,975,407, representing an improvement of 201.12% from $656,031 for the same period of 2008.
For the 9 months ended September 30, 2009 2008 Change US$ US$ %
Net Revenues 19,357,933 14,903,850 29.89 % Gross Profit 5,283,466 5,213,597 1.34 % Operating Income 2,671,882 1,972,024 35.49 % Net Income 1,975,407 656,031 201.12 % Gross Margin 27.29 % 34.98 % -21.98 % Net Margin 10.2 % 4.4 % |
Net Revenues
We generate revenues from two sources: connection fees for constructing connections to our natural gas distribution network and sales of natural gas.
Total net revenues for the nine months ended September 30, 2009 were $19,357,933, compared to $14,903,850 for the same period in 2008, representing an increase of 29.89%. The increase was due to increase of both natural gas and connection fees revenue, resulting from the higher connection per unit we charged to the customer. During this period, we connected 17,452 new residential households to our gas distribution network, resulting in total connection fees of $7,494,485. Gas sales during the same period amounted to $11,863,448. In comparison, we connected 18,543 new residential households to our gas distribution network in 2008, resulting in total connection fees of $6,310,753. Gas sales during the period amounted to $8,593,097.
For the 9 months ended September 30, 2009 2008 Change (In $ million) US$ % US$ % %
Net Revenues 19.36 100 % 14.9 100 % 29.89 % Connection Fees 7.49 39 % 6.31 42 % 18.76 % Gas Sales 11.86 61 % 8.59 58 % 38.06 % |
Connection Fees Connection fees during the nine months ended September 30, 2009 were $7.49 million, representing an increase of 18.76% over the same period of 2008, accounting for 39% of the total net revenue compared with approximately 42% for the same period in 2008. With regard to the source of connection fees, almost all connection fees came from the development of new residential users. We connected 17,452 residential users during the nine months ended September 30, 2009. For the 9 months ended September 30, (in US$ millions) 2009 2008 Change US$ % US$ % % Connection Fees 7.49 100 % 6.31 100 % 18.76 % Residential Users 7.41 99 % 6.31 100 % 17.37 % Industrial Users 0.09 1 % 0.00 0 % % |
Such increase was primarily attributable to the higher average connection fees per unit compared to the same period of 2008. In the first half of 2009, we developed certain residential projects with higher connection fees per unit. The higher connection fees per unit helped to increase the total connection fees revenue.
Gas Sales
Overall, the increases of gas sales were primarily due to the fact that our invested projects maintained steady development, and more users were added to our gas distribution network. In terms of value, gas sales were $11.86 million during the nine months ended September 30, 2009, accounting for 61% of total net revenue in 2009, representing an increase of 38.06% over the year 2008. Gas sales to residential increased 129.56% from $2.07 million in 2008 to $4.76million in 2009. Gas sales to industrial and commercial users increased 9%, from $6.52 million in 2008 to $7.11 million in 2009.
For the 9 months ended September 30, 2009 2008 Change ($ million) US$ % US$ % % Gas Sales 11.86 100 % 8.59 100 % 38.06 % Residential Users 4.76 40 % 2.07 24 % 129.56 % Industrial and Commercial Users 7.10 60 % 6.52 76 % 9.00 % |
Cost of Revenues Cost of revenues for the nine months ended September 30, 2009, which includes cost of connection and cost of gas sales was $14.07 million, an increase of 45.24%, from $9.69 million in the same period of 2008. For the 9 months ended September 30, 2009 2008 Change ($ million) US$ % US$ % % Cost of Revenues 14.07 100 % 9.69 100 % 45.24 % Connection Cost 2.67 19 % 1.98 20 % 34.83 % Gas Cost 11.4 81 % 7.71 80 % 47.92 % |
Cost of Connection
The cost of connection increased 34.83% to $2.67 million during the nine months ended September 30, 2009 from $1.98 million for the same period in 2008. This increase, which outpaced the 18.76% increase in connection fees revenue during the same period, is mainly due to higher cost of raw materials, parts, and installation and maintenance fees.
Cost of connection includes depreciation of major pipelines, the cost of courtyard pipelines, valves, gas meters, and installation and maintenance fees.
Considering the city's overall planning and the long-term interests of our company, the capacity of the gas pipeline network we designed to distribute gas for a city usually greatly exceeded the number of households we served at the very beginning, which makes the cost of connection, specifically the depreciation of fixed assets and maintenance cost greatly increase. However, with connection of more households to the gas pipelines, the average cost to each household will be gradually reduced.
Cost of Gas Sales
The cost of gas sales increased 47.92% to $11.4 million during the nine months ended September 30, 2009 from the same period in 2008, when it was $7.71 million. This increase, which surpassed the 38.06% increase in sales of natural gas during the same period, is largely due to the increase of rental expenses on gas delivery equipments and higher fuel costs.
The cost of natural gas sales includes the purchase and transportation of natural gas and depreciation of delivery trucks.
Gross Profit Gross profit slightly increased from $5.21 million in 2008 to $5.28 million for 2009. For the 9 months ended September 30, 2009 2008 Change ($ million) US$ % US$ % % Gross Profit 5.28 100 % 5.21 100 % 1.34 % Connection 4.82 91 % 4.33 83 % 11.4 % Gas 0.46 9 % 0.89 17 % -47.84 % |
During the nine months ended September 30, 2009, gross profit was $5.28 million, a slightly increase of approximately 1.34% from the same period of 2008. Gross profit from connection fees is $4.82 million for the nine months of 2009, accounting for 91% of total gross profit. In comparison, gross profit from connection fees was $4.33 million for the nine months of 2008, accounting for 83% of total gross profit. Gross profit from gas sales was $0.46 million, accounting for 9% of total gross profit, compared to $0.89 million, 17% of total gross profit in the same period of 2008.
| Sino Gas Distribution Business Model | ||||||
| Year | Gas customers | Gas consumption (m3) | Gas price | Gas sales | Gas sales gross margin | Gas Sales Gross profit |
| 2006 | 63000 | 187 | $0.31 | $3.65 | 22.19% | $0.81 |
| 2007 | 87500 | 371 | $0.28 | $9.14 | 12.60% | $1.15 |
| 2008 | 100900 | 344 | $0.35 | $12.20 | 8.85% | $1.08 |
| 2009 | 120000 | 358 | $0.35 | $15.21 | 8.33% | $1.27 |
| 2010 | 150000 | 368 | $0.40 | $22.09 | 8.00% | $1.77 |
| 2011 | 190000 | 379 | $0.41 | $29.40 | 7.00% | $2.06 |
| 2012 | 230000 | 391 | $0.42 | $37.39 | 8.00% | $2.99 |
| 2013 | 270000 | 402 | $0.42 | $46.12 | 9.00% | $4.15 |
| 2014 | 310000 | 414 | $0.43 | $55.63 | 10.00% | $5.56 |
| 2015 | 350000 | 427 | $0.44 | $65.98 | 11.00% | $7.26 |
| 2016 | 390000 | 440 | $0.45 | $77.24 | 12.00% | $9.27 |
| 2017 | 430000 | 453 | $0.46 | $89.48 | 13.00% | $11.63 |
| 2018 | 470000 | 466 | $0.47 | $102.75 | 14.00% | $14.38 |
| 2019 | 510000 | 480 | $0.48 | $117.13 | 15.00% | $17.57 |
| 2020 | 550000 | 500 | $0.50 | $137.50 | 16.00% | $22.00 |
| Sino Gas Connections Business Model | |||||
| Year | New Connections | Price per new connection | Connection sales | Connections Gross margin percent | Connection gross profit |
| 2006 | 24500 | $294 | $7.20 | 78.53% | $5.66 |
| 2007 | 39306 | $330 | $12.97 | 75.77% | $9.83 |
| 2008 | 26770 | $347 | $9.29 | 68.71% | $6.38 |
| 2009 | 36268 | $350 | $12.69 | 60.00% | $7.62 |
| 2010 | 37000 | $350 | $12.95 | 60.00% | $7.77 |
| 2011 | 37000 | $350 | $12.95 | 60.00% | $7.77 |
| 2012 | 37000 | $350 | $12.95 | 60.00% | $7.77 |
| 2013 | 37000 | $350 | $12.95 | 60.00% | $7.77 |
| 2014 | 37000 | $350 | $12.95 | 60.00% | $7.77 |
| 2015 | 37000 | $350 | $12.95 | 60.00% | $7.77 |
| 2016 | 37000 | $350 | $12.95 | 60.00% | $7.77 |
| 2017 | 37000 | $350 | $12.95 | 60.00% | $7.77 |
| 2018 | 37000 | $350 | $12.95 | 60.00% | $7.77 |
| 2019 | 37000 | $350 | $12.95 | 60.00% | $7.77 |
| 2020 | 37000 | $350 | $12.95 | 60.00% | $7.77 |
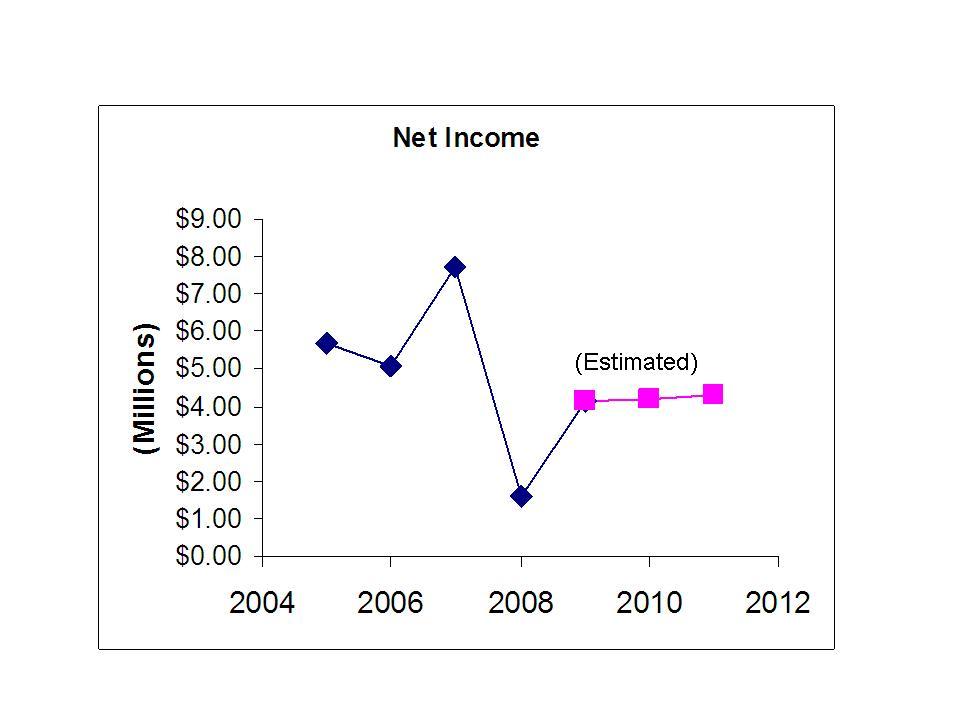
| Sino Gas Earnings Forecast | ||||||
| Year | Total sales | Sales and Admin as a percent to sales | Total gross profit | Sales and admin expense | Net income | Discounted earnings using 20% rate |
| 2006 | $10.85 | 12.87% | $6.47 | $1.40 | $5.07 | N/A |
| 2007 | $22.11 | 14.83% | $10.98 | $3.28 | $7.70 | N/A |
| 2008 | $21.49 | 27.28% | $7.46 | $5.86 | $1.60 | N/A |
| 2009 | $27.90 | 17.00% | $8.88 | $4.74 | $4.14 | $4.14 |
| 2010 | $35.04 | 15.25% | $9.54 | $5.34 | $4.19 | $3.49 |
| 2011 | $42.35 | 13.00% | $9.83 | $5.51 | $4.32 | $3.00 |
| 2012 | $50.34 | 12.00% | $10.76 | $6.04 | $4.72 | $2.73 |
| 2013 | $59.07 | 11.00% | $11.92 | $6.50 | $5.42 | $2.62 |
| 2014 | $68.58 | 10.00% | $13.33 | $6.86 | $6.48 | $2.60 |
| 2015 | $78.93 | 10.00% | $15.03 | $7.89 | $7.13 | $2.39 |
| 2016 | $90.19 | 9.50% | $17.04 | $8.57 | $8.47 | $2.36 |
| 2017 | $102.43 | 9.00% | $19.40 | $9.22 | $10.18 | $2.37 |
| 2018 | $115.70 | 8.50% | $22.15 | $9.83 | $12.32 | $2.39 |
| 2019 | $130.08 | 7.75% | $25.34 | $10.08 | $15.26 | $2.46 |
| 2020 | $150.45 | 7.00% | $29.77 | $10.53 | $19.24 | $2.59 |
| Dollars in millions excluding price per share | |
| Discounted earnings | $33.15 |
| book value | $58.60 |
| enterprise value | $91.75 |
| price per share (using 30M shares) | $3.06 |
| Volume | |
| Day Range: | |
| Bid Price | |
| Ask Price | |
| Last Trade Time: |


