 News
News  Market Data
  Discover
Support: 888-992-3836
Copyright © 2023 InvestorsHub Inc.


Register for free to join our community of investors and share your ideas. You will also get access to streaming quotes, interactive charts, trades, portfolio, live options flow and more tools.
When all of COMEX phyzzz and all of lbma phyzzz moves to Shanghai, wonder what happens to this manipulative bullshit game?
Silver Continues to Look Strong
By: Christopher Lewis | July 11, 2024
• The silver market rallied a bit during the session on Thursday, as the markets continue to focus on the idea of inflation cooling in the United States, and the CPI numbers on Thursday will have reiterated this potential influence.
Silver Markets Technical Analysis
The silver market has broken to the upside during the trading session on Thursday, as the consumer price index numbers in the United States came out much weaker than anticipated. This has people hoping and perhaps even believing that the Federal Reserve is going to cut rates later this year, and that has people excited for risk appetite. With that being the case, it’s just a continuation of the very bullish behavior that we had seen in the silver market. And now it looks like we could threaten the recent highs near the $32.50 level.
We certainly saw a huge surge initially after that announcement came out cooler than anticipated. So, it’ll be interesting to see if we get any follow through. Short term pullbacks at this point in time should continue to be thought of as buying opportunities, and I think the $31 level will be the first support level. After that we have the $30 level, which of course is a large, round, psychologically significant figure which is starting to attract the attention of the 50 day EMA.
All things being equal, I think it is becoming increasingly obvious that silver is not a market you can sell, and therefore you have to look for buying opportunities, perhaps on dips, on short term charts, or maybe just a fresh new high. Silver, of course, is highly sensitive to interest rates, which obviously are dropping and therefore it frees silver to go higher. Also, there’s the industrial demand aspect of silver. So don’t forget that a lot of people will be looking to whether or not the Fed will stimulate the economy.
Read Full Story »»»
 DiscoverGold
That candle for this morning is over 1.2 billion ozs sold? lol
Silver $SLV - Update: Holding steady from the 'Flag' B/Out. Also Daily 12 & 20/MA's are back Bullishly aligned
By: Sahara | July 10, 2024
• $SILVER $SLV - Update
Holding steady from the 'Flag' B/Out. Also Daily 12 & 20/MA's are back Bullishly aligned

Read Full Story »»»
DiscoverGold
Silver's AI Boom: The Next Big Trade You Need to Know About
By: Karl Montevirgen | July 10, 2024
• Silver may be the next big "AI trade"
• While silver ETFs are seeing large outflows, silver futures are telling a different story
• Understanding silver's seasonal pattern and identifying the key levels to watch are critical
Over the last few years, the "AI trade" has shifted from the hottest trend to a portfolio centerpiece. The rationale for the shift is obvious: it's hard to imagine future technology without AI.
But while the AI trade revolves around the usual suspects—semiconductors and various big tech stocks—silver is a critical yet overlooked component supplying the entire AI industry.
Silver's Role in the AI Industry
Silver isn't the only metal in AI tech production; its role is critical. Without it, AI—and much of electronic tech—wouldn't exist. Its applications in thermal conductivity, semiconductor fabrication, sensors, connectors, and photovoltaic cells make silver indispensable in AI tech production.
The Silver Institute says global silver demand is set to hit around 1.2 billion ounces this year, the second-highest level ever recorded. Even with more silver being produced in response to industrial demand, analysts still believe the market will be in deficit for the fourth year in a row.
Silver's 5-Year Seasonality Chart
Take a look at silver's ($SILVER) five-year seasonality performance using StockCharts' Seasonality chart tool.

CHART 1. 5-YEAR SEASONALITY CHART OF SILVER. Note the volatile performance quarter by quarter.
First, why a five-year seasonality chart? The answer is that it gives more weight to silver's industrial demand and the AI trade starting in the year before the COVID lockdown. Still, if the market has been in a supply deficit for four years while demand keeps rising, you might wonder if the current price is somehow ‘repressed,' setting the stage for a big surge.
• Over the last four years, silver has returned, on average, 8.5% this month (average returns are at the bottom of the bar).
• August and September show the summer doldrums, with the latter's figure looking quite dismal.
• October through December, the best months, topped even that of March through May in terms of average returns and, to some extent, higher close rates (those are the numbers above the bar).
Silver's Macro View Shows Major Breakout
Looking back at silver's performance over the last 16 years, the white metal is breaking out of a wide (and very ugly) four-year trading range.

CHART 2. WEEKLY CHART OF SILVER. Silver just broke out of a four-year (and very volatile) trading range.
Looking at the Chaikin Money Flow (CMF) indicator, you can see how the rallies correspond to the increased buying pressure. The current reading may not be as dramatic as the levels seen in 2010 and 2011, but this is where you make an informed guess as to whether such a move is about to start.
Silver's price broke above the four-year resistance level at $30. However, it faces technical headwinds at approximately $36, $44, and right below $50 (the highest level reached was $49.45 in 1980 and $48.70 in 2011).
Are Big Players Scooping Up What Retail Investors Are Ditching?
Before looking at the daily chart from a tactical perspective for some potential entry points, let's first compare the silver futures market ($SILVER) to the iShares Silver Trust ETF (SLV) and focus specifically on the different readings from the CMF, which represents buying vs selling pressure.

CHART 3. DAILY CHART COMPARISON OF SILVER FUTURES VS ISHARES SILVER TRUST ETF. Notice the difference in money flow between the two.
The price correlation between the two markets is very tight, as SLV is a commodity-backed ETF. But look at the difference in money flow. The futures market shows a positive reading while the ETF dipped into negative territory.
Does this represent the sentiment of different types of market participants—namely, institutional investors (or commercial traders) versus retail investors? If so, might it indicate that the bigger players are buying what the retail traders are selling to them at a possible discount? It's something to think about.
Analyzing SLV's Near-Term Price Action
Take a look at the daily chart of SLV below. The StockCharts Technical Rank (SCTR) score is soaring above the 90 line, indicating technical bullishness across several indicators and timeframes.
The CMF is below the zero line, indicating retail investors may be liquidating positions. However, is quiet accumulation occurring among institutional players in the futures market amid retail selling?
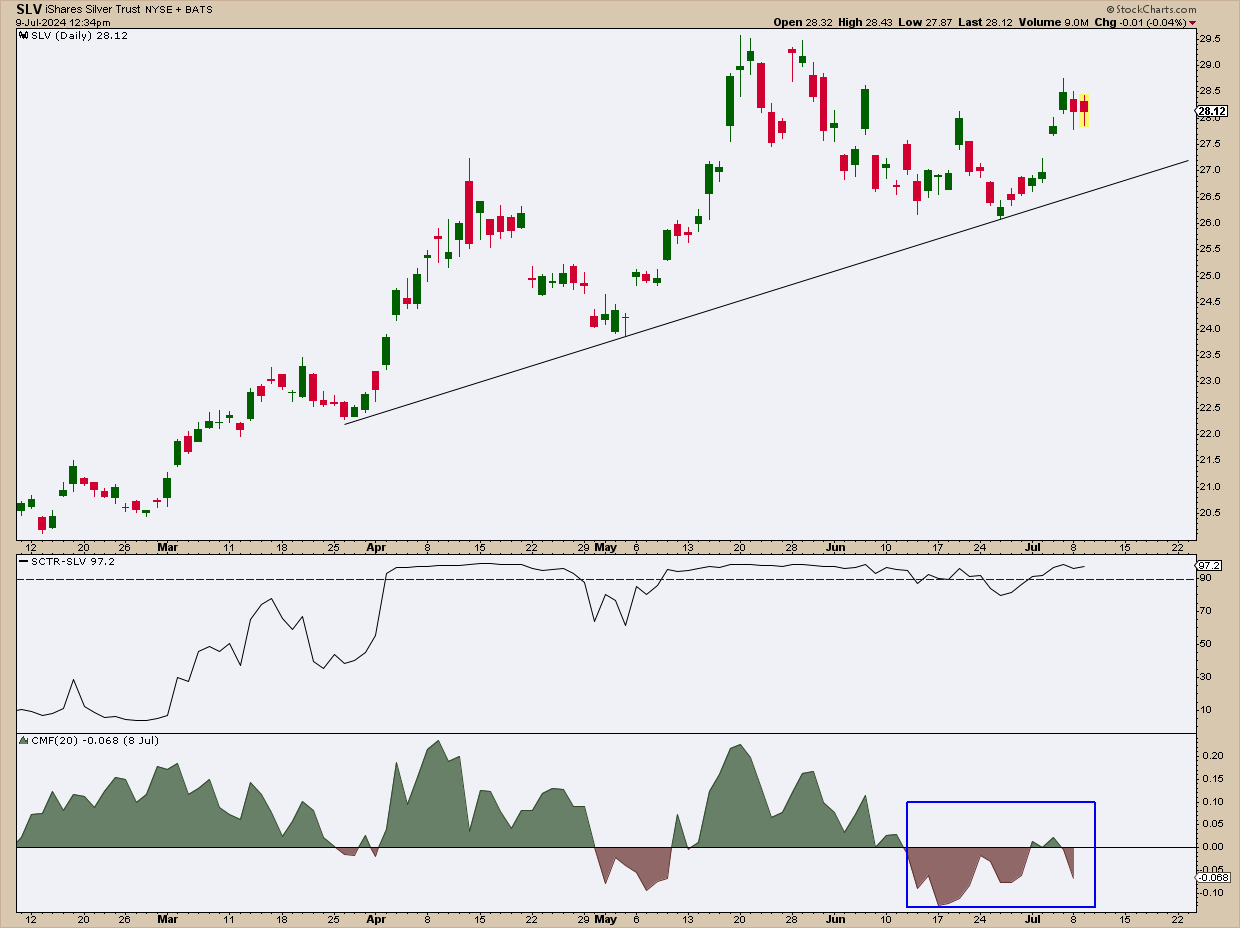
CHART 4. DAILY CHART OF SLV. The CMF divergence is clear, but given how it almost contradicts the reading you get with silver futures, it almost changes the story the charts tell.
Take a look at the trendline (black) on the SLV chart. If silver's seasonal tendency materializes, then you would expect near-term weakness. SLV's price will likely test the trendline first (at whatever price point that will be at the moment) before testing the most recent swing low at $26.00. Should the price break below that level, you can expect support at the next major swing low at $24.00.
If price falls below that, there is further support at consecutive swing lows, but you will want to re-examine the macro situation before taking any further action.
Add the following two charts to your StockCharts ChartLists.
The $SILVER chart shows what the silver futures (continuous contracts) price action looks like in contrast to the iShares Silver Trust ETF (SLV). The ETF is designed to track the futures, but look closely—those little technical differences might lead you to hidden market opportunities.
Closing Bell
Not many retail traders see it, but silver shines in the AI world. AI's rise as a portfolio must-have puts a spotlight on silver's critical role in tech production. But there's a catch—silver supply may not be keeping up with soaring demand. While silver futures show strong buying, retail investors are ditching the SLV ETF. Big players might be scooping up what retail traders are selling, potentially setting the stage for a massive price surge later in the year.
Read Full Story »»»
DiscoverGold
$SLV Significant uptick in calls today (Silver ETF) The $2.1 Million OTM call is the most unusual in this picture, due to its November expiration and 36K volume of contracts
By: Cheddar Flow | July 8, 2024
• $SLV Significant uptick in calls today (Silver ETF)
The $2.1M OTM call is the most unusual in this picture, due to its November expiration and 36K volume of contracts

Read Full Story »»»
DiscoverGold
Silver Inside Day Sets Stage for Potential Breakout
By: Bruce Powers | July 8, 2024
• Silver’s inside day after recent rally hints at a bullish breakout above 31.37, eyeing resistance at 31.55.
Silver pulled back a bit on Monday from its rally high of 31.49 reached last Friday. It is on track to complete an inside day today as trading is contained within Friday’s price range. Last week’s bullish reversal in the weekly time frame set the stage for a continuation higher. A rest day following last week’s advance to a seven-week closing high is normal and healthy for the developing advance. It should lead to a new setup for a bullish continuation of the trend.

Inside Day Breakout Setting Up
An aggressive bull signal will be given on a decisive rally above today’s high of 31.37. That will trigger an inside day breakout. It reflects a breakout from a consolidation pattern on the daily time frame. Therefore, traders will be watching for strong upside follow through if the signal is triggered. If that doesn’t happen, the breakout is subject to failure.
Downside Price Levels
On the downside, near-term support is at today’s low of 30.44. If it fails to maintain support, Friday’s low of 30.13 is next in line. If broken to the downside, natural gas could fall to test support around the bullish breakout area around 29.70 that was triggered last Wednesday. That price area is supported by the 20-Day MA at 29.69 and the 50-Day MA at 29.58.
Next Target Above Trend High is 33.17
A decisive rally above today’s high could be the beginning of an upside continuation set to challenge the interim swing of 31.55. That is the next higher price level on the agenda. Once there is a daily close above 31.55, silver should then be ready to again approach the 32.52 trend high from early-May and will likely break above it. A basic extended retracement target for silver is 33.17. That price level completes a 127.2% Fibonacci extended retracement of the most recent bearish pullback. In other words, a 100% retracement will complete at the most recent swing high of 32.52.
So far, trading in July has been contained within June’s trading range. But last month’s high of 31.55 will likely be challenged as resistance before this month is over, with an upside monthly breakout a likely resolution. This puts greater weight on the behavior of silver relative to the 31.55 price level mentioned earlier.
Read Full Story »»»
DiscoverGold
NY Silver COMEX Futures »» Weekly Summary Analysis
By: Marty Armstrong | June 6, 2024
NY Silver COMEX Futures closed today at 31689 and is trading up about 31% for the year from last year's settlement of 24086. This price action here in July is reflecting that this is within the scope of a bearish reactionary move on the monthly level thus far. As we stand right now, this market has made a new high exceeding the previous month's high reaching thus far 31790 intraday and is still trading above that high of 31670.
Up to now, we still have only a 1 month reaction decline from the high established during May. We must exceed the 3 month mark in order to imply that a trend is developing.
ECONOMIC CONFIDENCE MODEL CORRELATION
Here in NY Silver COMEX Futures, we do find that this particular market has correlated with our Economic Confidence Model in the past. The Last turning point on the ECM cycle low to line up with this market was 2020 and 2015 and 2001. The Last turning point on the ECM cycle high to line up with this market was 2011 and 1998.
MARKET OVERVIEW
NEAR-TERM OUTLOOK
The NY Silver COMEX Futures has continued to make new historical highs over the course of the rally from 2020 moving into 2024. Prominently, we have elected four Bullish Reversals to date.
This market remains in a positive position on the weekly to yearly levels of our indicating models. Pay attention to the Monthly level for any serious change in long-term trend ahead.
Solely focusing on only the indicating ranges on the Daily level in the NY Silver COMEX Futures, this market remains moderately bullish currently with underlying support beginning at 31180 and overhead resistance forming above at 32280. The market is trading closer to the support level at this time.
On the weekly level, the last important high was established the week of May 20th at 32750, which was up 14 weeks from the low made back during the week of February 12th. We have been generally trading up for the past 3 weeks from the low of the week of June 10th, which has been a move of 10.65%. When we look deeply into the underlying tone of this immediate market, we see it is currently still in a weak posture. Immediately, this decline from the last high established the week of May 20th has been important Before, this recent rally exceeded the previous high of 29905 made back during the week of April 8th. That high was likewise part of a bullish trend making higher highs over the week of March 18th. This immediate decline has thus far held the previous low formed at 21975 made the week of February 12th. Only a break of that low would signal a technical reversal of fortune and of course we must watch the Bearish Reversals.
Right now, the market is above momentum on our weekly models hinting this is still bullish for now. Looking at this from a wider perspective, this market has been trading up for the past 9 weeks overall.
INTERMEDIATE-TERM OUTLOOK
YEARLY MOMENTUM MODEL INDICATOR
Our Momentum Models are declining at this time with the previous high made 2021 while the last low formed on 2023. However, this market has rallied in price with the last cyclical high formed on 2021 and thus we have a divergence warning that this market is starting to run out of strength on the upside.
Critical support still underlies this market at 24044 and a break of that level on a monthly closing basis would warn that a sustainable decline ahead becomes possible. Nevertheless, the market is trading above last month's high showing some strength.
DiscoverGold
Silver 6-month analogs (pattern recognition) suggest a bullish set-up based on historical precedents
By: Nautilus Research | July 3, 2024
• #SILVER 6-month analogs (pattern recognition) suggest a bullish set-up based on historical precedents.

Read Full Story »»»
DiscoverGold
Silver Continues to Look Good
By: Christopher Lewis | July 5, 2024
• Silver continues to be strong, and it now looks as if we are getting close to another breakout to the upside. The jobs number has shown itself to be stronger than expected, but only slightly. It looks like we will have more of the same behavior.
Silver Markets Technical Analysis
The silver market has shown itself to be rather resilient during the trading session after it initially pulled back. It turned right back around and defended the $30 level. At this point, it does look like it’s going to do everything it can to rally and break out. And if and when it does, I think you’ve got a situation where traders will be looking at this through the prism of trying to play the momentum. Remember, silver is a very momentum driven market.
And as a result, I think a lot of traders will be very interested in trying to get long if we can break above the region that we are currently threatening in the area of $30.75. At that point, I think we probably go looking to the $31.50 level and then eventually the $32 level. Short-term pullbacks should continue to be buying opportunities and silver, I think, has already proven itself to be resilient before Friday.
And now that Friday has had the announcement come out, I think it shows just how possible it is that silver will be a big winner. I would be cautious with position sizing. Silver can be very noisy, but ultimately you cannot be a seller of this market anymore. It’s shown you that it’s not willing to break down. Whether or not we can break above $32 remains to be seen, but it certainly looks like we’re going to try to get there, although I do not know how long it will take at this point.
Read Full Story »»»
DiscoverGold
Star Spangled Silver Breakout. Manic Metals Report
By: Phil Flynn | July 3, 2024
The silver market knows how to celebrate independence by breakout for the resistance that bound it. Silver seems to have ended its correction and traded at the highest level since the first day of summer June 21st, as the dollar rally is looking vulnerable and reports of strong physical demand.
As Myra Picache at MarketWatch pointed out that silver outpaced not only gold in the first quarter but copper and the S@P 500.
She Wrote that “Metals marked a “generally” positive second quarter, analysts at Deutsche Bank said in a note dated Monday.
The total return for silver’s spot price was at 16.7% for the period, while copper’s was at 9.6%, with both posting their strongest quarterly total return performances in six quarters, Deutsche Bank said. Gold’s 4.3% return in the second quarter, meanwhile, was its third straight quarterly gain.
Silver, which is a very good conductor of electricity, is seeing increased demand for uses in solar panels and semiconductor chips, Caruso said. There was a notable jump in solar-panel demand last year, and now demand for artificial-intelligence chips has silver “front and center from a demand perspective.”
Based on the most-active futures contracts, silver climbed by 18.6% in the second quarter, outpacing gold’s 4.5% rise and copper’s 9.6% climb, according to Dow Jones Market Data. For the first half of this year, silver futures posted a rise of 22.7%, compared with gains of 12.9% each for gold and copper futures.
The key for silver today will be the ADP jobs report we also have early speech from fed chairman Paul and the market will have any indications on interest rates but because it looks like the dollar is starting to look choppy it’s very possible that we can see a nice pop not only on silver but across the metals complex
Palladium looks like it’s also broken out and platinum has a very strong possibility to catch up to silver.
Political uncertainty of course is also going to give some support to the metals. Not only overseas but here in the United States.
Kitco Metals wrote that :”The prospect of a Trump victory in November could push investors around the world into the yellow metal, while both gold and silver prices stand to benefit from tariffs and trade disputes, according to precious metals analysts at Heraeus. “
In their latest precious metals report, Heraeus suggested that the economic policies of a second Trump administration could drive global investors into gold.
“The upcoming 5 November presidential election will set the United States on two fundamentally different paths, depending on the outcome,” the analysts wrote. “The more unpredictable former president and current Republican candidate, Donald Trump, may introduce several economic policies that could lead to significant market shocks, geopolitical risks and rising inflation. Trump currently maintains an edge over Biden in the polls – 46.9% vs. 45.0%.”
I think they need to calm down everybody has to remember that all the predictions of economic doom and gloom the first time Donald Trump became president turned out not to be true in fact we saw the markets really soar under Donald Trump we saw inflation low and this fear mongering about the so-called trade wars I think it’s overstated for metals still there are other reasons to be long metals right now because inflation is still an issue and because the dollar more than likely is at a top.
WE will see how the ADP report looks but we continue to look to buy breaks.
Read Full Story »»»
DiscoverGold
Silver $SLV - Recall also I was looking for it to hold for a Qtrly & Semesterly B/Out
By: Sahara | July 3, 2024
• ... $SILVER $SLV - Recall also I was looking for it to hold for a Qtrly & Semesterly B/Out.
Which we got, and also we held above the Qtrly 'Ichimoku Cloud'. Now we just need that 'Flag' B/Out to get motoring...

Read Full Story »»»
DiscoverGold
Silver Faces Persistent Downtrend, Key Levels Under Threat
By: Bruce Powers | July 1, 2024
• Silver remains in a downtrend, testing key moving averages with selling pressure dominant, signaling potential further declines unless a clear bullish breakout occurs.
Silver further consolidated on Monday and is on track to end with an inside day. It remains in a downtrend and again tested the 20-Day MA (purple) today as resistance and then sold off intraday. The day’s high was 29.48 and the low was 28.96.
There was also a successful test of resistance at the 20-Day line last Friday. Today’s high generates a lower daily high relative to Friday’s high, a short-term sign of weakness. Further, although silver popped back above the orange 50-Day MA both today and Friday, it closed below it the previous four days and it may do so again today. Silver is already below its uptrend line.

Downtrend Remains Dominant
Taken together, unless there is a clear bullish sign, silver is pointing lower. It remains in a developing downtrend. A failure to break above the 20-Day line, as well as the closes below the 50-Day line, show selling pressure remaining dominant.
Subsequently, a decline below today’s low of 28.96 is a sign of weakness and may be the beginning of the end for the small bullish retracement of the past several days. Friday’s low was 28.77 and Thursday hit a low of 26.68. Those price levels can be watched for additional bearish confirmation, while a bear trend continuation signal is indicated on a drop below the current retracement low at 28.57.
Following the decline below the uptrend line on June 24, silver fell below the 50-Day line before finding support at 28.57. That low completed a 61.8% Fibonacci retracement of an internal upswing, which correlates with the May 2021 swing high of 28.75. If the latest swing low fails to maintain support the next lower target zone is around the 78.6% Fibonacci retracement at 27.41, followed by 27.0, which was previous resistance at the March 2022 interim swing high.
Rise Above 29.73 Would Reflect Strength
For a bullish sign, a decisive breakout above last week’s high of 29.73 would be needed. That would also put silver back above the 20-Day MA. Additional signs of strength would then be needed. Recapturing the 30.14 price level would provide additional signs of strength.
The 30.14 price level comes from the peak in 2021. It remained the high intraday traded price for silver up until the decisive bullish breakout on May 17 of this year. Notice the clear bullish momentum and strong daily close on the breakout day. Therefore, recapturing the 30.14 price level could see buyers return more aggressively to assist in the continuation of the bull trend.
Read Full Story »»»
DiscoverGold
Look at that they had to sell 150m shares oz to tap down silver this morning lol
Central banks buy 10 tonnes of gold in May
#silver
NY Silver COMEX Futures »» Weekly Summary Analysis
By: Marty Armstrong | June 29, 2024
This market made a new high today after the past 3 trading days. The market opened higher and closed higher. The immediate trading pattern in this market has exceeded the previous session's high intraday reaching 29955. Therefore, this market has rallied over the past 11 trading sessions and there is a potential to move up for another 2 daysNevertheless, this market remains well above all seven of our intial support levels. Nonetheless, the market remains neutral on our system indicators.
This market has not closed above the previous cyclical high of 30905. Obviously, it is pushing against this resistance level.
Up to now, we still have only a 1 month reaction decline from the high established during May. We must exceed the 3 month mark in order to imply that a trend is developing.
ECONOMIC CONFIDENCE MODEL CORRELATION
Here in NY Silver COMEX Futures, we do find that this particular market has correlated with our Economic Confidence Model in the past. The Last turning point on the ECM cycle low to line up with this market was 2020 and 2015 and 2001. The Last turning point on the ECM cycle high to line up with this market was 2011 and 1998.
MARKET OVERVIEW
NEAR-TERM OUTLOOK
The NY Silver COMEX Futures has continued to make new historical highs over the course of the rally from 2020 moving into 2024. Clearly, we have elected four Bullish Reversals to date.
This market remains in a positive position on the weekly to yearly levels of our indicating models. Pay attention to the Monthly level for any serious change in long-term trend ahead.
The perspective using the indicating ranges on the Daily level in the NY Silver COMEX Futures, this market remains moderately bearish position at this time with the overhead resistance beginning at 29690 and support forming below at 29505. The market is trading closer to the support level at this time.
On the weekly level, the last important high was established the week of May 20th at 32750, which was up 14 weeks from the low made back during the week of February 12th. Afterwards, the market bounced for 18 weeks reaching a high during the week of June 17th at 28985. Since that high, we have been generally trading down for the past week, which has been a significant move of 6.633% in a reactionary type decline. Nonetheless, the market still has not penetrated that previous low of 21975 as it has fallen back reaching only 28855 which still remains 31.30% above the former low.
When we look deeply into the underlying tone of this immediate market, we see it is currently still in a weak posture.
Looking at this from a broader perspective, this last rally into the week of June 17th reaching 30905 failed to exceed the previous high of 32750 made back during the week of May 20th. That rally amounted to only four weeks. Right now, the market is neutral on our weekly Momentum Models warning we have overhead resistance forming and support in the general vacinity of 29220. Resistance is to be found starting at 30235.
INTERMEDIATE-TERM OUTLOOK
YEARLY MOMENTUM MODEL INDICATOR
Our Momentum Models are declining at this time with the previous high made 2021 while the last low formed on 2023. However, this market has rallied in price with the last cyclical high formed on 2021 and thus we have a divergence warning that this market is starting to run out of strength on the upside.
Critical support still underlies this market at 24044 and a break of that level on a monthly closing basis would warn that a sustainable decline ahead becomes possible. Immediately, the market is trading within last month's trading range in a neutral position.
DiscoverGold
Silver $SLV - Looking for a Qtrly & Semesterly B/Out. As long as it holds this week...
By: Sahara | June 26, 2024
• $SILVER $SLV - Update
Looking for a Qtrly & Semesterly B/Out. As long as it holds this week...

Read Full Story »»»
DiscoverGold
Silver Tests Key Support, Potential Bullish Reversal Ahead
By: Bruce Powers | June 24, 2024
• Silver awaits a breakout signal as it consolidates near the 50-Day moving average.
Silver further tested a support zone on Monday following last Thursday’s failed bullish breakout above the 50-Day MA and downtrend line. Today’s pullback took silver below Friday’s low briefly before finding support at 29.35. Key trend support of the 50-Day MA continues to be a critical support area. It is currently at 29.16. Despite being at risk of falling below the 50-Day MA, silver has managed to largely stay above it since the June 13 swing low of 28.66 ended an attempt to fall further below the line, at least temporarily.

Silver Sitting in Precarious Position
Silver is sitting in a precarious position on its chart and remains at risk of a deeper retracement. Although support has been holding, another sharp test of recent lows could see support broken and silver head to test lower potential support levels. Last week’s low of 28.93 is a key price level to watch. A decisive drop below that price triggers a weekly bearish signal. If triggered to the downside, the June 13 swing low is then more likely to be tested and possibly exceeded with lower prices being targeted.
Watch Trendlines
Recently, silver has seen either support or resistance near one of the trendlines positioned on the chart. The downtrend line was an area of resistance last week and the uptrend line showed support before then. Also, it marked a support area on Friday and is reflecting an area of support again today. The next lower support zone looks to be from around 29.16 to 28.30.
Breakout Above 30.85 Needed for Bulls
Given its current positioning on the chart, silver would need to get above last week’s high of 30.85 before giving a bullish signal. Until then, it can continue to be range bound if it doesn’t fall below and stay below the 50-Day MA. A subsequent daily close above 30.85 should lead to a test of the recent record high of 32.52, followed by a continuation higher. The next two higher targets would then be 33.17 and 33.80. You can see how 33.80 is part of a larger price zone that goes up to about 34.06.
Read Full Story »»»
DiscoverGold
Small Speculators in Silver were still buying despite the price downturn. That choice does not usually work out well for them
By: Tom McClellan | June 22, 2024
• The CFTC's COT Report is usually released on Fridays, but it was delayed this week by the holiday on Wednesday, so I'll be updating selected charts for my Daily Edition subscribers on Monday. https://mcoscillator.com/market_reports/ Last week's report showed the small speculators in silver were still buying despite the price downturn. That choice does not usually work out well for them.

Read Full Story »»»
DiscoverGold
NY Silver COMEX Futures »» Weekly Summary Analysis
By: Marty Armstrong | June 22, 2024
NY Silver COMEX Futures closed today at 29614 and is trading up about 22% for the year from last year's settlement of 24086. At present, this market has been rising for 3 months going into June reflecting that this has been only still, a bullish reactionary trend.
ECONOMIC CONFIDENCE MODEL CORRELATION
Here in NY Silver COMEX Futures, we do find that this particular market has correlated with our Economic Confidence Model in the past. The Last turning point on the ECM cycle low to line up with this market was 2020 and 2015 and 2001. The Last turning point on the ECM cycle high to line up with this market was 2011 and 1998.
MARKET OVERVIEW
NEAR-TERM OUTLOOK
The NY Silver COMEX Futures has continued to make new historical highs over the course of the rally from 2020 moving into 2024. Clearly, we have elected four Bullish Reversals to date.
This market remains in a positive position on the weekly to yearly levels of our indicating models. Pay attention to the Monthly level for any serious change in long-term trend ahead.
Looking at the indicating ranges on the Daily level in the NY Silver COMEX Futures, this market remains neutral with resistance standing at 29650 and support forming below at 29555. The market is trading closer to the resistance level at this time.
On the weekly level, the last important high was established the week of May 20th at 32750, which was up 14 weeks from the low made back during the week of February 12th. We have been generally trading up for the past week from the low of the week of June 10th, which has been a move of 7.570%. When we look deeply into the underlying tone of this immediate market, we see it is cautiously starting to weaken since the previous high at 5212 made 2502 weeks. Immediately, this decline from the last high established the week of May 20th has been important closing sharply lower as well. Before, this recent rally exceeded the previous high of 29905 made back during the week of April 8th. That high was likewise part of a bullish trend making higher highs over the week of March 18th. This immediate decline has thus far held the previous low formed at 21975 made the week of February 12th. Only a break of that low would signal a technical reversal of fortune and of course we must watch the Bearish Reversals. Right now, the market is below momentum on our weekly models casting a bearish cloud over the price action as well as trend, long-term trend, and cyclical strength. Looking at this from a wider perspective, this market has been trading up for the past 7 weeks overall.
INTERMEDIATE-TERM OUTLOOK
YEARLY MOMENTUM MODEL INDICATOR
Our Momentum Models are declining at this time with the previous high made 2021 while the last low formed on 2023. However, this market has rallied in price with the last cyclical high formed on 2021 and thus we have a divergence warning that this market is starting to run out of strength on the upside.
Interestingly, the NY Silver COMEX Futures has been in a bullish phase for the past 7 months since the low established back in October 2023.
Critical support still underlies this market at 24044 and a break of that level on a monthly closing basis would warn that a sustainable decline ahead becomes possible. Immediately, the market is trading within last month's trading range in a neutral position.
DiscoverGold
Silver $SLV - Looking like a failed pop of the 'Flag' With Dirty RailRoad-Lines'
By: Sahara | June 21, 2024
• $SILVER $SLV - Latest
Looking like a failed pop of the 'Flag' With Dirty RailRoad-Lines'. Unless it can rebound from the 12/MA (Unlikely).
Otherwise target is my Alt-y & that 150/MA...

Read Full Story »»»
DiscoverGold
Summer Silver Fun Run. Manic Metals Report
By: Phil Flynn | June 21, 2024
Silver melted up on the summer heat hitting the highest level since June the 6th, Copper popped and dropped on reports of record Chinese copper exports. And while they tried to pull back, weak data out of Europe is causing another potential for an upward run.
Bloomberg reported that “Bonds surged after business activity across Europe encountered an unexpected setback, prompting traders to amp up wagers on monetary easing.
The yield on Germany’s benchmark 10-year bonds fell six basis points, dragging the rate on US Treasuries lower, after manufacturing and services PMI readings for Europe’s two biggest economies fell short of expectations. Markets moved to price a higher chance of two additional rate cuts from the European Central Bank this year, after the separate index for the whole of the euro-zone also dropped more than forecast in June.”
That helped gold breaks up out of consolation as they are waiting for the Chinese central bank to step back into the buy side of the market as a new central bank buyer is raising eyebrows.
Palladium had nice bottoming action and platinum above one thousand for the first time since June the seventh. Still Fed Talk and triple witching are causing some cover the outlook for metals is looking bullish both long term and short term and on pace for a wild summer ride.
Copper was struggling the usual concern was China. Zero Hedge wrote that Cina’s Copper Exports Jump to Record On ‘Export Arbitrage’
They wrote that “Until the Chinese government introduces more robust stimulus packages to counter soft economic data and exporters in the world’s second-largest economy ease up on flooding global markets with copper, prices of the base metal—crucial for power lines and AI data centers—are expected to remain under pressure.
The latest customs data from Bloomberg shows that Chinese exports of unwrought copper and other products in May doubled from last year to roughly 150,000 tons, exceeding the previous high in 2012. This comes as copper prices hit a record high of more than $5.10/lb on COMEX.
Central Banks buying of gold continues to be a major drive. The World Gold Council wrote that “An increasingly complex geopolitical and financial environment is making gold reserves management more relevant than ever. In 2023, central banks added 1,037 tonnes of gold – the second highest annual purchase in history – following a record high of 1,082 tonnes in 2022.
Following these record numbers, gold continues to be viewed favorably by central banks as a reserve asset.
According to the 2024 Central Bank Gold Reserves (CBGR) survey, which was conducted between 19 February and 30 April 2024 with a total of 70 responses, 29% of central banks respondents intend to increase their gold reserves in the next twelve months, the highest level we have observed since we began this survey in 2018. The planned purchases are chiefly motivated by a desire to rebalance to a more preferred strategic level of gold holdings, domestic gold production, and financial market concerns including higher crisis risks and rising inflation.
China purchases are being watched closely by gold, But not just China. Thailand is going for the Gold
Jan Nieuwenhuijs of Gainesville Coins wrote that “Shedding its long-standing price sensitivity to the price of gold, Thailand is currently a gold buyer driving the price up, just like China
Present changes in the global gold market, in which pricing power is shifting East, could be a precursor to a transformation in the international monetary order. Possibly, trade in the East will settle through a system connecting local CBDCs, while any remaining imbalances are transferred in gold.’
Buying physical gold and silver on pullbacks as well as future strategies the wild ride along with options are probably a very good way to play this market over the next few months.
Read Full Story »»»
DiscoverGold
Gold and Silver Charts Looking Most Encouraging...
By: Clive Maund | June 19, 2024
The charts for gold and silver continue to look very positive and this looks like a good point to buy the sector after the correction of the past month that has caused quite severe reactions in a number of PM stocks. This update features 6-month charts for gold, silver and GDX (stocks ETF) and probably the most important point to observe on them is the way that the Accumulation line for each of them has held up very well on the correction and remarkably the Accumulation line for gold has been making new highs despite gold being still some way below its highs and silver looks strong in this regard too. This is viewed as very bullish and a sign that the corrective phase has run its course and a new intermediate uptrend is likely to begin soon. Another interesting point to observe on these charts is the recent strength of silver relative to gold – gold has been in corrective mode since April but silver forged ahead in May making another upleg within its uptrend. Note also how the earlier overbought condition on all these charts has now fully unwound, as shown by their respective MACD indicators, which means that upside potential has been fully restored.
The conclusion is that we are at a very good point to buy the sector or add to positions especially in the better stocks that have corrected.


Read Full Story »»»
DiscoverGold
Silver $SLV After tapping my Wave-C Target (Or 'Dbl Zig-Zag') moved up to recover and realign the 4Hr 12/20 MA's and is now at the Uppr end of the Bull 'Flag' where it coincides with the 150/MA
By: Sahara | June 20, 2024
• $SILVER $SLV - Latest
After tapping my Wave-C Target (Or 'Dbl Zig-Zag') moved up to recover and realign the 4Hr 12/20 MA's and is now at the Uppr end of the Bull 'Flag' where it coincides with the 150/MA.
Can it push thru or will it want another drop??...

Read Full Story »»»
DiscoverGold
Silver $SLV finding support right at the 50D moving average
By: Barchart | June 18, 2024
• Silver $SLV finding support right at the 50D moving average.

Read Full Story »»»
DiscoverGold
Silver Tests Key Support, Potential Bullish Reversal Ahead
By: Bruce Powers | June 17, 2024
• Silver awaits a breakout signal as it consolidates near the 50-Day moving average.
Silver has been testing support around the 50-Day MA for the past several days as it looks to complete a retracement. The pullback low is 28.66 and that is the key support level to watch for further signs of weakness. A decisive drop below that price level puts silver in a more bearish position given that the uptrend will have been broken by then, as well as the 50-Day MA. Each line represents dynamic support for the near-term uptrend. A quick recovery back above 28.66 may negate the bearish implications. Otherwise, the swing low from 26.02 becomes a lower target.

Pullback Low Shows Support
Last week’s low of 28.66 looks to have completed five waves down, thereby opening the door to a possible bottom and subsequent bullish reversal. Not only did the retracement low find support around the 50-Day MA and uptrend line, but it was also a successful test of support around the May 2021 swing high at 28.75. In addition, the low found support around the bottom trendline of a falling channel. There are several technical reasons for 28.66 to hold and lead to a bullish reversal. But there are no signs of it happening yet though.
Upside Breakout Above 29.73
An upside breakout above the three-day high of 29.73 will provide a sign of strength. Note that silver is currently on track to end Monday with an inside day. It would follow an inside day on Friday. Therefore, there is the potential for a double inside day breakout to trigger if today ends as an inside day. Nonetheless, the three-day high should provide a more reliable signal given that silver remains in a downtrend retracement.
Weekly Bull Rally Above 30.26
Last week’s high of 30.26 provides a first upside target for a bounce. However, a rally above 30.26 shows further signs of strength that may lead to a continuation higher as it triggers a bullish weekly breakout. Once there is a daily close above 30.26 silver should be in a stronger position to continue to strengthen. Also of concern is the 20-Day MA at 30.40. It was a key trend indicator for support until silver dropped below it twice, on June 3 and then June 7, before staying below it.
Read Full Story »»»
DiscoverGold
Silver Continues to See Supportive Action
By: Christopher Lewis | June 17, 2024
• The silver market fell a bit in the early hours on Monday but continues to see buyers come back into the picture, as the markets seem to be trying to find some kind of bottom or floor in this general vicinity.
Silver Markets Technical Analysis
Silver initially pulled back just a bit during the early hours on Monday, only to find buyers again as it looks like we are in the midst of some type of bottoming process. If we can rally from here, and it certainly looks like we very well could, breaking above the $30 level almost certainly would bring in quite a bit of FOMO trading, and I think a lot of people would jump into silver at that point.
It’s worth noting that just below, we have the 50-day EMA that a lot of people have paid close attention to. And then again, we have the $28.50 level, which is an area that I think a lot of traders will look at through the prism of being important, mainly due to the fact that it was previous resistance and therefore it should have a lot of market memory attached to it. Because of this, I do think that there is a bit of a floor in this market.
And I think that as long as we stay above that floor, you’re still looking at a buy on the dip type of situation, but it’s going to be very choppy and noisy. Again, if we were to break above the $30 level, that could change in the sense that it could be a major shift in the momentum and perhaps get a lot of people jumping in. But right now, this is a market that looks like it’s trying to find its footing before perhaps bouncing yet again.
Remember, once we broke above the $26 level, we entered an area that typically has a lot of volatility and then eventually some type of horrifically volatile resolution where we go in one direction or the other. In the past, it’s been racing towards $50 only to collapse at that point, so we’ll have to see how this plays out.
Read Full Story »»»
DiscoverGold
NY Silver COMEX Futures »» Weekly Summary Analysis
By: Marty Armstrong | June 15, 2024
NY Silver COMEX Futures closed today at 29472 and is trading up about 22% for the year from last year's settlement of 24086. Presently, this market has been rising for 3 months going into June reflecting that this has been only still, a bullish reactionary trend.
ECONOMIC CONFIDENCE MODEL CORRELATION
Here in NY Silver COMEX Futures, we do find that this particular market has correlated with our Economic Confidence Model in the past. The Last turning point on the ECM cycle low to line up with this market was 2020 and 2015 and 2001. The Last turning point on the ECM cycle high to line up with this market was 2011 and 1998.
MARKET OVERVIEW
NEAR-TERM OUTLOOK
The NY Silver COMEX Futures has continued to make new historical highs over the course of the rally from 2020 moving into 2024. Prominently, we have elected four Bullish Reversals to date.
This market remains in a positive position on the weekly to yearly levels of our indicating models. Pay attention to the Monthly level for any serious change in long-term trend ahead.
From a perspective using the indicating ranges on the Daily level in the NY Silver COMEX Futures, this market remains neutral with resistance standing at 29985 and support forming below at 29220. The market is trading closer to the support level at this time.
On the weekly level, the last important high was established the week of May 20th at 32750, which was up 14 weeks from the low made back during the week of February 12th. We have seen the market drop sharply for the past week penetrating the previous week's low and yet it recovered to close above the previous week's close of 29440. We are trading below the Weekly Momentum Indicators warning that the decline is very significant and we need to pay attention to the timing and reversals. When we look deeply into the underlying tone of this immediate market, we see it is currently still in a semi neutral posture despite declining from the previous high at 32750 made 3 weeks ago. Still, this market is within our trading envelope which spans between 21304 and 35310. Immediately, this decline from the last high established the week of May 20th has been important closing sharply lower as well. Before, this recent rally exceeded the previous high of 29905 made back during the week of April 8th. That high was likewise part of a bullish trend making higher highs over the week of March 18th. This immediate decline has thus far held the previous low formed at 21975 made the week of February 12th. Only a break of that low would signal a technical reversal of fortune and of course we must watch the Bearish Reversals. Right now, the market is below momentum on our weekly models casting a bearish cloud over the price action as well as trend, long-term trend, and cyclical strength. Looking at this from a wider perspective, this market has been trading up for the past 6 weeks overall.
INTERMEDIATE-TERM OUTLOOK
YEARLY MOMENTUM MODEL INDICATOR
Our Momentum Models are declining at this time with the previous high made 2021 while the last low formed on 2023. However, this market has rallied in price with the last cyclical high formed on 2021 and thus we have a divergence warning that this market is starting to run out of strength on the upside.
Interestingly, the NY Silver COMEX Futures has been in a bullish phase for the past 7 months since the low established back in October 2023.
Critical support still underlies this market at 24044 and a break of that level on a monthly closing basis would warn that a sustainable decline ahead becomes possible. Immediately, the market is trading within last month's trading range in a neutral position.
DiscoverGold
Silver Attempts to Salvage Upward Momentum on Friday
By: Christopher Lewis | June 14, 2024
• The silver market has bounced a bit from the 50-Day EMA on Friday, as the markets have pulled back for some time. This market is one that continues to look at the $28.50 level as important. Also, we have to pay close attention to the $30 level above.
Silver Markets Technical Analysis
The silver market has dropped to the 50-day EMA over the last two trading sessions and now it looks like we are starting to see a little bit of recovery here and perhaps an attempt to get back towards the $30 level. The $30 level of course is a large round psychologically significant figure that a lot of people will be paying attention to. So therefore, I think you’ve got a situation where you were just simply looking to try to push this market there.
The $28.50 level is a support level that I think is crucial. It is a resistance barrier from previous. So, I do think a certain amount of market memory comes into the picture here. The pullback is fairly steep, but then again, the shot higher was fairly steep as well. You could make an argument for, you know, some type of Fibonacci retracement either from the bottom, basically lining up with the $28.50 level as the 38.2 Fibonacci retracement level, or you can look at the 61.8% Fibonacci retracement level from the shot higher when we took off from the $26 level.
That being said, this is a market that I do think favors the upside overall, and we will have to look at it through that prism. I have no interest in shorting silver, at least not until we break down below the $26 level, which at that point we would be challenging the 200 day EMA. So, it remains buy on the dip, but I think it’s very noisy. It’s not something that’s going to be easy to hang on to.
Read Full Story »»»
DiscoverGold
$SILVER $SPX Ratio - Update
By: Sahara | June 14, 2024
• $SILVER $SPX Ratio - Update
Hope was for a 'W' Shaped Bottom. Yet is still struggling at the Mthly 50/MA.
Also the latest move up is a smaller form of that up move from 2000 'Broadening Diagonal' Where we can see how deep the retrace goes, nearly 88/Fib. Can be as much as 99%..

Read Full Story »»»
DiscoverGold
Been like this and getting worse for decades. Physical is the only way. Paper game is just a paper game, don’t mean shit to a stacker. True stacker only cares about GSR and never profits into any medium of exchange. Asset for asset. $27-$28 should be the support in this cycle looking at chart in my opinion.
is there nobody else out there that lost their shirt trading this and is super pissed at just how over manipulated this is.. i feel like its a war between the fed and china at this point...
volatile to the downside on precise strikes with follow through.. this is whack b.s. the banks r in on it.. theyre absolutely insider trading this against the public..
this is no way should be this volatile... we should have seen 34-35 days ago if it werent for the endless blatant shorting... they r runing this market.. the only answer will be to stop trading their fake market and only hold physical..
pure manipulation. organized crime at the highest levels of the fed reserve.. there is nobody else with deep enough pockets and a motive to cause this.. they have literally destroyed people lives in the silver futures market with these moves that r baffling and make no sense to say the least..
Silver $SLV - Nice turn after tapping the Lwr 'Flag' Line
By: Sahara | June 12, 2024
• $SILVER $SLV - Nice turn after tapping the Lwr 'Flag' Line.
Came within a whisker of my Wave-C Target. Maybe close enough? Will need to recover and hold the 150/MA & pop the 'Flag to be more sure...

Read Full Story »»»
DiscoverGold
Silver Bounces Off Support Within a Retracement
By: Bruce Powers | June 10, 2024
• Silver hit a low of 29.12 last Friday, reaching an ABCD pattern target before beginning a bounce from support levels on Monday.
Last Friday silver retraced to a low of 29.12 to reach an extended downside target of 29.15 from a declining ABCD pattern. During Friday’s decline the prior retracement low of 29.38 failed to maintain support, leading to another and more direct test of support around the 50% retracement level of 29.27. The 29.15 price target was derived from a falling ABCD pattern with the CD leg of the pattern extended by 127.2% of the price change seen in the initial AB leg.

Bounce Off Friday Support
Today, Monday, silver held above last week’s support and began a bounce to retrace Friday’s wide range decline. It next heads up into a price range from around 29.97 to 30.05, derived from last Thursday’s low and a previous swing low, respectively. The 20-Day MA is up at 30.61. Given how far silver has fallen relative to its 50-Day MA and uptrend line (low end of rising trend channel), it wouldn’t be surprising to see silver test those lines as support before the current retracement is complete.
50-Day Trend Support at 28.78
The 50-Day MA is currently around 28.78. A little below the uptrend line is a price range from 28.50 to 28.30 consisting of the 61.8% Fibonacci retracement and the 161.8% extended target for the declining ABCD pattern. Notice that the 50-Day line is now aligned with a prior swing high from May 18 at 28.75.
Since the price of silver rallied back above the 50-Day MA on March 1, the line was successfully tested as support once in early-May. Both lines mark a similar price area and therefore they can be watched together as an area of possible trend support, along with the Fibonacci confluence zone noted above.
Retracement Dominates
On the upside, a definitive breakout above last week’s high of 31.55 would be needed for bullish confirmation at this point. Silver triggered a bullish trend continuation signal for the long-term uptrend a month ago and has further confirmed strength since then. It is anticipated to continue to progress that uptrend once the current retracement is complete. What is more uncertain is the ending dynamic of the retracement prior to a bull reversal that takes silver back to test recent highs.
Read Full Story »»»
DiscoverGold
Silver Continues to Look Dangerous
By: Christopher Lewis | June 10, 2024
• The silver market bounced a bit in the early hours of Monday, as the market continues to see a lot of questions being asked about the Federal Reserve and its monetary policy going forward.
Silver Markets Technical Analysis
Silver rallied a little bit during the early hours on Monday as we continue to see a lot of volatility in what I suspect will continue to be an extraordinarily volatile market. Keep in mind that silver is extraordinarily followed under the best of terms. And at this point in time, we are not in the best of terms when it comes to clarity. The $30 level above should continue to be a little bit of a barrier. So, if we could break above $30, I think that means that the market could really start to take off to the upside.
And with that being the case, breaking above the $30 level allows the market to go looking to the $31.50 level. If we break down from here, then we could have a look at the 50 day EMA, which is just above the $28.50 level, which of course is an area that previously had been significant resistance. So, a bit of market memory should come into play there.
Keep in mind that silver is extraordinarily sensitive to interest rates, and a lot of the selling that we had seen on Friday was due to the jobs number being hotter than anticipated in the United States as people are concerned about whether or not the Federal Reserve will continue to stay tighter for longer, something that’s probably very possible.
That being said, Wednesday has an FOMC meeting, so keep that in mind because it could have a major influence on what happens with silver next. After the beating on Friday, we are still technically bullish. And at this point in time, I think it’s probably a market that you’re looking for buying opportunities but expect a lot of noise for the next couple of days.
Read Full Story »»»
DiscoverGold
Silver $SLV $2.5+ Million Put Seller (Sold to Open)
By: Cheddar Flow | June 10, 2024
• $SLV $2.5M+ Put Seller (Sold to Open)
This whale is looking to collect the premium on these contracts
*At the bid*

Read Full Story »»»
DiscoverGold
Silver $SLV - Panic over Fridays drop in Silver. 60% stretch from 252/MA is normal b4 going hyper extended, here at 48%
By: Sahara | June 9, 2024
• $SILVER $SLV - Panic over Fridays drop in Silver.
Esp after a promising hold-n-turn of the 4Hr 150/MA shown prior. Yet stepping back it's just a blip to a 'Fan-Line' in the 'Bowl'.
60% stretch from 252/MA is normal b4 going hyper extended, here at 48%. Eye the McD for Signal...

Read Full Story »»»
DiscoverGold
Silver $SLV - At the Lwr-Line of that Bull 'Flag'
By: Sahara | June 9, 2024
• ... $SILVER $SLV - At the Lwr-Line of that Bull 'Flag'.
Close to my C-Target into the $28's...

Read Full Story »»»
DiscoverGold
NY Silver COMEX Futures »» Weekly Summary Analysis
By: Marty Armstrong | June 8, 2024
NY Silver COMEX Futures closed today at 29440 and is trading up about 22% for the year from last year's settlement of 24086. Presently, this market has been rising for 3 months going into June reflecting that this has been only still, a bullish reactionary trend.
ECONOMIC CONFIDENCE MODEL CORRELATION
Here in NY Silver COMEX Futures, we do find that this particular market has correlated with our Economic Confidence Model in the past. The Last turning point on the ECM cycle low to line up with this market was 2020 and 2015 and 2001. The Last turning point on the ECM cycle high to line up with this market was 2011 and 1998.
MARKET OVERVIEW
NEAR-TERM OUTLOOK
The NY Silver COMEX Futures has continued to make new historical highs over the course of the rally from 2020 moving into 2024. We have elected four Bullish Reversals to date.
This market remains in a positive position on the weekly to yearly levels of our indicating models. Pay attention to the Monthly level for any serious change in long-term trend ahead.
Solely focusing on only the indicating ranges on the Daily level in the NY Silver COMEX Futures, this market remains moderately bearish position at this time with the overhead resistance beginning at 29505 and support forming below at 27065. The market is trading closer to the resistance level at this time.
On the weekly level, the last important high was established the week of May 20th at 32750, which was up 14 weeks from the low made back during the week of February 12th. We have seen the market drop sharply for the past week penetrating the previous week's low and it closed beneath that low which was 30345. This was a very bearish technical indicator warning that we have a shift in the immediate trend. We are still trading neutral on the Weekly Momentum Indicators and this is a warning that initial support has been breached. This strongly implies we should pay close attention now to the Weekly Bearish Reversals. If we begin to elect Weekly Bearish Reversals, then we are dealing with a more sustainable near-term correction. When we look deeply into the underlying tone of this immediate market, we see it is currently still in a semi neutral posture despite declining from the previous high at 32750 made 2 weeks ago. Still, this market is within our trading envelope which spans between 21068 and 34918. Immediately, this decline from the last high established the week of May 20th has been important closing sharply lower as well. Before, this recent rally exceeded the previous high of 29905 made back during the week of April 8th. That high was likewise part of a bullish trend making higher highs over the week of March 18th. This immediate decline has thus far held the previous low formed at 21975 made the week of February 12th. Only a break of that low would signal a technical reversal of fortune and of course we must watch the Bearish Reversals. Right now, the market is neutral on our weekly Momentum Models warning we have overhead resistance forming and support in the general vacinity of 28185. Additional support is to be found at 26255. Looking at this from a wider perspective, this market has been trading up for the past 5 weeks overall.
INTERMEDIATE-TERM OUTLOOK
YEARLY MOMENTUM MODEL INDICATOR
Our Momentum Models are declining at this time with the previous high made 2021 while the last low formed on 2023. However, this market has rallied in price with the last cyclical high formed on 2021 and thus we have a divergence warning that this market is starting to run out of strength on the upside.
Interestingly, the NY Silver COMEX Futures has been in a bullish phase for the past 7 months since the low established back in October 2023.
Critical support still underlies this market at 24044 and a break of that level on a monthly closing basis would warn that a sustainable decline ahead becomes possible. Immediately, the market is trading within last month's trading range in a neutral position.
DiscoverGold
Silver $SLV - Pushing up from this Lwr 'Flag' Line & 4Hr 150/MA
By: Sahara | June 6, 2024
• $SILVER $SLV - Latest
Pushing up from this Lwr 'Flag' Line & 4Hr 150/MA.
Note the 'Inv H&S' that points to the B/Out Line...

Read Full Story »»»
DiscoverGold
Are Silver Prices on The Verge of a Major Breakout?
By: Phil Carr | June 5, 2024
• With so much hot money chasing the Commodities Supercycle – there is no denying the entire sector presents a hotbed of opportunity for traders looking to achieve extraordinary gains.
Gold and Copper Reach Unprecedented Heights, Silver Set to Follow
After an epic run that has seen Gold and Copper prices set new all-time record highs not once, not twice, but on multiple occasions, so far this year – analysts at GSC Commodity Intelligence have officially dubbed 2024 “The Year of The Metals”.
To quote GSC Commodity Intelligence – “Gold and Copper’s record-breaking run over the last two consecutive quarters in a row has been nothing short of impressive. Never before in history have we seen the metals score multiple all-time highs in such a short space of time”.
While there remains a growing buzz of excitement surrounding Gold and Copper with prices topping $2,450 an ounce and $11,104 per ton respectively, for the first time ever – traders are starting to shift their attention to Silver on rising expectations that the grey metal will be next to hit new record highs.
Silver Shortage Intensifies in 2024 Amidst Surging Industrial Demand
According to the recently released World Silver Survey – 2024 marks the fifth consecutive year of a Silver shortage – with this year in particular being one of the most intense on record.
Silver demand exceeded supply in 2023, resulting in a structural market deficit of over 142 million ounces. The forecast indicates that the annual production shortfall will nearly double to 265 million ounces by the end of 2024, due to surging industrial demand.
Historically, half of the demand for Silver has been industrial and the remaining half has predominantly been investment related. However, in recent years, the balance has shifting in favour of industrial demand, which currently accounts for 64% of the total global demand for Silver. Put another way, that’s a whopping increase of 19% from a year ago.
And this trend shows no sign of slowing down anytime soon.
Catalysts Behind Historic Squeeze in Silver Supply
The major catalysts behind an historic squeeze in Silver supply include the Green Energy Transition, with Solar Energy playing a pivotal role. Alongside unprecedented demand from Artificial Intelligence and the EV sectors – which are undoubtable three of the fastest and biggest growing industries in the world today.
These worsening supply and demand dynamics have sent Silver prices on a parabolic run since October last year, rallying from just under $20 an ounce to a 12-year high of $32.50 an ounce in May – notching up an impressive gain of over 62%, over a seven-month stretch.
Now Silver’s stealth bull run has come out of hiding – the precious metal is making headlines and capturing the world’s attention like never before.
The last time Silver prices broke above $32 an ounce – the precious metal went onto trade at $50 an ounce in the space of 100 days. If this is a leading barometer for predicting the future performance of Silver prices, then this ultimately means one thing.
Higher Silver prices are coming!
Read Full Story »»»
DiscoverGold
Silver $SLV - Hows it looking?
By: Sahara | June 4, 2024
• $SILVER $SLV - Hows it looking?
Well we popped out from the Dn/Trend Channel from 2011, but couldn't hold, and so closed back within. Yet, Line Chart stopped at the Uppr-Parallel, so no false B/Out for me as yet.
'Broadening' Still In-Play (Blue). And view this as a 'Handle'...

Read Full Story »»»
DiscoverGold
Silver Bullish Reaction Signals Potential Trend Strength
By: Bruce Powers | June 3, 2024
• Silver's bullish reaction today avoided a deeper pullback, finding support at 29.79 and potentially signaling the end of the retracement.
Silver dropped below the purple 20-Day MA briefly today before finding support at 29.79 and bouncing back above the opening price. That is a bullish reaction to what could have been the beginning of a deeper pullback. Instead, buyers quickly stepped up and took back control. The pullback completed a second test of support at the 38.2% Fibonacci retracement level (30.04).
Moreover, notice that support was seen around prior resistance from the previous trend high of 29.80 from April 12. That is bullish behavior as the market recognized that price area given the subsequent reaction. It was the most recent previous trend breakout level. Further, today’s low shows price symmetry within a small declining ABCD pattern.

Closing Strong for the Day
Silver is on track to close strong for the day. It is positive for the day and in the top third of the day’s trading range. Since today’s bullish behavior follows an initial bearish breakdown, it might signal the end of the retracement. And sharp moves frequently follow false moves. It may also eventually negate the potential double top that has formed in silver. An upside breakout will next be triggered on a rise above today’s high of 30.81. It will be particularly interesting if the close today completes a bullish hammer candlestick pattern as it is currently looking like it may do so.
Improving Demand as Buyers Step Up
If today’s low ends up being a swing low that leads to higher prices, silver will be indicating improving underlying demand. Notice that the prior pullback successfully tested the 50-Day MA as support after dropping below the 20-Day line. If today’s test of support at the 20-Day is held, it shows support at a higher price level relative to the retracement. This is the type of price action seen when the strength of a trend is improving as it increases the rising slope of the uptrend.
Key Support at Today’s Low of 29.78
Today’s bullish price action gives greater significance to the day’s low. If the low is broken to the downside, following today’s bullish turn, the 50-Day MA at 28.25 becomes more likely to be reached as a deeper retracement kicks in.
Read Full Story »»»
DiscoverGold
Silver Continues to Consolidate in a Huge Range
By: Christopher Lewis | June 3, 2024
• Silver has fallen in the early hours, only to turn around and show signs of strength. With this, the market will continue to consolidate from what the early hours are telling us.
Silver Markets Technical Analysis
Silver initially pulled back just a bit during the trading session on Monday to test the $30 level again, an area that of course is a large, round, psychologically significant figure that will attract a lot of attention. It has held and since then we have rallied somewhat strongly. At this point I do believe you have a scenario where traders will continue to look at each pullback as a potential value play and probably continue to look at an attempt to get to the $32.50 level as a challenge if you will.
If we can break above there then it is likely that we will continue to see the movement to the upside perhaps drag out to the $35 level. Underneath we have a lot of support near the $30 level but we have even more at $28.50 where the 50-day EMA currently resides.
With all of this being said I think you probably have a noisy but somewhat positive outlook on this chart. And I think that you will continue to see this as a scenario where the shorting is impossible and it’s all about trying to find value. Eventually, we will have to pay attention to interest rates in the United States as well as the US dollar in general, that of course has its own influence on this pair and I do think that will continue to be the case. So no interest in shorting, at least not anytime soon, but if we do then I will just look at this $28.50 level as the next opportunity to buy silver.
Read Full Story »»»
DiscoverGold
$Silver has entered the final month of the rally into a 4 year cycle high that is due in late June. The target may be as high as 35.40
By: CyclesFan | June 1, 2024
• $Silver has entered the final month of the rally into a 4 year cycle high that is due in late June. It closed above the upper BB for the 1st time in this cycle. In 2016 and 2020 too it closed above the upper BB 1 month before the high. The target may be as high as 35.40.

Read Full Story »»»
DiscoverGold
NY Silver COMEX Futures »» Weekly Summary Analysis
By: Marty Armstrong | June 1, 2024
NY Silver COMEX Futures closed today at 30440 and is trading up about 26% for the year from last year's settlement of 24086. Presently, this market has been rising for 3 months going into June reflecting that this has been only still, a bullish reactionary trend.
ECONOMIC CONFIDENCE MODEL CORRELATION
Here in NY Silver COMEX Futures, we do find that this particular market has correlated with our Economic Confidence Model in the past. The Last turning point on the ECM cycle low to line up with this market was 2020 and 2015 and 2001. The Last turning point on the ECM cycle high to line up with this market was 2011 and 1998.
MARKET OVERVIEW
NEAR-TERM OUTLOOK
The NY Silver COMEX Futures has continued to make new historical highs over the course of the rally from 2020 moving into 2024. Noticeably, we have elected four Bullish Reversals to date.
This market remains in a positive position on the weekly to yearly levels of our indicating models. Pay attention to the Monthly level for any serious change in long-term trend ahead.
The perspective using the indicating ranges on the Daily level in the NY Silver COMEX Futures, this market remains moderately bullish currently with underlying support beginning at 30235 and overhead resistance forming above at 30555. The market is trading closer to the resistance level at this time.
On the weekly level, the last important high was established the week of May 20th at 32750, which was up 14 weeks from the low made back during the week of February 12th. Afterwards, the market bounced for 14 weeks reaching a high during the week of May 20th at 30235. Since that high, we have been generally trading down to sideways for the past week, which has been a significant move of 7.343% in a reactionary type decline. Nonetheless, the market still has not penetrated that previous low of 21975 as it has fallen back reaching only 30345 which still remains 38.08% above the former low.
When we look deeply into the underlying tone of this immediate market, we see it is currently still in a semi neutral posture despite declining from the previous high at 32750 made 1 week ago. Still, this market is within our trading envelope which spans between 20784 and 34448. The broader perspective, this current rally into the week of May 20th has exceeded the previous high of 29905 made back during the week of April 8th. This immediate decline has thus far held the previous low formed at 21975 made the week of February 12th. Only a break of that low would signal a technical reversal of fortune and of course we must watch the Bearish Reversals.
Right now, the market is above momentum on our weekly models hinting this is still bullish for now as well as trend, long-term trend, and cyclical strength. Looking at this from a wider perspective, this market has been trading up for the past 5 weeks overall.
INTERMEDIATE-TERM OUTLOOK
YEARLY MOMENTUM MODEL INDICATOR
Our Momentum Models are declining at this time with the previous high made 2021 while the last low formed on 2023. However, this market has rallied in price with the last cyclical high formed on 2021 and thus we have a divergence warning that this market is starting to run out of strength on the upside.
Interestingly, the NY Silver COMEX Futures has been in a bullish phase for the past 7 months since the low established back in October 2023.
Critical support still underlies this market at 24044 and a break of that level on a monthly closing basis would warn that a sustainable decline ahead becomes possible. Immediately, the market is trading within last month's trading range in a neutral position.
DiscoverGold
Textbook Double Top on Silver (SLV)
By: Erin Swenlin | May 31, 2024
Gold is struggling, moving mostly sideways. Silver has technically been moving sideways as well, only it has formed a textbook double top chart pattern. Textbook double tops show even tops and a clear confirmation line delineated at the middle of the "M" formation. What is good about these formations is that they give us a minimum downside target.
The downside target is determined by the length of the pattern subtracted from the confirmation line. In the case of Silver, that would bring it down to prior gap support. But remember, this is a "minimum" downside target. It could fall further.
The Price Momentum Oscillator (PMO) has topped for a second time in overbought territory. Stochastics are falling. The technicals are failing on Silver, so we should be prepared for this decline to catch fire.

Conclusion: We have a bearish double top on Silver (SLV) that predicts a minimum downside target around 25.00. Prepare for more downside on SLV.
Read Full Story »»»
DiscoverGold
|
Followers
|
76
|
Posters
|
|
|
Posts (Today)
|
0
|
Posts (Total)
|
3984
|
|
Created
|
07/13/08
|
Type
|
Free
|
| Moderators DiscoverGold | |||
Silver Futures Indexsilver (s |
A Brief History of The Health Support Uses of SilverFor thousands of years silver has been used as a healing agent by civilizations throughout the world. Its medical, preservative and restorative powers can be traced as far back as the ancient Greek and Roman Empires. Long before the development of modern pharmaceuticals, silver was employed as a germicide. Consider these interesting facts:
Silver Re-DiscoveredNot until the late 1800's did western scientists re-discover what had been known for thousands of years - that silver is a powerful germ fighter. Medicinal silver compounds were then developed and silver became commonly used as a medicine. By the early part of the 1900s, the use of silver was becoming widespread. By 1940 there were approximately four dozen different silver compounds on the market. Although there were a few flare-ups of negative publicity regarding medicinal silver in the early 1900s, (due to the overuse of certain types of protein-bound silver compounds causing a discoloration of the skin called argyria and due to a supply of improperly prepared and unstable silver) reputable medical journal reports demonstrated that a properly prepared colloidal dispersion of silver was completely suitable with no adverse side effects. T. H. Anderson Wells reported in the Lancet (February 16th, 1918) that a preparation of colloidal silver was "used intravenously. . . without any irritation of the kidneys and with no pigmentation of the skin. " New knowledge of body chemistry gave rise to the enormous array of applications for colloidal disinfectants and medicines and for on-going research into the capabilities and possibilities for silver colloids. However, Silver's "new-found" fame as a superior infection-fighting agent was short lived. How Silver Lost FavorDuring the 1930s, synthetically manufactured drugs began to make their appearance and the profits, together with the simplicities of manufacturing this new source of treatment, became a powerful force in the marketplace. There was much excitement over the new 'wonder drugs' and at that time, no antibiotic-resistant strains of disease organisms had surfaced. Silver quickly lost its status to modern antibiotics. On-going Uses of Colloidal SilverThe use of some silver preparations in mainstream medicine survived. Among them are the use of dilute silver nitrate in newborn babies' eyes to protect from infection and the use of "Silvadine," a silver based salve, in virtually every burn ward in America to kill infection. A new silver based bandage has recently been approved by the FDA and licensed for sale. Other uses that did not lose favor include:
But for the most part, with the discovery of pharmaceutical antibiotics, interest in silver as an anti-microbial agent declined almost to the point of extinction. The Resurgence of Silver in MedicineThe return of silver to conventional medicine began in the 1970s. The late Dr. Carl Moyer, chairman of Washington University's Department of Surgery, received a grant to develop better methods of treatment for burn victims. Dr. Margraf, as the chief biochemist, worked with Dr. Moyer and other surgeons to find an antiseptic strong enough, yet safe to use over large areas of the body. Dr. Margraf investigated 22 antiseptic compounds and found drawbacks in all of them. Reviewing earlier medical literature, Dr. Margraf found continual references to the use of silver. However, since concentrated silver nitrate is both corrosive and painful, he diluted the silver to a .5 percent solution and found that it killed invasive burn bacteria and permitted wounds to heal. Importantly, resistant strains did not appear. But, silver nitrate was far from ideal. So research continued for more suitable silver preparations. Silver sulphadiazine (Silvadene, Marion Laboratories) is now used in 70 percent of burn centers in America. Discovered by Dr. Charles Fox of Columbia University, sulphadiazine has also been successful in treating cholera, malaria and syphilis. It also stops the herpes virus, which is responsible for cold sores, shingles and worse. The history and uses of colloidal silver are well known and documented. They can be researched easily on the Internet through search engines and any colloid forum, bulletin boards or blogs. We cannot link to them or publish them here because Federal Law prohibits any claims or testimonials associating our products or product ingredients with any disease states. Keep in mind that the particle surface area of our colloidal silver product, MesoSilver, is the highest ever tested. This means it is the most effective of any colloidal silver product ever made. With not a single serious adverse event ever reported, it is also one of the safest supplements on the market today.
|

SILVER IN DEPTHSilver links from LinksMine - InfoMine's Library of Mining Web Sites Site Listings
Associations
Exploration
History
Investment
Publications
Please boardmark us if this i-Message is helpful... Thanks in advance!!!Presently, the Board has 70 Boardmarks, Thank you! |
The Silver Price Will Rise 4.83 Times as Far as Gold Pricehttp://goldprice.org/silver-and-gold-prices/2008/12/silver-price-will-rise-483-times-as-far.html Unless you understand this one principle, you understand nought about precious metals' bull markets: monetary demand, and monetary demand alone, drives both gold AND silver. It's not Indian wedding demand or the popularity of silver jewelry that drives their prices, but sheer monetary demand, holding them as "money" because the alternatives -- national currencies -- are clearly failing. WHEREFORE, before this bull market ends, you will need only 16 ounces of silver to buy one ounce of gold, which means from here that the silver price will rise 4.83 times as far as the gold price. Forget the siren song of the "gold-only" bugs, who have fallen for the myths of the money interest: both silver and gold are money, and always will be. GOLD ENTERING A VIRTUOUS CIRCLESeptember 3rd, 2010 by Egon von Greyerz GOLD ENTERING A VIRTUOUS CIRCLEFundamental and technical factors for gold are now in total harmony and gold is entering a virtuous circle that will drive the price up at its fastest pace since this bull market started in 1999.
Gold trendWe expect gold to start a substantial rise now which will continue for 5-10 months before any major correction. Gold's technical picture is extremely strong with a continuous rising pattern of higher highs and higher lows with the steepness of the curve increasing. From much higher levels we are likely to see a correction that could last up to a year before the next rise which will last several years before we see a significant peak. Once gold has topped we do not expect the same kind of decline as after the 1980 peak since gold is likely to become part of a future reserve currency. At that point gold will be a solid but unexciting investment with very little upside potential. But that is likely to be a few years away. In spite of a 5 times increase in the value of gold or an 80% decline against many currencies and stockmarkets in the last 11 years, most investors own no gold and still do not understand the importance and value of gold. In a world of constant money printing and credit creation leading to devaluing currencies and devaluing assets, gold reflects stability and is virtually the only store of value that cannot be destroyed by governments. The average asset manager, fund manager, pension fund or private individual owns no physical gold and at best has a very small exposure to some precious metals stocks. And in spite of this gold has gone up over 400% in 11 years. How is that possible? For the simple reason with the relatively modest demand that we have seen in the last few years, there is not enough physical gold even at these levels. The increase in demand that we have seen has most probably been satisfied by central banks leasing or lending their gold to the bullion banks. Central banks supposedly own 30,000 tons of gold but unofficial estimates of their real holdings are at 15,000 tons or less. So what are the factors that are likely to lead to a major rise in the gold price? We have for several years outlined in our Newsletters the problems in the world that inevitably will lead to massive money printing and a hyperinflationary depression (see for example "Alea Iacta Est" and "There Will Be No Double Dip…" on the Matterhorn Asset Management website). There are three insurmountable problems:
The effect of this massive $20 trillion infusion has been ephemeral since we are entering the autumn of 2010 with virtually every single economic indicator and statistic in the US deteriorating rapidly. With interest rates already at zero there is no ammunition left but one. And it is this specific last bullet that will be used to infinity in the next few years and starting very soon, namely UNLIMITED MONEY PRINTING. Every single area of the US economy will need support or printed money, whether it is the federal government, the states, the municipalities, banks, pension funds, insurance companies, the unemployed, corporations, health care, housing market, commercial real estate, individuals, etc, etc, etc. The list is endless and many other countries will follow. Before we talk about gold in hyperinflationary terms, let's look at where gold is likely to reach in today's money. Three realistic Gold targets: $6,000 - $7,000 - $10,000:
The three historical comparisons above (and see chart below) would put gold anywhere from $6,000 to $10,000 and this is without inflation, or more likely hyperinflation. In a hyperinflationary environment, the price gold will go to is really irrelevant since it depends on how much money is printed. In the Weimar Republic for example gold went to DM 100 trillion. What is more important is that gold is likely to go up at least 5 times from today without inflation and with hyperinflation gold will protect investors against the total destruction of paper money and many other assets.
Wealth ProtectionGold must only be held in its physical form and the holder of gold must have direct access to the gold. We consider ETFs, gold in a bank (whether allocated or unallocated), fractal ownership of physical gold, futures or any other form of paper gold as very risky and a totally unsatisfactory method for owning gold. Physical gold should preferably be stored outside your country of residence and outside the banking system. The holder must have direct access to the vaults where the gold is stored. SilverSilver has been lagging gold since its peak at over $21 in 2008. For the last few months the gold/silver ratio has been consolidating between 58 and 71. The ratio is currently around 64 and is likely to start a move down to new lows below the 2006 low at just 44. So this is very good news for silver which is likely to outpace gold substantially in the next few years. Silver is probably the most undervalued precious metal today and has great potential. But there are many caveats for silver:
StockmarketsAt the beginning of July this year we sent out a message to investors that, based on our proprietary indicators, we expected stockmarkets to finish the correction up at the end of July and resume the major downtrend in August. We also said that gold would start its major rise in August. And this is exactly what has happened so far. We now expect major falls in all stockmarkets worldwide over a sustained period. We would not be surprised to see the Dow down to the 1,000 area (in today's terms) before this bear market in over. But it will not be a straight line and there will be extreme volatility. When hyperinflation sets in, stockmarkets will have a major but temporary surge. The only stocks that investors should hold are precious metals stocks and possibly some resource and food stocks. But it must be remembered that stocks do not represent the same degree of wealth preservation as physical precious metals held directly by the investor. CurrenciesCurrencies should in the next few years be looked upon as a necessary evil and not as a store of value. All currencies will continue to decline against gold, just as they have in the last 11 years and in the last 100 years. Due to money printing by most governments, we will have a fierce game of competitive devaluations by virtually all central banks. We have seen the Euro and the pound weaken substantially and the next currency the speculators will jump on is the US dollar. The dollar is grossly overvalued, partly due to the weak Euro, and is likely to weaken significantly due to the problems in the US economy. Currencies only reflect relative value and not absolute value since they can be and are printed until they reach their intrinsic value of zero. It is a fallacy to measure the value of a currency relative to another currency since they are all losing value. Currencies should only be measured against real money which is gold. This is the only method that reveals governments' deceitful actions in destroying the value of paper money. Therefore it is a mug's game to speculate or invest in currencies since they will all decline in an extremely volatile and unpredictable market. So are there currencies which are likely to perform better on a relative basis for funds that have to be held in paper money? We believe that Norwegian kroner, Swiss Franc, Canadian Dollar, Singapore Dollar, Australian Dollar and Renminbi will perform relatively better than many other currencies. Government Bond MarketsThe bond market is the biggest bubble in financial markets worldwide, in our opinion. Investors around the world are worried about the state of financial markets and therefore believe that government bonds represent a safe haven. These investors will receive the most enormous shock on two accounts. Firstly, no government will be able to repay the debts outstanding. So there will either be government defaults, moratoria, or money printing that totally destroys the value of the bonds. Secondly, interest rates are likely to go up significantly to at least 10-15%, totally destroying the value of the bonds. ConclusionWe are now entering a period when most major asset classes and in particular stocks, bonds and currencies are starting a major decline. Since most financial assets in the world are invested in these three categories plus real estate which will also decline, we are likely to experience major shocks and crises in the financial system and the world economy. Wealth protection is now more important than probably at any other time in history. Physical gold and possibly other precious metals directly controlled by the investor will be a vital part of a wealth preservation portfolio. |
http://bullion.nwtmint.com/silver.php
http://stockcharts.com/h-sc/ui?s=%24SILVER&p=D&yr=0&mn=3&dy=0&id=p43555958479
| Volume | |
| Day Range: | |
| Bid Price | |
| Ask Price | |
| Last Trade Time: |


 l
l v
v r)
r)

