 News
News  Market Data
  Discover
Support: 888-992-3836
Copyright © 2023 InvestorsHub Inc.


Register for free to join our community of investors and share your ideas. You will also get access to streaming quotes, interactive charts, trades, portfolio, live options flow and more tools.
Daily Candlestick Chart for DATA
[img]stockcharts.com/c-sc/sc?s=DATA
Asset: An item that has exchange value.

Bearish Divergence:
A situation when price records a higher high and the indicator forms a lower high. The indicator does not confirm the higher high in prices and this could foreshadow a reversal. Divergences are most common with momentum oscillators

$HOMJF BarChart Trader's Cheat Sheet
http://www.barchart.com/cheatsheet.php?sym=HOMJF
Daily Candlestick Chart for KKPT
[img]stockcharts.com/c-sc/sc?s=KKPT
Carry Trade: The Carry Trade is a trading strategy where investors/traders sell or borrow assets (such as currencies) with lower yielding interest rates to fund or buy higher yielding assets.
In the Foreign exchange, interest is debited or credit from a trader's account everyday on open positions.
The most popular Carry Trade in recent history has been to sell Japanese Yen and buy higher yielding currencies such as the Australian Dollar, New Zealand Dollar, and British Pound.
For example, if you buy the AUD/JPY, then you sell Japanese Yen (which yields 0.00% a year)and buy an equivalent amount of Australian Dollars (which yields 3.50% a year) simultaneously. So, for as long as you hold that position you would pay 0.00% interest a year for borrowing Japanese Yen, and receive 3.50% a year for holding Australian Dollars.
The interest rate differential of that position is 3.50 (3.50% - 0.00%). So you would receive approximately 3.50% a year on the value of the position, depending on the margin interest charged by the broker and on exchange rate volatility.
Volatility (Implied):
A key variable in most option pricing models, including the famous Black-Scholes Option Pricing Model. Other variables usually include: security price, strike price, risk-free rate of return and days to expiration. If all other variables are equal, the security with the highest volatility will have the highest option prices. Many Nasdaq and tech stocks (CSCO and AMGN) have higher volatilities than NYSE and non-tech stocks (G and MRK), and their options are also priced accordingly. One method of measuring volatility is by finding the standard deviation of the underlying security. However, the standard deviation cannot always explain the volatility that is implied by an options price. Many times the price of an option will reflect more volatility than that measured by the standard deviation. This led to the notion of implied volatility, which is based on option prices. If the option price is known, then plugging in all variables and solving for volatility will yield the implied volatility.
Daily Candlestick Chart for DKGR
[img]stockcharts.com/c-sc/sc?s=DKGR
Bank of Japan (BOJ) Monetary Policy Meeting and Announcement: Release schedule : No set time, usually between 2:00 and 4:00 (GMT); monthly, in the middle of the month
Source of report : Bank of Japan
Web Address : http://www.boj.or.jp/en/index.htm
Address of Release : http://www.boj.or.jp/en/theme/seisaku/kettei/index.htm
Schedule of Meetings : http://www.boj.or.jp/en/theme/seisaku/index.htm
$SNTL BarChart Trader's Cheat Sheet
http://www.barchart.com/cheatsheet.php?sym=SNTL
Logarithmic (Percentage) Scaling: On a logarithmic scale chart, the vertical spacing between two points corresponds to the percentage change between those numbers. Thus, on a log scale chart, the vertical distance between 10 and 20 (a 100% increase) is the same as the vertical distance between 50 and 100. Because these charts show percentage relationships, logarithmic scaling is also called percentage scaling. It is also called semi-log scaling because only one of the axes (the vertical one) is scaled logarithmically.
Advance/Decline Index: A tool used confirm that a trend is continuing. If there are more declining issues, the trend might see a reversal in the near future. The Advance/Decline Index is calculated by subtracting the number of declining prices from the number of advancing security prices.
Daily Candlestick Chart for MPIX
[img]stockcharts.com/c-sc/sc?s=MPIX
$FXPT BarChart Trader's Cheat Sheet
http://www.barchart.com/cheatsheet.php?sym=FXPT
Daily Candlestick Chart for PLSB
[img]stockcharts.com/c-sc/sc?s=PLSB
Carbon Credits: Carbon credits pertains to the right to emit a certain volume of greenhouse gases. The current measure is that one ton of C02 (or C02 equivalent gases) is equal to one carbon credit. To encourage businesses and companies to minimize their emission of greenhouse gases, they can exchange, buy, and sell carbon credits in the international market
$FOUR BarChart Trader's Cheat Sheet
http://www.barchart.com/cheatsheet.php?sym=FOUR
Austerity: Austerity refers to the government's reduction of spending in order to lower their deficit. Austerity measures, which usually involve wage cuts and tax hikes, are implemented by the government to ensure their creditors that they will be able to pay back their loans.
Daily Candlestick Chart for INAR
[img]stockcharts.com/c-sc/sc?s=INAR
$ELAY BarChart Trader's Cheat Sheet
http://www.barchart.com/cheatsheet.php?sym=ELAY
Analyst: When analyzing the market, analysts can generally be divided into two camps - fundamentals and technicals.
Fundamental analysts are those who mainly look at the fundamental aspects of an economy in forming their opinions. They stay on top of the markets by reading and analyzing what the current economic data say about current market conditions, what is fundamentally driving the market, and where it's headed.
Technical analysts are those who primarily rely on chart indicators and patterns to help predict where price will move next. Some tools that technical analysts use are Fibonacci retracement, candlesticks and momentum indicators.
Daily Candlestick Chart for GLTV
[img]stockcharts.com/c-sc/sc?s=GLTV
$LIGA BarChart Trader's Cheat Sheet
http://www.barchart.com/cheatsheet.php?sym=LIGA
Ask price: The price at which the market sells a currency. The trader can buy the base currency at this price.
Daily Candlestick Chart for BMSN
[img]stockcharts.com/c-sc/sc?s=BMSN
$LUNL BarChart Trader's Cheat Sheet
http://www.barchart.com/cheatsheet.php?sym=LUNL
Divergence: Divergence is a trading pattern in which the relationship between price action and an oscillator indicator is measured.
If the price begins to move in a negative correlation to an indicator, (ie. higher "highs" in price, but lower "highs" in indicator), it could be viewed as a leading indicator for a potential change in price direction.
$BNIKF BarChart Trader's Cheat Sheet
http://www.barchart.com/cheatsheet.php?sym=BNIKF
Dovish: Refers to the tone of language when describing a non-aggressive stance or viewpoint regarding a specific economic event or action. It’s often used when describing the economy or interest rates of a country.
Central bankers are described as "dovish" because they generally favor economic growth and employment over tightening interest rates.
Opposite of Hawkish (hawk).
$IVFH BarChart Trader's Cheat Sheet
http://www.barchart.com/cheatsheet.php?sym=IVFH
$PUBNF BarChart Trader's Cheat Sheet
http://www.barchart.com/cheatsheet.php?sym=PUBNF
2. Regulatory risk (Risks Associated with ETF’s)
Synthetic ETFs are attracting regulatory attention from the FSB, [52] the IMF, [53] and the BIS. [54] Areas of concern include the lack of transparency in products and increasing complexity; conflicts of interest; and lack of regulatory compliance.

BULLISH HOMING PIGEON
Bullish Homing Pigeon Pattern is a small black real body contained by a prior relatively long black real body.
Recognition Criteria:
1. Market is in downtrend.
2. We see a black body in the first day.
3. Then we again see a black body in the second day where the real body of this second day is completely engulfed by the real body of the first day. It is not required that the shadows (high/low) of the second candlestick are contained within the first, though it's preferable if they are.
Explanation:
The Bullish Homing Pigeon Pattern is a signal of disparity. In a market characterized by downtrend, we first see heavy selling reflected by the long, black real body of the first day. However small body of second day points out to diminished power and enthusiasm of the sellers thus suggesting a trend reversal.
Important Factors:
The important fact about this pattern is the requirement that the second day has a minute real body relative to the prior candlestick and that this small body is completely contained by the larger one. The Bullish Homing Pigeon Pattern is not necessarily a signal for a rally. Market usually has a tendency to enter into a congestion phase following a Homing Pigeon.
We must check the third day to confirm that the downtrend has reversed. This confirmation may be in the form of a white candlestick, a large gap up or a higher close on the next trading day (on the third day).
Definitions For The Fifth Letter Of Ticker Symbols
Have you ever wondered what that fifth letter at the end of the stock symbol is? It signifies that the issuer may have additional circumstances involved with the stock. Most recognizable is the infamous "E".
Complete "Letter" list enclosed below. You may want to print it out for your own reference.
The Eligibility Rule protects investors by ensuring that they have access to companies current financial information when considering investments in OTCBB-eligible securities.
Nasdaq will continue to monitor the filing status of all OTCBB issuers. In the event of a filing delinquency, Nasdaq will append the trading symbol(s) of the delinquent issuer's security with an "E". The fifth character "E" will be removed from the symbol once Nasdaq receives notification that the security meets the requirements of the Eligibility Rule. After 30 days (60 days for non-SEC filers), if Nasdaq has not been notified that the appropriate filing has been made with the issuer's regulatory authority, the issuer's security will be removed from the OTCBB.
Code: Meaning
A: Class A.
B: Class B.
C: Exempt from Nasdaq listing requirements for a limited period of time.
D: A new issue of an existing stock. (Often the result of a reverse split.)
E: Delinquent in required filings with the SEC as determined by the NASD.
F: Foreign.
G: First Convertible Bond.
H: Second Convertible Bond, same company.
I: Third Convertible Bond, same company.
J: Voting.
K Non-voting.
L: Miscellaneous situations such as foreign preferred, preferred when-issued, a second class of units, a third class of warrants, or a sixth class of preferred stock.
M: Fourth preferred, same company.
N: Third preferred, same company.
O: Second preferred, same company.
P: First preferred.
Q: In bankruptcy proceedings.
R: Rights.
S: Beneficial interest.
T: With warrants or with rights.
U: Units.
V: When-issued and when-distributed.
W: Warrants.
X: Mutual Fund.
Y: ADR (American Depositary Receipts).
Z: Miscellaneous situations such as a second class of warrants, a fifth class of preferred stock, a stub, a foreign preferred when-issued, or any unit, receipt, or certificate representing a limited partnership interest."
Walking the Bands
Moves above or below the bands are not signals as such. As Bollinger puts it, moves that touch or exceed the bands are not signals, but rather "tags". On the face of it, a move to the upper band shows strength, while a sharp move to the lower band shows weakness. Momentum oscillators work much the same way. Overbought is not necessarily bullish. It takes strength to reach overbought levels and overbought conditions can extend in a strong uptrend. Similarly, prices can "walk the band" with numerous touches during a strong uptrend. Think about it for a moment. The upper band is 2 standard deviations above the 20-period simple moving average. It takes a pretty strong price move to exceed this upper band. An upper band touch that occurs after a Bollinger Band confirmed W-Bottom would signal the start of an uptrend. Just as a strong uptrend produces numerous upper band tags, it is also common for prices to never reach the lower band during an uptrend. The 20-day SMA sometimes acts as support. In fact, dips below the 20-day SMA sometimes provide buying opportunities before the next tag of the upper band.

The chart above shows Air Products (APD) with a surge and close above the upper band in mid July. First, notice that this is a strong surge that broke above two resistance levels. A strong upward thrust is a sign of strength, not weakness. Trading turned flat in August and the 20-day SMA moved sideways. The Bollinger Bands narrowed, but APD did not close below the lower band. Prices, and the 20-day SMA, turned up in September. Overall, APD closed above the upper band at least five times over a four month period. The indicator window shows the 10-period Commodity Channel Index (CCI). Dips below -100 are deemed oversold and moves back above -100 signal the start of an oversold bounce (green dotted line). The upper band tag and breakout started the uptrend. CCI then identified tradable pullbacks with dips below -100. This is an example of combining Bollinger Bands with a momentum oscillator for trading signals.
WHITE SPINNING TOP
The White Spinning Top is a single candlestick pattern. Its shape is a small white body with upper and lower shadows that have a greater length than the body's length.
Recognition Criteria:
1. The real body of the pattern is white and small.
2. The upper and lower shadows are longer than the real body's length.
Explanation:
The market moves higher and then sharply lower, or vice versa. It then closes above the opening price creating a white body. This represents complete indecision between the bulls and the bears. The actual length of the shadows is not important. The small body relative to the shadows is what makes the spinning top.
Important Factors:
If a White Spinning Top is observed after a long rally or a long white candlestick, this implies weakness among the bulls and it is a warning about a potential change or interruption in trend.
If a White Spinning Top is observed after a long decline or a long black candlestick, this implies weakness among the bears and it is a warning about a potential change or interruption in trend.
Like most other single candlestick patterns, the White Spinning Top has low reliability. It reflects only one day's trading and can be interpreted both as a continuation and a reversal pattern. This candlestick needs to be used with other candlesticks for a healthier confirmation of a trend.
Form TA-2 ~ SEC Filings Explained
Annual report of transfer agent activities filed pursuant to the Securities Exchange Act of 1934
THREE INSIDE UP (Bullish)
The Bullish Three Inside Up Pattern is another name for the Confirmed Bullish Harami Pattern. The third day is confirmation of the bullish trend reversal.
Recognition Criteria:
1. Market is characterized by downtrend.
2. We see a Bullish Harami Pattern in the first two days.
3. Then we see a white candlestick on the third day with a higher close than the second day.
Explanation:
The first two days of this pattern is simply the Bullish Harami Pattern, and the third day confirms the reversal suggested by the Bullish Harami Pattern, since it is a white candlestick closing with a new high for the last three days.
Important Factors:
The reliability of this pattern is very high, but still a confirmation in the form of a white candlestick with a higher close or a gap-up is suggested.
SEC Filings Explained ~ Rule 144
On December 6, 2007, the SEC published final rules revising Rule 144 under the Securities Act of 1933, which regulates the resale of restricted securities and securities held by affiliates. The amendments to Rule 144, among other things:
1. Shorten the holding period for affiliate and non-affiliate holders of restricted securities of SEC-reporting companies to six months, subject to certain conditions
2. Permit unlimited resale by non-affiliate holders of restricted securities by complying only with the current public information condition for resale of restricted securities issued by SEC reporting companies made after the six-month holding period; and without complying with any Rule 144 conditions for resale of restricted securities issued by both SEC reporting and non-reporting companies made after a one-year holding period.
3. permit resale of equity securities by affiliates that meet certain conditions through riskless principal transactions and brokers’ transactions in which the broker has published bid and asked quotations for the security in an alternative trading system.
4. Eliminate the manner of sale conditions and ease the volume limitations for resale of debt securities by affiliates.
5. Increase the thresholds that trigger the Form 144 filing requirement to 5,000 shares or $50,000.
The SEC did not adopt previously proposed provisions relating to the tolling of holding periods in connection with hedging transactions.
The amendments will become effective on February 15, 2008, and will apply to securities acquired before or after that date. Background
Rule 144 regulates the resale of “restricted securities”1 and “control securities,”2 by establishing certain conditions that must be satisfied in order for the resale to be exempt from the Securities Act registration requirements pursuant to Section 4(1) of the Securities Act—a safe harbor from “underwriter” status for the selling security holder.
The conditions include the following:
? There must be adequate current public information available about the issuer;
? If the securities being sold are restricted securities, the security holder must have held the security for a specified holding period;
? The resale must be within specified sales volume limitations;
? The resale must comply with the manner of sale requirements of the rule; and
? The selling security holder must file Form 144 with the SEC if the amount of securities being sold exceeds specified thresholds.
Amendments to Conditions for Resale of Restricted Securities
Restricted Securities of SEC-Reporting Companies. The SEC has reduced the holding period under Rule 144 for restricted securities of SEC-reporting companies held by both affiliates and non-affiliates from one year to six months. Affiliate holders of reporting company securities may now resell their restricted securities after six months, subject to the other Rule 144 requirements. Non-affiliate holders of reporting company securities (who have also not been affiliates during the prior three months) may now resell their restricted securities held between six months and one year subject only to Rule 144’s current public information requirement. Any such resale by a non-affiliate after one year will be exempt from all Rule 144 requirements.
Restricted Securities of Non-Reporting Companies. There is still a one-year holding period for affiliate and non-affiliate holders of restricted securities in non-reporting companies under amended Rule 144. After the one-year holding period, non-affiliates may now resell their restricted securities without having to comply with any other Rule 144 requirements; affiliates seeking to resell their restricted securities must still meet all Rule 144 requirements.
The manner of sale requirements of Rule 144 require securities to be sold in “brokers’ transactions” or in transactions directly with a “market maker.”
The rule includes restrictions on (1) soliciting or arranging for the solicitation of orders to buy the securities in anticipation of, or in connection with, the Rule 144 transaction or (2) making any payment in connection with the offer or sale of the securities to any person other than the broker who executes the order to sell the securities.
The SEC amended these rules to also permit the resale of restricted equity securities by affiliates through riskless principal transactions in which trades are executed at the same price, exclusive of any explicitly disclosed markup or markdown, commission equivalent or other fee, and the rules for a self-regulatory organization permit the transaction to be reported as riskless.3 The amended rule also expands the definition of a “brokers’ transaction” for purposes of such resale by permitting a broker to insert bid and ask quotations for the security in an alternative trading system, provided that the broker has published bona fide bid and ask quotations for such security on each of the last 12 business days. Resale of Restricted Debt Securities The SEC has eliminated the manner-of-sale requirements for affiliate resale of debt securities, including non-participatory preferred stock (which has debt-like characteristics) and asset-backed securities. The SEC also raised the volume limitations for the resale of debt securities to permit resale in an amount that does not exceed ten percent of a tranche (or a class with respect to non-participatory preferred stock), together with all sales of securities of the same tranche sold for the selling debt security holder within a three-month period. Form 144 Filing Triggers
The sales thresholds for filing Form 144 have been increased from 500 shares or $10,000 worth of securities to 5,000 shares or $50,000. Codified
SEC Staff Interpretations
The SEC has also codified various staff interpretations relating to Rule 144, including the following:
1. Stating that securities acquired by accredited investors pursuant to Section 4(6) of the Securities Act are considered restricted securities
2. Permitting tacking of holding periods when a company reorganizes into a holding company structure
3. Permitting tacking of holding periods for conversions and exchanges of securities
4. Deeming the acquisition dates for securities acquired pursuant to the cashless exercise of options and warrants as the dates the options or warrants were acquired
5. Permitting a pledgee of restricted securities to sell the pledged securities without having to aggregate the sale with sales by other pledgees from the same pledgor (as long as there is no concerted action by those pledgees), for purposes of the Rule 144 volume limitation condition
6. Permitting the Form 144 representations required from security holders relying on Exchange Act Rule 10b5-1 to be made as of the date the holder adopted a trading plan or gave trading instructions
7. Confirming the unavailability of Rule 144 for the resale of securities by reporting and non-reporting firms
M-Tops Using Bollinger Bands
M-Tops were also part of Arthur Merrill's work that identified 16 patterns with a basic M shape. Bollinger uses these various M patterns with Bollinger Bands to identify M Bottoms. According to Bollinger, tops are usually more complicated and drawn out than bottoms. Double tops, head-and-shoulders patterns and diamonds represent evolving tops.
In its most basic form, an M-Top is similar to a double top. However, the reaction highs are not always equal. The first high can be higher or lower than the second high. Bollinger suggests looking for signs of non-confirmation when a security is making new highs. This is basically the opposite of the W-Bottom. A non-confirmation occurs with three steps. First, a security forges a reaction high above the upper band. Second, there is a pullback towards the middle band. Third, prices move above the prior high, but fail to reach the upper band. This is a warning sign. The inability of the second reaction high to reach the upper band shows waning momentum, which can foreshadow a trend reversal. Final confirmation comes with a support break or bearish indicator signal.

The chart shows Exxon Mobil (XOM) with an M-Top in April-May 2008. The stock moved above the upper band in April. There was a pullback in May and then another push above 90. Even though the stock moved above the upper band on an intraday basis, it did not CLOSE above the upper band. The M-Top was confirmed with a support break two weeks later. Also notice that MACD formed a bearish divergence and moved below its signal line for confirmation.
Abandoned Baby (Bullish)

• Direction: Bullish
• Type: Reversal
• Reliability: Strong
• Day-one is a red day continuing an established bear trend.
• Day-two is a doji whose shadows trades below day-ones close.
• Day-three is a blue day that opens and trades above with little or no overlapping shadows
The Abandoned Baby is a rare bullish reversal pattern characterized by a large down move followed by a doji or small candle, and then a third candle heading in the opposite direction.
The formation reflects a classic three period reversal of market sentiment where after a bearish trend, finally enough buyers enter the market to take control. They first stop the trend's momentum (forming the doji), and then ultimately reverse the direction of the market.
This first red candle suggests a continuation of the bear market. That move is followed by a doji, where markets trade in a small range suggesting uncertainty in trend and a rally potential. Up to day two we actually have a Bullish Doji Star, moderate strength bullish pattern. After the day of indecision, a large bullish candle confirms buyers are staging a rally and reversal. The stronger the move up day-three, the stronger the reversal signal. Watch for additional bullish price action in the next few days.
Trend Identification Using Moving Averages
The same signals can be generated using simple or exponential moving averages. As noted above, the preference depends on each individual. These examples below will use both simple and exponential moving averages. The term "moving average" applies to both simple and exponential moving averages.
The direction of the moving average conveys important information about prices. A rising moving average shows that prices are generally increasing. A falling moving average indicates that prices, on average, are falling. A rising long-term moving average reflects a long-term uptrend. A falling long-term moving average reflects a long-term downtrend.

The chart above shows 3M (MMM) with a 150-day exponential moving average. This example shows just how well moving averages work when the trend is strong. The 150-day EMA turned down in November 2007 and again in January 2008. Notice that it took a 15% decline to reverse the direction of this moving average. These lagging indicators identify trend reversals as they occur (at best) or after they occur (at worst). MMM continued lower into March 2009 and then surged 40-50%. Notice that the 150-day EMA did not turn up until after this surge. Once it did, however, MMM continued higher the next 12 months. Moving averages work brilliantly in strong trends.
Form 15F-15D, 15F-15D/A ~ SEC Filings Explained
Notice of a foreign private issuers suspension of duty to file reports pursuant to Section 13 and 15(d) of the Act (and amendment thereto)
Price Crossovers using Moving Averages
Moving averages can also be used to generate signals with simple price crossovers. A bullish signal is generated when prices move above the moving average. A bearish signal is generated when prices move below the moving average. Price crossovers can be combined to trade within the bigger trend. The longer moving average sets the tone for the bigger trend and the shorter moving average is used to generate the signals. One would look for bullish price crosses only when prices are already above the longer moving average. This would be trading in harmony with the bigger trend. For example, if price is above the 200-day moving average, chartists would only focus on signals when price moves above the 50-day moving average. Obviously, a move below the 50-day moving average would precede such a signal, but such bearish crosses would be ignored because the bigger trend is up. A bearish cross would simply suggest a pullback within a bigger uptrend. A cross back above the 50-day moving average would signal an upturn in prices and continuation of the bigger uptrend.
The next chart shows Emerson Electric (EMR) with the 50-day EMA and 200-day EMA. The stock moved above and held above the 200-day moving average in August. There were dips below the 50-day EMA in early November and again in early February. Prices quickly moved back above the 50-day EMA to provide bullish signals (green arrows) in harmony with the bigger uptrend. MACD(1,50,1) is shown in the indicator window to confirm price crosses above or below the 50-day EMA. The 1-day EMA equals the closing price. MACD(1,50,1) is positive when the close is above the 50-day EMA and negative when the close is below the 50-day EMA.

SPDRs
Usually referred to as spiders, these investment instruments bundle the benchmark S
UPSIDE GAP TWO CROWS
The Bearish Upside Gap Two Crows Pattern is a three-candlestick pattern and it signals a top reversal. The first candlestick is a long white candlestick followed by a real body that gaps higher. Then another black real body appears, which opens above the second day’s open and closes under the second day’s close, completing the pattern
Recognition Criteria:
1. Market is characterized by uptrend.
2. We see a long white candlestick in the first day that signals the continuation of uptrend.
3. Then we see a black body with a gap up on second day.
4. The third day is characterized by another black candlestick having an opening above the first black day and also closing below the body of the first black day. The body of third day engulfs the body of the first day.
5. The close of the second black candlestick is still above the close of the first long white candlestick.
Explanation:
The market is in an uptrend and it displays a higher opening with a gap. However the new highs of the day cannot hold and the market forms a black candlestick. However the bulls still comfort themselves by the fact that the close on this black candlestick day is still above the prior day’s close. The third day however increases the bearish sentiment displaying another new high but failing to hold these highs until the close. Also the day closes below the prior day’s close, which is another bearish sign. . So the following question becomes relevant. If the market is so strong, why the new highs fail to hold and why market closes lower? The answer is clear. Market is not now as strong as the bulls would like to believe.
Form 8-K~ SEC Filings Explained
Form 8-K is a very broad form used to notify investors of any material event that is important to shareholders or the United States Securities and Exchange Commission. This is one of the most common types of forms filed with the SEC. After a significant event like bankruptcy or departure of a CEO, a public company generally must file a Current Report on Form 8-K within four business days to provide an update to previously filed quarterly reports on Form 10-Qand/or Annual Reports on Form 10-K. Form 8-K is required to be filed by public companies with the SEC pursuant to the Securities Exchange Act of 1934, as amended. For a list of events that would trigger a Form 8-K to be filed, see the Official SEC Form 8-K Summary, reproduced below.
When Form 8-K is required
Form 8-K is used to notify investors of a current event. These types of events include:
? Material definitive agreements not made in the ordinary course of business
? Bankruptcies or receiverships
? Director is elected
? Director departs
? If a director departs because of a disagreement with the company on any matter relating to the registrant’s operations, policies, or practices then an 8-K must be filed to disclose a brief description of the circumstances representing the disagreement.[1]
? Asset movement: acquisition or sale
? Result of operations and financial condition
? Material Direct Financial obligations (bonds, debentures)
? Triggering events that accelerate material obligations (defaults on a loan)
? Exit or disposal plans
? Layoffs
? shutting down a plant
? material change in services or outlets
? Material impairments
? Delisting or transfer exchange notices
? Unregistered equity sales
? Modifications to shareholder rights
? Change in accountant - and good idea to explain why
? SEC investigations and internal reviews
? Financial non-reliance notices
? Changes in control of the company
? Someone takes a large equity position (more than 15%); shareholder also needs to file with SEC as to intent
? Someone takes a 51% position
? Changes in executive management
? Officer leaves
? Officer is fired
? Officer is hired
? Departure or appointment of company officers
? Amendments to company Governance Policies
? Code of Ethics
? Board Committee Governance Policies
? Trading suspension
? Change in credit
? Change in company status
? Other events
? Financial exhibits
Investors should always read any 8-K filings that are made by companies in which they are invested. These reports are both material and relevant to the company, and often contain information that will affect the share price.
Reading Form 8K
Typically an 8-K filing will only have two major parts. They are:
? The name and description of the event - this contains all the information that the company considers relevant to shareholders and the SEC. It is important to read this information, as it has been deemed "material" by the company.
? Any exhibits that are relevant - these exhibits may include financial statements, press releases, data tables, or other information that is referenced in the description of the event.
Marubozu Candlesticks
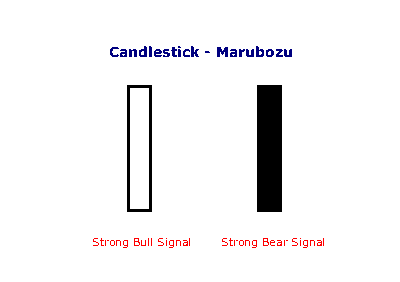
Marubozu are even stronger bull or bear signals than long lines as they show that buyers/sellers have remained in control from the open to the close -- there are no intra-day retracements.
BEARISH TWO CROWS
During an uptrend we see the market closing lower after an opening gap. Then we see a black day that fills the gap creating the Bearish Two Crows Pattern. It suggests the erosion of the uptrend, and warns about a possible trend reversal.

Recognition Criteria:
1. Market is characterized by uptrend.
2. We see a long white candlestick in the first day.
3. Then we see a black candlestick on the second day characterized by a gap up.
4. Finally we see a black candlestick whose opening price is inside the body of the second day and which closes inside the body of the first day.
Explanation:
In the Two Crows bear pattern, the market is already in an extended uptrend. We see a gap in the opening of the second day. This higher opening is followed by a lower close in this second day warning that there is some weakness in the rally. The third day also opens at a higher price, but not above the open of the previous day, and then prices go down with a close well within the body of the first day. This third day action fills the gap of the second day. It shows that the bullishness started to erode quickly.
Important Factors:
A confirmation on the fourth day is required to show that the uptrend has reversed. This confirmation may be in the form of a black candlestick, a large gap down or a lower close on the fourth day.
W-Bottoms Using Bollinger Bands
W-Bottoms were part of Arthur Merrill's work that identified 16 patterns with a basic W shape. Bollinger uses these various W patterns with Bollinger Bands to identify W-Bottoms. A "W-Bottom" forms in a downtrend and involves two reaction lows. In particular, Bollinger looks for W-Bottoms where the second low is lower than the first, but holds above the lower band. There are four steps to confirm a W-Bottom with Bollinger Bands. First, a reaction low forms. This low is usually, but not always, below the lower band. Second, there is a bounce towards the middle band. Third, there is a new price low in the security. This low holds above the lower band. The ability to hold above the lower band on the test shows less weakness on the last decline. Fourth, the pattern is confirmed with a strong move off the second low and a resistance break.

Nordstrom (JWN) with a W-Bottom in January-February 2010. First, the stock formed a reaction low in January (black arrow) and broke below the lower band. Second, there was a bounce back above the middle band. Third, the stock moved below its January low and held above the lower band. Even though the 5-Feb spike low broke the lower band, Bollinger Bands are calculated using closing prices so signals should also be based on closing prices. Fourth, the stock surged with expanding volume in late February and broke above the early February high.
|
Followers
|
3286
|
Posters
|
|
|
Posts (Today)
|
0
|
Posts (Total)
|
2804248
|
|
Created
|
08/22/10
|
Type
|
Free
|
| Moderator Nilbud | |||
| Assistants mick ManicTrader PhotoChick Kirimi $Pistol Pete$ | |||
   Investor Hub Alerts: Sign up for 'STOCKGOODIES PLAYS OF THE WEEK ' E-Mail List Investor Hub Alerts: Sign up for 'STOCKGOODIES PLAYS OF THE WEEK ' E-Mail ListUPDATE; 5-1-22 courtesy of charting /\ wit tweezer top calls /\ Tony @Montana_Trades Really good study sheet on Candlestick Patterns [-chart]pbs.twimg.com/media/FRn8188XMAAdZvk?format=jpg&name=small[/chart] 

02-07-2021
|
|
Posts Today
|
0
|
|
Posts (Total)
|
2804248
|
|
Posters
|
|
|
Moderator
|
|
|
Assistants
|
| Volume | |
| Day Range: | |
| Bid Price | |
| Ask Price | |
| Last Trade Time: |


