 News
News  Market Data
  Discover
Support: 888-992-3836
Copyright © 2023 InvestorsHub Inc.


Register for free to join our community of investors and share your ideas. You will also get access to streaming quotes, interactive charts, trades, portfolio, live options flow and more tools.
Trix is calculated with a given N-day period as follows:
Smooth prices (often closing prices) using an N-day exponential moving average (EMA).
Smooth that series using another N-day EMA.
Smooth a third time, using a further N-day EMA.
Calculate the percentage difference between today's and yesterday's value in that final smoothed series.
$PARA BarChart Technical Analysis
http://www.barchart.com/technicals/stocks/PARA
DEF 14A~ SEC Filings Explained
A proxy statement is a statement required of a firm when soliciting shareholder votes. This statement is filed in advance of the annual meeting. The firm needs to file a proxy statement, otherwise known as a Form DEF 14A (Definitive Proxy Statement), with the U.S. Securities and Exchange Commission. This statement is useful in assessing how management is paid and potential conflict-of-interest issues with auditors. The statement includes:
? Voting procedure and information.
? Background information about the company's nominated directors including relevant history in the company or industry, positions on other corporate boards, and potential conflicts in interest.
? Board compensation.
? Executive compensation, including salary, bonus, non-equity compensation, stock awards, options, and deferred compensation. Also, information is included about perks such as personal use of company aircraft, travel, and tax gross-ups. Many companies will also include pre-determined payout packages for if an executive leaves the company.
? Who is on the audit committee, as well as a breakdown of audit and non-audit fees paid to the auditor.
SEC proxy rules: The term "proxy statement" means the statement required by Section 240.14a-3(a) whether or not contained in a single document.
In many cases, shareholder votes - particularly institutional shareholder votes - are determined by proxy firms which advise the shareholders...
Traditionally, broker-dealers have been permitted to vote for "routine" proposals on behalf of their shareholders if the shareholders do not return the proxy statement. This has been controversial, and in 2006 the NYSE Proxy Working Group recommended that the rules be modified so that uncontested director elections were not considered routine.[1] The SEC approved the rule on July 1, 2009.[2]
In July 2010, the SEC announced that it was seeking public comment on the efficiency of the proxy system.[3]
There has been some controversy over "proxy access" which is a method to allow shareholders to nominate candidates which appear on the proxy statement. Currently, only the nominating board can place candidates on the proxy statement. The United States Dodd–Frank Wall Street Reform and Consumer Protection Act specifically allowed the SEC to rule on this issue. In 2010, the SEC passed a rule which allowed certain shareholders to place candidates on the proxy statement,;[4] however, the rule was struck down by the United States Court of Appeals for the District of Columbia Circuit in 2011

Technical Indicators are the often squiggly lines found above, below and on-top-of the price information on a technical chart. Indicators that use the same scale as prices are typically plotted on top of the price bars and are therefore referred to as "Overlays."
$GAEC BarChart Technical Analysis
http://www.barchart.com/technicals/stocks/GAEC
When the MACD crosses over from below the signal and rises above the signal, this is a sign to buy. Conversely, when the MACD crosses over from above and drops below the signal, this is a sign to sell.
BULLISH MEETING LINES
We sometimes see that market gaps sharply lower when it opens and then closes at the same level as the prior session’s close. This is seen following a black candlestick in a downtrend. Such an occurrence is called Bullish Meeting Lines Pattern that is a pattern reflecting a stalemate between bulls and bears.

Recognition Criteria:
1. Market is characterized by downtrend.
2. We see a black candlestick on the first day.
3. Then we see a long white candlestick on the second day. Its body is lower than the previous trend.
4. The closing prices are same or almost same on both days.
5. Both candlesticks are long but the second candlestick may be shorter than the first.
Explanation:
This pattern appears during a decline. The first candlestick of this pattern is long and black. However the next session opens sharply lower causing the bears to feel confident. Then the bulls start a counterattack pushing the prices up and leading to a close equal to previous close. The downtrend is now breached.
Important Factors:
The Bullish Meeting Lines Pattern is a pattern that is comparable to the Bullish Piercing Line Pattern. The Piercing Line has the same two-candlestick pattern. The main difference between the two is the fact that the bullish counterattack does not carry the prices up to the prior session’s white real body in the case of Bullish Meeting Lines Pattern. It can only get back to prior session’s close while The Piercing Line Pattern’s second line pushes well into the black real body. Consequently the Piercing Line Pattern is a more significant bottom reversal. Nonetheless, the Bullish Meeting Lines Pattern should also be respected.
The Bullish Meeting Lines Pattern requires confirmation of the reversal on the third day. This confirmation may be in the form of a white candlestick, a large gap up or a higher close on the third day.
TRIX oscillates around a zero line so like most oscillating indicators a positive value indicates an overbought market and a negative value indicates an oversold market. Thus when the TRIX crosses above the zero line it gives a buy signal, and when it closes below the zero line, it gives a sell signal.
$AMBS BarChart Technical Analysis
http://www.barchart.com/technicals/stocks/AMBS
Form S-8 ~ SEC Filings Explained
Initial registration statement for securities to be offered to employees pursuant to employee benefit plans
A fast EMA responds more quickly than a slow EMA to recent changes in a stock's price. By comparing EMAs of different periods, the MACD line can indicate changes in the trend of a stock. By comparing that difference to an average, an analyst can detect subtle shifts in the stock's trend.
$ASAGF BarChart Technical Analysis
http://www.barchart.com/technicals/stocks/ASAGF
MORNING STAR
This is a three-candlestick formation that signals a major bottom. It is composed of a first long black body, a second small real body, white or black, gapping lower to form a star. These two candlesticks define a basic star pattern. The third is a white candlestick that closes well into the first session’s black real body. Third candlestick shows that the market turned bullish now.

Recognition Criteria:
1. Market is characterized by downtrend.
2. We see a long black candlestick in the first day.
3. Then we see a small body on the second day gapping in the direction of the previous downtrend.
4. Finally we see a white candlestick on the third day.
Explanation:
We see the black body in a falling market suggesting that the bears are in command. Then a small real body appears implying the incapacity of sellers to drive the market lower. The strong white body of third day proves that bulls have taken over. An ideal Bullish Morning Star Pattern preferably has a gap before and after the middle candlestick. The second gap is rare, but lack of it does not take away from the power of this formation.
Important Factors:
The stars may be more than one, two or even three.
The color of the star and its gaps are not important.
Chaikin Money Flow can be set as an indicator above or below the main window. Because it is shown in area format, it is not really suited for placement behind the security's price plot. Once the indicator is chosen from the drop down list, the default parameter appears (20). These parameters can be adjusted to increase or decrease sensitivity. Users can click on "advanced options" to add horizontal lines, moving averages or other overlays. Chartists can even plot a second and longer Chaikin Money Flow indicator on top of the other. Period's of overlap show when money flow is strong for two different periods.
$TIPS BarChart Technical Analysis
http://www.barchart.com/technicals/stocks/TIPS
Form N-6 ~ SEC Filings Explained
Registration statement for separate accounts
MACD is based on moving averages, it is inherently a lagging indicator. However, in this regard the MACD does not lag as much as a basic moving average crossing indicator, since the signal cross can be anticipated by noting the convergence far in advance of the actual crossing. As a metric of price trends, the MACD is less useful for stocks that are not trending (trading in a range) or are trading with erratic price action.
$GEGP BarChart Technical Analysis
http://www.barchart.com/technicals/stocks/GEGP
BULLISH GRAVESTONE DOJI
Gravestone Doji is a specific Doji with opening and closing prices equal to the low of the day. The Bullish Gravestone Doji Pattern is a bottom reversal pattern. Similar to its cousin the Bullish Inverted Hammer Pattern, it occurs in a downtrend and represents a possible reversal of trend.
Recognition Criteria:
1. Market is characterized by downtrend.
2. We see a black body formed at the lower end of the trading range.
3. We then see a Doji, which does not have a lower shadow in the second day.
4. No gap down is required.
Explanation:
The market opens below the closing price of the previous day. Then there is a brief rally but the rally is not enough to send prices over the closing price of previous day and prices then reverse direction and fall down to the day’s lows. This movement however leaves shorts in a losing position creating the potential for an upcoming rally. It may not be clear why it signals a potential reversal. The answer has to do with what happens over the next session. If the next day opens above the real body of the Gravestone Doji, it means those who shorted at the opening (or closing) of the Gravestone day are losing money. The longer the market holds above Gravestone Doji’s real body the more likely these shorts will cover. The short will then spark a rally by covering their positions, which also encourage the bottom pickers to go long. The Gravestone Doji represents the graves of those bears that have died defending their territory.
Important Factors:
Bullish Gravestone Doji requires further confirmation on the next day. Confirmation may be in the form of the next day opening above the Gravestone Doji’s body. The larger the gap the stronger the confirmation will be. A white candlestick with higher prices can also be another form of confirmation.
The Coppock curve or Coppock indicator is a technical analysis indicator for long-term stock market investors created by E.S.C. Coppock, first published in Barron's Magazine on October 15, 1962.[1]
The indicator is designed for use on a monthly time scale. It's the sum of a 14-month rate of change and 11-month rate of change, smoothed by a 10-period weighted moving average.
$ABOT BarChart Technical Analysis
http://www.barchart.com/technicals/stocks/ABOT
3. Counterparty risk (Risks Associated with ETF’s)
A synthetic ETF has counterparty risk, because the counterparty is contractually obligated to match the return on the index. The deal is arranged with collateral posted by the swap counterparty. A potential hazard is that the investment bank offering the ETF might post its own collateral, and that collateral could be of dubious quality. Furthermore, the investment bank could use its own trading desk as counterparty. These types of set-ups are not allowed under the European guidelines, Undertakings for Collective Investment in Transferable Securities (UCITS), so the investor should look for UCITS III-compliant funds.
The Force Index can be used in conjunction with a trend following indicator to identify short-term corrections within that trend. A pullback from overbought levels represents a short-term correction within an uptrend. An oversold bounce represents a short-term correction within a downtrend. Yes, corrections can be up or down, it depends on the direction of the bigger trend.
$BION BarChart Technical Analysis
http://www.barchart.com/technicals/stocks/BION
Tweezer Bottoms

The Tweezer Bottom formation is a bullish reversal pattern seen at the bottom of downtrends.
Tweezer Bottom formation consists of two candlesticks:
Bearish Candle (Day 1)
Bullish Candle (Day 2)
Sometimes Tweezer Bottoms have three candlesticks.
A bullish Tweezer Bottom occurs during a downtrend when bears continue to take prices lower, usually closing the day near the lows (a bearish sign). Nevertheless, Day 2 is completely opposite because prices open and go nowhere but upwards. This bullish advance on Day 2 sometimes eliminates all losses from the previous day.

The bears pushed the price of Exxon-Mobil (XOM) downwards on Day 1; however, the market on Day 2 opened where prices closed on Day 1 and went straight up, reversing the losses of Day 2. A buy signal would generally be given on the day after the Tweezer Bottom, assuming the candlestick was bullish green.
The Tweezer Top and Bottom reversal pattern is extremely helpful because it visually indicates a transfer of power and sentiment from the bulls and the bears. Of course other technical indicators should be consulted before making a buy or sell signal based on the Tweezer patterns.
The RSI formula normalizes RS and turns it into an oscillator that fluctuates between zero and 100. In fact, a plot of RS looks exactly the same as a plot of RSI. The normalization step makes it easier to identify extremes because RSI is range bound. RSI is 0 when the Average Gain equals zero. Assuming a 14-period RSI, a zero RSI value means prices moved lower all 14 periods. There were no gains to measure. RSI is 100 when the Average Loss equals zero. This means prices moved higher all 14 periods. There were no losses to measure.
$GRDO BarChart Technical Analysis
http://www.barchart.com/technicals/stocks/GRDO
Star Formations[/]
Stars are similar to gaps. A long body followed by a much shorter candlestick with a short body, where the bodies must not overlap -- though their shadows may.
The Force Index is uses both price and volume to measure buying and selling pressure. The price portion covers the trend, while the volume portion determines the intensity. At its most basic, chartists can use a long-term Force Index to confirm the underlying trend.
$MEDT BarChart Technical Analysis
http://www.barchart.com/technicals/stocks/MEDT
Currency ETFs or ETCs
In 2005, Rydex Investments launched the first ever currency ETF called the Euro Currency Trust (NYSE: FXE) in New York. Since then Rydex has launched a series of funds tracking all major currencies under their brand CurrencyShares. In 2007Deutsche Bank's db x-trackers launched EONIA Total Return Index ETF in Frankfurt tracking the euro, and later in 2008 the Sterling Money Market ETF (LSE: XGBP) and US Dollar Money Market ETF (LSE: XUSD) in London. In 2009, ETF Securitieslaunched the world's largest FX platform tracking the MSFXSM Index covering 18 long or short USD ETC vs. single G10 currencies. The funds are total return products where the investor gets access to the FX spot change, local institutional interest rates and a collateral yield.
RSI positive and negative reversals put price action of the underlying security first and the indicator second, which is the way it should be. Bearish and bullish divergences place the indicator first and price action second. By putting more emphasis on price action, the concept of positive and negative reversals challenges our thinking towards momentum oscillators.
$MGLT BarChart Technical Analysis
http://www.barchart.com/technicals/stocks/MGLT
Form NT 10-K ~ SEC Filings Explained
Notice under Rule 12b25 of inability to timely file all or part of a Form 10-K, 10-KSB, or 10KT
Developed J. Welles Wilder, the Relative Strength Index (RSI) is a momentum oscillator that measures the speed and change of price movements. RSI oscillates between zero and 100.
$ELRA BarChart Technical Analysis
http://www.barchart.com/technicals/stocks/ELRA
Falling Three Methods
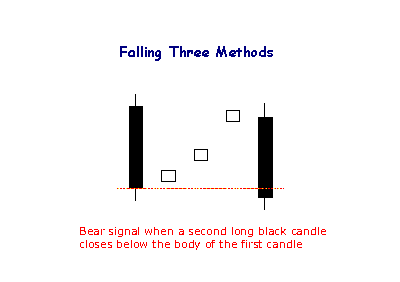
The bearish Falling Method consists of two long black lines bracketing 3 or 4 small ascending white candlesticks, the second black line forming a new closing low.
Bollinger Bands is a versatile tool combining moving averages and standard deviations and is one of the most popular technical analysis tools available for traders.
$CALVF BarChart Technical Analysis
http://www.barchart.com/technicals/stocks/CALVF
Form N-PX ~ SEC Filings Explained
Annual Report of Proxy Voting Record of Registered Management Investment Companies
Bandwidth tells how wide the Bollinger Bands are on a normalized basis. Writing the same symbols as before, and middleBB for the moving average, or middle Bollinger Band.
$IPRU BarChart Technical Analysis
http://www.barchart.com/technicals/stocks/IPRU
Three White Soldiers (Bullish)
Bullish Three White Soldiers Pattern is indicative of a strong reversal in the market. It is characterized by three long candlesticks stepping upward like a staircase. The opening of each day is slightly lower than previous close rallying then to a short term high.
Recognition Criteria:
1. Market is characterized by downtrend.
2. We see three consecutive long white candlesticks.
3. Each candlestick closes at a new high.
4. The opening of each candlestick is within the body of the previous day.
5. Each consecutive day closes near or at its highs.
Explanation:
The Bullish Three White Soldiers Pattern appears in a context where the market stayed at a low price for too long. The market is still falling down and it is now approaching a bottom or already at bottom. Then we see a decisive attempt upward shown by the long white candlestick. Rally continues in the next two days characterized by higher closes. Bears are now forced to cover short positions.
Important Factors:
The opening prices of the second and third days can be anywhere within the previous day's body. However, it is better to see the opening prices above the middle of the previous day's body.
If the white candlesticks are very extended, one should be cautious about an overbought market.
The reliability of this pattern is very high, but still a confirmation in the form of a white candlestick with a higher close or a gap-up is suggested.
Chaikin Money Flow is not suited for all securities. The chart above shows P.F. Chang (PFCB) with some 18 crosses above .50 or below -.50. Basing CMF signals on these crosses resulted in one whipsaw after another. It is important to analyze the basic price trend and the characteristics of an indicator with a particular security. PFCB exhibits some trend, but price action within this trend is choppy and money flow cannot maintain a positive or negative bias. It would be better to find a different indicator for this stocks.
$TAGE BarChart Technical Analysis
http://www.barchart.com/technicals/stocks/TAGE
Candlestick Colors
For improved presentation, Incredible Charts uses colors such as red and blue/green to indicate filled or hollow candlesticks:
Blue (or green) candlestick if the close is higher than the open;
Red candlestick if the open is higher than the close (i.e. the candlestick is filled);
The same color as the previous day, if the open is equal to the close.
Once working with a SCTR table, users can sort the columns with the double arrows. Sorting can be by industry group, SCTR, SCTR Change or Close. The SCTR change is the change in SCTR values from one period to the next. Sorting by this column will show chartists which stocks had the biggest changes in their technical rank. This feature can be used to spot big movers. Note that leveraged and inverse ETFs are excluded because above average volatility and inverse price movements skew the results. The VIX ETF (VXX) is also excluded because it moves inverse to the S
$CMRZF BarChart Technical Analysis
http://www.barchart.com/technicals/stocks/CMRZF
The RSI roller-coaster is designed to squeeze as much profit as possible out of the turn trade. Instead of immediately closing out a position when it moves from oversold to overbought, the RSI roller-coaster keeps the trader in the market until price shows a sign of exhaustion. Sometimes a strong move will generate multiple consecutive periods of overbought RSI readings, and this setup is specifically intended to catch part of these potentially profitable moves.
List of Direxion ETF’s
Symbol Fund Index/Benchmark Daily Target Bloomberg Index Symbol
Long Term Investment
ETFs
KNOW
Direxion All Cap Insider Sentiment Shares
Sabrient Multi-Cap Insider/Analyst Quant-Weighted Index - SBRQAM
INSD
Direxion Large Cap Insider Sentiment Shares
Sabrient Large-Cap Insider/Analyst Quant-Weighted Index - SBRQAL
VSPY
Direxion S
|
Followers
|
3289
|
Posters
|
|
|
Posts (Today)
|
0
|
Posts (Total)
|
2804248
|
|
Created
|
08/22/10
|
Type
|
Free
|
| Moderator Nilbud | |||
| Assistants mick ManicTrader PhotoChick Kirimi $Pistol Pete$ | |||
   Investor Hub Alerts: Sign up for 'STOCKGOODIES PLAYS OF THE WEEK ' E-Mail List Investor Hub Alerts: Sign up for 'STOCKGOODIES PLAYS OF THE WEEK ' E-Mail ListUPDATE; 5-1-22 courtesy of charting /\ wit tweezer top calls /\ Tony @Montana_Trades Really good study sheet on Candlestick Patterns [-chart]pbs.twimg.com/media/FRn8188XMAAdZvk?format=jpg&name=small[/chart] 

02-07-2021
|
|
Posts Today
|
0
|
|
Posts (Total)
|
2804248
|
|
Posters
|
|
|
Moderator
|
|
|
Assistants
|
| Volume | |
| Day Range: | |
| Bid Price | |
| Ask Price | |
| Last Trade Time: |


