 News
News  Market Data
  Discover
Support: 888-992-3836
Copyright © 2023 InvestorsHub Inc.


Register for free to join our community of investors and share your ideas. You will also get access to streaming quotes, interactive charts, trades, portfolio, live options flow and more tools.
M-Tops Using Bollinger Bands
M-Tops were also part of Arthur Merrill's work that identified 16 patterns with a basic M shape. Bollinger uses these various M patterns with Bollinger Bands to identify M Bottoms. According to Bollinger, tops are usually more complicated and drawn out than bottoms. Double tops, head-and-shoulders patterns and diamonds represent evolving tops.
In its most basic form, an M-Top is similar to a double top. However, the reaction highs are not always equal. The first high can be higher or lower than the second high. Bollinger suggests looking for signs of non-confirmation when a security is making new highs. This is basically the opposite of the W-Bottom. A non-confirmation occurs with three steps. First, a security forges a reaction high above the upper band. Second, there is a pullback towards the middle band. Third, prices move above the prior high, but fail to reach the upper band. This is a warning sign. The inability of the second reaction high to reach the upper band shows waning momentum, which can foreshadow a trend reversal. Final confirmation comes with a support break or bearish indicator signal.

The chart shows Exxon Mobil (XOM) with an M-Top in April-May 2008. The stock moved above the upper band in April. There was a pullback in May and then another push above 90. Even though the stock moved above the upper band on an intraday basis, it did not CLOSE above the upper band. The M-Top was confirmed with a support break two weeks later. Also notice that MACD formed a bearish divergence and moved below its signal line for confirmation.

More On $DIAAF At PennyStock Tweets
http://www.pennystocktweets.com/stocks/profile/DIAAF

#1 Chart Analysis
Basics
What Are Charts?
A price chart is a sequence of prices plotted over a specific time frame. In statistical terms, charts are referred to as time series plots.

On the chart, the y-axis (vertical axis) represents the price scale and the x-axis (horizontal axis) represents the time scale. Prices are plotted from left to right across the x-axis with the most recent plot being the furthest right. The price plot for IBM extends from January 1, 1999 to March 13, 2000.
Check Out $PDOS On PennyStock Tweets
http://www.pennystocktweets.com/stocks/profile/PDOS
Form N-30D ~ SEC Filings Explained
Initial annual and semi-annual reports mailed to investment company shareholders
8. Defined-Contribution Pension Plans grew and replaced many Defined-Benefit Plans. Among other things, the decline in unions and big manufacturing industries (autos) contributed to this trend.

More On $GGABF At PennyStock Tweets
http://www.pennystocktweets.com/stocks/profile/GGABF
BULLISH STICK SANDWICH
The Bullish Stick Sandwich Pattern is characterized by consecutive higher opens for three days, but results in an eventual close equal to the first day's close. It may warn that prices are now finding a support price. We may then see a reversal from this support level.

Recognition Criteria:
1. Market is characterized by downtrend.
2. We see a Black Closing Marubozu in the first day.
3. Then we see a white candlestick, which is above the close of the first day.
4. Then we again see a Black Closing Marubozu characterized with a close equal to the close of the first day.
Explanation:
In the Bullish Stick Sandwich Pattern, there is a downtrend going on. Then prices open higher on the next trading day and they reach to higher levels all day, closing at or near the high. This bullish act suggests that the previous downtrend may now reverse implying that the shorts need protection. The next day, prices open at a higher level leading some shorts to cover their positions initially but then the prices start moving lower to close at the same price as two days ago. This pattern shows that the market is finding a support level and now the trend may reverse from this support level.
Important Factors:
A confirmation on the fourth day is required to be sure that the downtrend is reversed. Confirmation may be in the form of a white candlestick, a large gap up or a higher close on the fourth day.
In Nov/Dec-99, Lucent Technologies (LU)[Lu] formed a trading range that resembled a head and shoulders pattern (red oval). When the stock broke support at 60, there was little or no time to exit.
Form N-Q ~ SEC Filings Explained
Quarterly Schedule of Portfolio Holdings of Registered Management Investment Company
Furthermore, the tools shown in this article should be used in conjunction with other technical analysis techniques.
For All Your $AUMY DD ~ Use PennyStock Tweets
http://www.pennystocktweets.com/stocks/profile/AUMY
Form 2-E, 2-E/A ~ SEC Filings Explained
Sales material filed pursuant to Rule 609 under Regulation E. (and amendment thereto)
How Are Charts Formed?
We will be explaining the construction of line, bar, candlestick and point
For All Your $ASCC DD ~ Use PennyStock Tweets
http://www.pennystocktweets.com/stocks/profile/ASCC
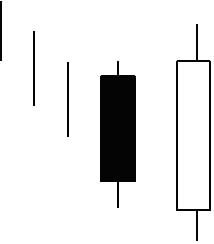
Bearish Falling Three Methods Candlestick
• Direction: Bearish
• Type: Continuation
• Reliability: Strong

• In a downtrend, a long red day occurs
• The second, third and fourth days are short blue days that fall within the range of the first day
• The fifth day continues the downtrend with a long red candle that creates new lows
The Falling Three Methods pattern occurs in a bear market, where during a downtrend the market rests before resuming the trend. The bearish trends break is reflected by small candles that all stick to a strict market range formed by the aggressive move on day one.
A typical explanation for this type of formation might that the market is slowly digesting the relatively larger move in day-one. These small daily ranges often precede significant economic reports. Such periods of relative inactivity and tight trading are common in markets. Falling Three Methods is confirmed where a red candle dives down to new lows reinstituting the bearish trend.
Number of Middle Candles - In a picture perfect formation the middle candles number three. But realistically the pattern may have two, four or even five candles. Individually each middle candle may be a star or doji, red or blue.
Middle Candle Wicks - Important to note is that each middle candle wick needs to stay within the first candles high/low range to signal a strong continuation signal. With the bearish Falling Three Methods this is especially important for the highs. Should a wick trade to a high above the first large red candles high, it casts doubt over the strength of the established down trend.
For a candlestick chart, the open, high, low and close are all required.
More On $TFER At PennyStock Tweets
http://www.pennystocktweets.com/stocks/profile/TFER
Nasdaq-100 Index Tracking Stock (Nasdaq:QQQQ)
This ETF represents the Nasdaq-100 Index, which consists of the 100 largest and most actively traded non-financial stocks on the Nasdaq, QQQQ offers broad exposure to the tech sector. Because it curbs the risk that comes with investing in individual stocks, the QQQQ is a great way to invest in the long-term prospects of the technology industry. The diversification it offers can be a huge advantage when there's volatility in the markets. If a tech company falls short of projected earnings, it will likely be hit hard. Between 2000 and 2004, QQQQ was by far the most heavily traded index fund.
Signals that are available on candlestick charts may not appear on bar charts.
$MEDT Profile on PST - For All Your DD Use More http://www.pennystocktweets.com/stocks/stockprofile/MEDT
ETF’s Explained
An exchange-traded fund (ETF) is an investment fund traded on stock exchanges, much like stocks.[1] An ETF holds assets such as stocks, commodities, or bonds, and trades close to its net asset value over the course of the trading day. Most ETFs track an index, such as a stock index or bond index. ETFs may be attractive as investments because of their low costs, tax efficiency, and stock-like features.[2][3] ETFs are the most popular type of exchange-traded product.[citation needed]
Only so-called authorized participants (typically, large institutional investors) actually buy or sell shares of an ETF directly from or to the fund manager, and then only in creation units, which are large blocks of tens of thousands of ETF shares, usually exchanged in-kind with baskets of the underlying securities. Authorized participants may wish to invest in the ETF shares for the long-term, but they usually act as market makers on the open market, using their ability to exchange creation units with their underlying securities to provide liquidity of the ETF shares and help ensure that their intraday market price approximates to the net asset value of the underlying assets.[4] Other investors, such as individuals using a retail broker, trade ETF shares on this secondary market.
An ETF combines the valuation feature of a mutual fund or unit investment trust, which can be bought or sold at the end of each trading day for its net asset value, with the tradability feature of a closed-end fund, which trades throughout the trading day at prices that may be more or less than its net asset value. Closed-end funds are not considered to be "ETFs", even though they are funds and are traded on an exchange. ETFs have been available in the US since 1993 and in Europe since 1999. ETFs traditionally have been index funds, but in 2008 the U.S. Securities and Exchange Commission began to authorize the creation of actively managed ETFs.
6. The 1990's surge in business media undoubtedly contributed to interest in the stock market. Not much explanation is needed here. Newspapers created big glossy business sections to attract readers.
$HPGI Profile on PST - For All Your DD Use More http://www.pennystocktweets.com/stocks/stockprofile/HPGI
SEC Filings Explained ~ Form 3
Form 3 is an SEC filing filed with the US Securities and Exchange Commission to indicate a preliminary insider transaction by an officer, director, or beneficial (10%) owner of the company's securities. These are typically seen after a company IPOs when insiders make their first transactions. After a Form 3 is filed, future filings of the same nature are filed under Form 4 (standard disclosure) or Form 5 (annual disclosure).
#2 Support and Resistance
Support and resistance represent key junctures where the forces of supply and demand meet. In the financial markets, prices are driven by excessive supply (down) and demand (up).
Use PennyStock Tweets For All Your $TNEN DD
http://www.pennystocktweets.com/stocks/profile/TNEN
Form 11-K, 11-K/A ~ SEC Filings Explained
Annual report of employee stock purchase, savings and similar plans (and amendment thereto)
Intermarket Analysis
Introduction
For All Your $ARCS DD ~ Use PennyStock Tweets
http://www.pennystocktweets.com/stocks/profile/ARCS
SEC Filings Explained ~ Form 4
Form 4 is a United States SEC filing that relates to insider trading. Every director, officer or owner of more than ten percent of a class of equity securities registered under Section 12 of the Securities Exchange Act of 1934 must file with the United States Securities and Exchange Commission a statement of ownership regarding such security. The initial filing is on Form 3 and changes are reported on Form 4. The Annual Statement of beneficial ownership of securities is on Form 5. The forms contain information on the reporting person's relationship to the company and on purchases and sales of such equity securities.
Form 4 is stored in SEC's EDGAR database. EDGAR is Electronic Data Gathering, Analysis and Retrieval System. It is a registered trademark of the SEC.
A Form 4 must be filed before the end of the second business day following a change in ownership of securities or derivative securities (including the exercise or grant of stock options) for individuals subject to Section 16 of the Securities Exchange Act of 1934.
The more creativity you bring to the investment process, the more rewarding it will be. The only way to maintain ongoing success, however, is to constantly innovate.
Check Out $ACCP On PennyStock Tweets
http://www.pennystocktweets.com/stocks/profile/ACCP
Three White Soldiers (Bullish)
Bullish Three White Soldiers Pattern is indicative of a strong reversal in the market. It is characterized by three long candlesticks stepping upward like a staircase. The opening of each day is slightly lower than previous close rallying then to a short term high.
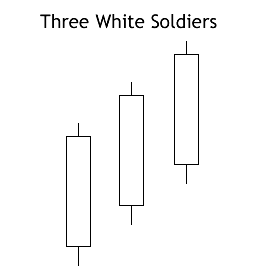
Recognition Criteria:
1. Market is characterized by downtrend.
2. We see three consecutive long white candlesticks.
3. Each candlestick closes at a new high.
4. The opening of each candlestick is within the body of the previous day.
5. Each consecutive day closes near or at its highs.
Explanation:
The Bullish Three White Soldiers Pattern appears in a context where the market stayed at a low price for too long. The market is still falling down and it is now approaching a bottom or already at bottom. Then we see a decisive attempt upward shown by the long white candlestick. Rally continues in the next two days characterized by higher closes. Bears are now forced to cover short positions.
Important Factors:
The opening prices of the second and third days can be anywhere within the previous day's body. However, it is better to see the opening prices above the middle of the previous day's body.
If the white candlesticks are very extended, one should be cautious about an overbought market.
The reliability of this pattern is very high, but still a confirmation in the form of a white candlestick with a higher close or a gap-up is suggested.
$HLOSF Profile on PST - For All Your DD Use More http://www.pennystocktweets.com/stocks/stockprofile/HLOSF
Generally, the tighter the range, the more exact the level. If the trading range spans less than 2 months and the price range is relatively tight, then more exact support and resistance levels are best suited.
Form N-8A ~ SEC Filings Explained
Initial notification of registration under section 8(a) filed on Form N-8A
$SURE Profile on PST - For All Your DD Use More http://www.pennystocktweets.com/stocks/stockprofile/SURE
Bonds decline under these circumstances and rise when the economy is weak and/or deflationary pressures are building. A ratio of the two can provide further insights into economic strength/weakness or inflation/deflation.
Engulfing Candlesticks
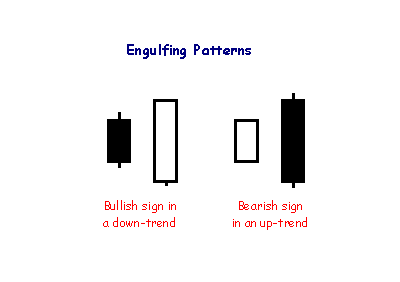
Engulfing patterns are where the body of the second candlestick 'engulfs' the first. They often follow or complete doji, hammer or gravestone patterns and signal reversal in the short-term trend.
Use PennyStock Tweets For All Your $ROSV DD
http://www.pennystocktweets.com/stocks/profile/ROSV
There is an argument to be made for historical valuations, but markets can remain irrational a lot longer than traders can remain solvent.
Three Black Crows (Bullish)
The Bearish Three Black Crows Pattern is indicative of a strong reversal during an uptrend. It consists of three long black candlesticks, which look like a stair stepping downward. The opening price of each day is higher than the previous day's closing price suggesting a move to a new short term low.

Recognition Criteria:
1. Market is characterized by uptrend.
2. Three consecutive long black candlesticks appear.
3. Each day closes at a new low.
4. Each day opens within the body of the previous day.
5. Each day closes near or at its lows.
Explanation:
The Bearish Three Black Crows Pattern is indicative of the fact that the market has been at a high price for too long and the market may be approaching a top or is already at the top. A decisive downward move is reflected by the first black candlestick. The next two days show further decline in prices due to profit taking. Bullish mood of the market cannot be sustained anymore.
Important Factors:
The opening prices of the second and third days can be anywhere within the previous day's body. However, it is better to see the opening prices below the middle of the previous day's body.
If the black candlesticks are very extended, one should be cautious about an oversold market.
The reliability of this pattern is very high, but still a confirmation in the form of a black candlestick with a lower close or a gap-down is suggested.
Check Out $FEEC On PennyStock Tweets
http://www.pennystocktweets.com/stocks/profile/FEEC
Therefore, there were a lot of bullish buyers of the stock around 18. When the price declined below 18 and fell to around 14, many of these (now unhappy) bulls were probably still holding the stock.
For All Your $GSTV DD ~ Use PennyStock Tweets
http://www.pennystocktweets.com/stocks/profile/GSTV
Golden Cross
A Golden Cross is when a shorter term moving average crosses above a longer term moving average, for example a 20 day SMA crossing over a 50 day SMA. A golden cross indicates a bullish trend, especially when it is coupled with higher trading volume. As well as being a trend indicator, the longer term moving average becomes a support line as the price rises.
The chart below shows a 20/50 SMA Golden cross:
20 SMA is in Red
50 SMA is in Blue

In addition, buyers could not be coerced into buying until prices declined below support or below the previous low.
$HALB Profile on PST - For All Your DD Use More http://www.pennystocktweets.com/stocks/stockprofile/HALB
BULLISH ENGULFING
Bullish Engulfing Pattern is a pattern characterized by a large white real body engulfing a preceding small black real body, which appears during a downtrend. The white body does not necessarily engulf the shadows of the black body but totally engulfs the body itself. The Bullish Engulfing Pattern is an important bottom reversal signal.
Recognition Criteria:
1. Market is characterized by downtrend.
2. Then we see a small black body.
3. Next day we see a white body that completely engulfs the black real body of the preceding day.
Explanation:
While the market sentiment is bearish; we see some subsided selling reflected by the short, black real body of the first day. Next day shows bull strength with a closing price at or above the previous day’s open. It means that the downtrend is now losing momentum and the bulls started to take the lead.
Important Factors:
The relative size of the bodies in the first and second days is important. If the first day of the Bullish Engulfing Pattern is characterized by a very small real body (it may even be a doji or nearly a doji) but the second day is characterized by a very long real body, this strongly indicates that the bearish power is diminishing and the disparity of white versus black body is indicative of the emerging bull power.
There is higher probability of a bullish reversal if there is heavy volume on the second real body or if the second day of the Bullish Engulfing Pattern engulfs more than one real body (which essentially means we see two or more small black bodies preceding the long white body).
The reversal of downtrend needs further confirmation on the third day. This confirmation may be in the form of a white candlestick, a large gap up or a higher close on the third day.
|
Followers
|
3289
|
Posters
|
|
|
Posts (Today)
|
0
|
Posts (Total)
|
2804248
|
|
Created
|
08/22/10
|
Type
|
Free
|
| Moderator Nilbud | |||
| Assistants mick ManicTrader PhotoChick Kirimi $Pistol Pete$ | |||
   Investor Hub Alerts: Sign up for 'STOCKGOODIES PLAYS OF THE WEEK ' E-Mail List Investor Hub Alerts: Sign up for 'STOCKGOODIES PLAYS OF THE WEEK ' E-Mail ListUPDATE; 5-1-22 courtesy of charting /\ wit tweezer top calls /\ Tony @Montana_Trades Really good study sheet on Candlestick Patterns [-chart]pbs.twimg.com/media/FRn8188XMAAdZvk?format=jpg&name=small[/chart] 

02-07-2021
|
|
Posts Today
|
0
|
|
Posts (Total)
|
2804248
|
|
Posters
|
|
|
Moderator
|
|
|
Assistants
|
| Volume | |
| Day Range: | |
| Bid Price | |
| Ask Price | |
| Last Trade Time: |


