 News
News  Market Data
  Discover
Support: 888-992-3836
Copyright © 2023 InvestorsHub Inc.


Register for free to join our community of investors and share your ideas. You will also get access to streaming quotes, interactive charts, trades, portfolio, live options flow and more tools.
These terms are used interchangeably throughout this and other articles. As demand increases, prices advance and as supply increases, prices decline.
SEC Filings Explained ~ Form13D
Schedule 13D is an SEC filing that must be submitted to the US Securities and Exchange Commission within 10 days, by anyone who acquires beneficial ownership of more than 5% of any class of publicly traded securities in a public company. A filer must promptly update its Schedule 13D filing to reflect any material change in the facts disclosed, including, among other things, the acquisition or disposition of 1% or more of the class of securities that are the subject of the filing.
Form Uses
13D filings allow the investing public to see who a public company's large shareholders are and, perhaps more importantly, why they have an interest in the company. These filings may be a precursor to hostile takeovers, company breakups, and other "change of control" events.
Reading the Form
Schedule 13D consists of seven different sections:
? Security and Issuer - This section contains basic information regarding the type and class the security and the contact information of the owner.
? Identity and Background - This section contains even more background into the owner, including if they were involved in any criminal activity in the past.
? Source and Amount of Funds or Other Considerations - This section lets investors know where the money is coming from. The most important use for this section is in determining if a buyout situation is overleveraged, when a majority of the purchase is leveraged or borrowed capital.
? Purpose of Transaction - This is the most important portion of the 13D filing. It allows you to see why they are buying shares in the company, whether it be for acquisition, hostile takeover, proxy war, or simply because they believe it is undervalued.
? Interest in Securities of the Issuer - This section states the express purpose of the transaction, which should be explained better in section 4 (Purpose of Transaction).
? Contracts, Arrangements, Understandings or Relationships with Respect to the Securities of the Issuer - This section contains any special relationships between the owner and the company. This is important to be sure that the buying is legitimate and not just a friend purchasing stock or the result of some other agreement.
? Materials to Be Filed as Exhibits - This is the second most important section. It contains any exhibits that may be filed along with the form. This is famously used for the filing of letters to management in the event of a hostile takeover. Exhibits can also elaborate on the Purpose of Transaction (Section 4).

$EWRL Profile on PST - For All Your DD Use More http://www.pennystocktweets.com/stocks/stockprofile/EWRL
Investors usually focus on weekly and monthly charts to spot long-term trends and forecast long-term price movements.
WHITE SPINNING TOP
The White Spinning Top is a single candlestick pattern. Its shape is a small white body with upper and lower shadows that have a greater length than the body's length.
Recognition Criteria:
1. The real body of the pattern is white and small.
2. The upper and lower shadows are longer than the real body's length.
Explanation:
The market moves higher and then sharply lower, or vice versa. It then closes above the opening price creating a white body. This represents complete indecision between the bulls and the bears. The actual length of the shadows is not important. The small body relative to the shadows is what makes the spinning top.
Important Factors:
If a White Spinning Top is observed after a long rally or a long white candlestick, this implies weakness among the bulls and it is a warning about a potential change or interruption in trend.
If a White Spinning Top is observed after a long decline or a long black candlestick, this implies weakness among the bears and it is a warning about a potential change or interruption in trend.
Like most other single candlestick patterns, the White Spinning Top has low reliability. It reflects only one day's trading and can be interpreted both as a continuation and a reversal pattern. This candlestick needs to be used with other candlesticks for a healthier confirmation of a trend.
Use PennyStock Tweets For All Your $RDUFF DD
http://www.pennystocktweets.com/stocks/profile/RDUFF

Technology stocks are not far behind. These two groups are the big leaders at the beginning of a bull run in the stock market.

For All Your $VKML DD ~ Use PennyStock Tweets
http://www.pennystocktweets.com/stocks/profile/VKML
Form N-8B-2 ~ SEC Filings Explained
Initial registration statement for unit investment trusts
What prompts individuals to buy or sell a security? How do investors handle risk or loss? Why do speculative bubbles appear and then burst?
BLACK SPINNING TOP
The Black Spinning Top is a single candlestick pattern. Its shape is a small black body with upper and lower shadows having a greater length than the body's length.
Recognition Criteria:
1. The real body of the pattern is black and small.
2. The upper and lower shadows are longer than the real body's length.
Explanation:
The market moves higher and then sharply lower, or vice versa. It then closes below the opening price creating a black body. This represents complete indecision between the bulls and the bears. The actual length of the shadows is not important. The small body relative to the shadows is what makes the spinning top.
Important Factors:
If a Black Spinning Top is observed after a long rally or long white candlestick, this implies weakness among the bulls and it is a warning about a potential change or interruption in trend.
If a Black Spinning Top is observed after a long decline or a long black candlestick, this implies weakness among the bears and it is a warning about a potential change or interruption in trend.
Like most other single candlestick patterns, the Black Spinning Top has low reliability. It reflects only one day's trading and can be interpreted both as a continuation and a reversal pattern. This pattern must be used with other candlesticks for a better and healthier confirmation of a trend.
For All Your $LCCTF DD ~ Use PennyStock Tweets
http://www.pennystocktweets.com/stocks/profile/LCCTF
However, there are enough asset classes, major indices, sectors, industry groups or stocks out there to insure that something is trending at some point. The challenge, as always, is to find that trend and ride it.
More On $DNYS At PennyStock Tweets
http://www.pennystocktweets.com/stocks/profile/DNYS
BEARISH ADVANCE BLOCK
It is a pattern characterized by three long white candlesticks with consecutively higher closes during an uptrend. The Bearish Advance Block Pattern is similar to the Bullish Three White Soldiers Pattern. The difference is the fact that each successive day is weaker than the one preceding it. This may suggest that the rally is losing strength and a reversal is possible.

Recognition Criteria:
1. Market is characterized by uptrend.
2. We see three adjacent white candlesticks with consecutively higher closes.
3. Each day opens within the previous day's body.
4. Each day’s body is significantly smaller than the body of the previous day.
Explanation:
If the second and the third candlesticks (particularly the third) show signs of weakening, this means that the rally is losing steam and longs must consider protecting their positions. Longs need especially to be careful about the Bearish Advance Block Pattern during a mature uptrend. Signs of weakening are the progressively smaller white real bodies or the relatively long upper shadows on the latter two white candlesticks.
Important Factors:
A definite deterioration in the upward strength is evidenced by long upper shadows on the second and third days.
The Bearish Advance Block Pattern is not normally a top reversal pattern, but it has the potential to precede a meaningful price decline. This pattern is more important at higher price levels. It suggests to liquidate long positions but it is yet early for short positions.
A confirmation of the reversal on the fourth day would provide the needed proof that the uptrend has reversed. A confirmation of the trend reversal by a black candlestick, a large gap down or by a lower close on the next trading day is suggested.
More people also wanted control over their retirement funds. Those with Defined-Benefit Plans must make their own investment choices and this increases the exposure to stocks.
Marubozu Candlesticks
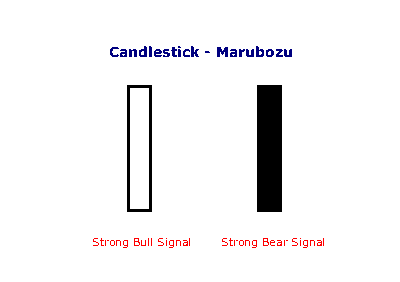
Marubozu are even stronger bull or bear signals than long lines as they show that buyers/sellers have remained in control from the open to the close -- there are no intra-day retracements.
$ARCS Profile on PST - For All Your DD Use More http://www.pennystocktweets.com/stocks/stockprofile/ARCS
Stage 4 marks a period of full expansion. Both stocks and commodities are rising, but bonds turn lower because the expansion increases inflationary pressures. Interest rates start moving higher to combat inflationary pressures.
For All Your $CRTP DD ~ Use PennyStock Tweets
http://www.pennystocktweets.com/stocks/profile/CRTP
When supply and demand are equal, prices move sideways as bulls and bears slug it out for control.
Shooting Star
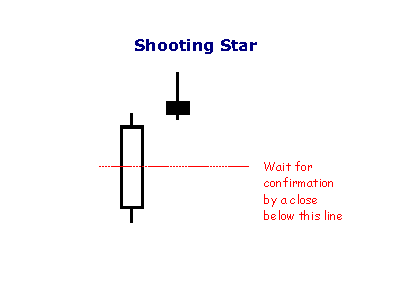
The shooting star is a type of bearish reversal pattern. The Shooting Star looks exactly the same as the Inverted hammer, but instead of being found in a downtrend it is found in an uptrend and thus has different implications. Like the Inverted hammer it is made up of a candle with a small lower body, little or no lower wick, and a long upper wick that is at least two times the size of the lower body.
The long upper wick of the candlestick pattern indicates that the buyers drove prices up at some point during the period in which the candle was formed but encountered selling pressure which drove prices back down for the period to close near to where they opened. As this occurred in an uptrend the selling pressure is seen as a potential reversal sign. When encountering this pattern traders will look for a lower open on the next period before considering the pattern valid and potentially including it in their trading strategy.
As with the Inverted hammer most traders will see a longer wick as a sign of a greater potential reversal and like to see an increase in volume on the day the Shooting Star forms.
More On $HLNT At PennyStock Tweets
http://www.pennystocktweets.com/stocks/profile/HLNT
Stocks in the consumer discretionary sector represent products that are optional. These industry groups include apparel retailers and produces, shoe retailers and produces, restaurants and autos.
DEF 14A~ SEC Filings Explained
A proxy statement is a statement required of a firm when soliciting shareholder votes. This statement is filed in advance of the annual meeting. The firm needs to file a proxy statement, otherwise known as a Form DEF 14A (Definitive Proxy Statement), with the U.S. Securities and Exchange Commission. This statement is useful in assessing how management is paid and potential conflict-of-interest issues with auditors. The statement includes:
? Voting procedure and information.
? Background information about the company's nominated directors including relevant history in the company or industry, positions on other corporate boards, and potential conflicts in interest.
? Board compensation.
? Executive compensation, including salary, bonus, non-equity compensation, stock awards, options, and deferred compensation. Also, information is included about perks such as personal use of company aircraft, travel, and tax gross-ups. Many companies will also include pre-determined payout packages for if an executive leaves the company.
? Who is on the audit committee, as well as a breakdown of audit and non-audit fees paid to the auditor.
SEC proxy rules: The term "proxy statement" means the statement required by Section 240.14a-3(a) whether or not contained in a single document.
In many cases, shareholder votes - particularly institutional shareholder votes - are determined by proxy firms which advise the shareholders...
Traditionally, broker-dealers have been permitted to vote for "routine" proposals on behalf of their shareholders if the shareholders do not return the proxy statement. This has been controversial, and in 2006 the NYSE Proxy Working Group recommended that the rules be modified so that uncontested director elections were not considered routine.[1] The SEC approved the rule on July 1, 2009.[2]
In July 2010, the SEC announced that it was seeking public comment on the efficiency of the proxy system.[3]
There has been some controversy over "proxy access" which is a method to allow shareholders to nominate candidates which appear on the proxy statement. Currently, only the nominating board can place candidates on the proxy statement. The United States Dodd–Frank Wall Street Reform and Consumer Protection Act specifically allowed the SEC to rule on this issue. In 2010, the SEC passed a rule which allowed certain shareholders to place candidates on the proxy statement,;[4] however, the rule was struck down by the United States Court of Appeals for the District of Columbia Circuit in 2011
For All Your $DEYU DD ~ Use PennyStock Tweets
http://www.pennystocktweets.com/stocks/profile/DEYU
In a normal distribution, 99.7% of all these returns would be within ±3 standard deviations of the mean. This, however, is not the case for stock returns. Instead, the distribution has fat tails (black dotted lines).
Form 1-E AD, 1-E AD/A ~ SEC Filings Explained
Sales material filed pursuant to Rule 607 under Regulation E. (and amendment thereto)
Check Out $MNEAF On PennyStock Tweets
http://www.pennystocktweets.com/stocks/profile/MNEAF
Moving Average Lengths and Timeframes
The length of the moving average depends on the analytical objectives. Short moving averages (5-20 periods) are best suited for short-term trends and trading. Chartists interested in medium-term trends would opt for longer moving averages that might extend 20-60 periods. Long-term investors will prefer moving averages with 100 or more periods.
Some moving average lengths are more popular than others. The 200-day moving average is perhaps the most popular. Because of its length, this is clearly a long-term moving average. Next, the 50-day moving average is quite popular for the medium-term trend. Many chartists use the 50-day and 200-day moving averages together. Short-term, a 10-day moving average was quite popular in the past because it was easy to calculate. One simply added the numbers and moved the decimal point.
Highs and Lows
Support can be established with the previous reaction lows. Resistance can be established by using the previous reaction highs.

Vipers
Just like iShares are Barclay's brand of ETFs, VIPERs are Vanguard's brand of the financial instrument. Vipers, or Vanguard Index Participation Receipts, are structured as share classes of open-end funds. Vanguard also offers dozens upon dozens of ETFs for many different areas of the market including the financial, healthcare and utilities sectors.
More On $MEDT At PennyStock Tweets
http://www.pennystocktweets.com/stocks/profile/MEDT
The most recurring height (value) would be in the middle and the remaining heights would be equally distributed on either side. Furthermore, 68.5% of all values would fall within ±1 standard deviation of the mean, 95.4% would fall within ±2 standard deviations and 99.7% would fall within ±3 standard deviations. The solid black line shows a typical bell curve with a normal distribution

BEARISH TRI STAR
The Bearish Deliberation Pattern is a derivative of the Bearish Three White Soldiers Pattern. This pattern also shows a weakness similar to the Bearish Advance Block Pattern since it becomes weaker in a short period of time. However here the weakness occurs all at once on the third day. The small third body of the pattern shows that the rally is losing strength and a reversal is possible.

Recognition Criteria:
1. Market is characterized by uptrend.
2. We see three Dojis on three consecutive days.
3. The second day Doji has a gap above the first and third.
Explanation:
The Bearish Tri Star Pattern appears in a market characterized by uptrend for a long time. When the trend starts to show weakness, we see smaller real bodies. The first Doji is already a matter of considerable concern. The second Doji shows that market now lost its direction. Finally, the third Doji announces the end of uptrend since this now shows utmost indecision leading to reversal of the positions.
Important Factors:
A confirmation on the fourth day is required to show that the uptrend has reversed. This may be in the form of a black candlestick, a large gap down or a lower close on the fourth day.
For All Your $ERBB DD ~ Use PennyStock Tweets
http://www.pennystocktweets.com/stocks/profile/ERBB
In an inflationary environment, stocks react positively to falling interest rates (rising bond prices). Low interest rates stimulate economic activity and boost corporate profits.
BULLISH LADDER BOTTOM
The shorts may have a chance to close their positions and realize their profits by the fourth day of a considerable downtrend. Then we see an upward gap on the fifth day as a result of this. If the body of the fifth day is long, or the volume of trading is high, this may also imply a bullish reversal.

Recognition Criteria:
1. Market is characterized by downtrend.
2. We see three long black candlesticks characterized by consecutively lower opens and a closing sequence just like the Bearish Three Black Crows Pattern.
3. Then we see a black candlestick on the fourth day with an upper shadow.
4. Finally we see a white candlestick opening above the body of the fourth day on the fifth day.
Explanation:
There is a considerable downtrend for some time and the bears are happy. Then we see a good move downward. Prices start trading above the opening price and almost reaching to the new high of the previous day, but then they close at another new low. This action is a warning for shorts telling them that the market will not go down forever. The shorts may then be forced to reevaluate their positions and they may start closing their positions on the next day if profits are good. This act is the reason behind the upward gap we see on the last day of the pattern and also the close is considerably higher. If volume is high on the last day, a trend reversal has probably occurred.
Important Factors:
A confirmation on the sixth day is suggested in the form a white candlestick, a large gap up or a higher close, to be sure that the market has reversed.
For All Your $GDSI DD ~ Use PennyStock Tweets
http://www.pennystocktweets.com/stocks/profile/GDSI
If a security is approaching a resistance level, it can act as an alert to look for signs of increased selling pressure and potential reversal.
BEARISH MEETING LINES
Market may gap up sharply as it opens but it closes unchanged from the prior session’s close during an uptrend. Such a pattern is called Bearish Meeting Lines Pattern, which is a pattern that reflects a balance between the bulls and the bears.

Recognition Criteria:
1. Market is characterized by uptrend.
2. We see a long white candlestick in the first day.
3. Then we see a long black candlestick, which has a body that is also higher than the previous trend on the second day.
4. The close of both days is same or almost same.
5. Both of the candlesticks are long but second day candlestick may be shorter than the first.
Explanation:
The Bearish Meeting Lines Pattern is a top reversal pattern suggesting a stall in uptrend. The first candlestick, a long white one, shows that the bullish momentum is going on. The next day opens higher with a gap but then the bears pull prices down to the prior day’s close. So the initial optimism on the second day’s opening now turns into concern of the longs.
Important Factors:
The Bearish Meeting Lines Pattern is similar to the Bearish Dark Cloud Cover Pattern. The Dark Cloud Cover has the same two-candlestick pattern. The main difference between the two is the fact that the bearish counterattack line does not usually move into the prior session’s white real body. It just gets back to prior session’s close. The Bearish Dark Cloud Cover Pattern’s second line pushes well into the white real body. So the Dark Cloud Cover Pattern is a more important top reversal signal than the Bearish Meeting Lines Pattern.
A confirmation on third day is required to be sure that the uptrend has reversed. This confirmation may be in the form a black candlestick, a large gap down or a lower close on the third day.
For All Your $DROP DD ~ Use PennyStock Tweets
http://www.pennystocktweets.com/stocks/profile/DROP
Malkiel offers two popular investment theories that correspond to fundamental analysis and technical analysis. On the fundamental side, the Firm-Foundation Theory argues that stocks have an intrinsic value that can be ascertained by discounting future cash flows (earnings).
Exponential Moving Average (EMA)
EMA helps with the lag we get on Simple Moving Averages (SMA) by giving more weight to the more recent price information. The weight given to the most recent price will depend on the number of periods in the moving average. EMA is calculated using 3 steps:
1st - get the SMA by adding the closing prices over the specified period i.e. 5 SMA on a daily chart is the closing price each day over a 5 day period, divided by 5.
2nd - Calculate the weighting multiplier by dividing 2 by the time period 1 and multiplying that answer by 100 to get the percentage i.e. 5 EMA = 2/(5 1) = 0.3333 X 100 = 33.33%
3rd - Calculate the EMA using the % that applies to the time period you are using. Here is the formula:
EMA: {Close - EMA(previous day)} x multiplier EMA(previous day).
Your head may be hurting right now, don't worry most trading platforms will calculate the EMA for you. The important thing is that you remember that the lagging we get with SMA is counteracted with the EMA, giving us a stronger trend indicator.
For those of you who are math freaks like myself, below is an example of how to calculate EMA:
A 10-period exponential moving average applies an 18.18% weighting to the most recent price. A 10-period EMA can also be called an 18.18% EMA. A 20-period EMA applies a 9.52% weighing to the most recent price (2/(20 1) = .0952). Notice that the weighting for the shorter time period is more than the weighting for the longer time period. In fact, the weighting drops by half every time the moving average period doubles.
Below is a spreadsheet example of a 10-day simple moving average and a 10-day exponential moving average for Intel. Simple moving averages are straight forward and require little explanation. The 10-day average simply moves as new prices become available and old prices drop off. The exponential moving average starts with the simple moving average value (22.22) in the first calculation. After the first calculation, the normal formula takes over. Because an EMA begins with a simple moving average, its true value will not be realized until 20 or so periods later. In other words, the value on the excel spreadsheet may differ from the chart value because of the short look-back period. This spreadsheet only goes back 30 periods, which means the affect of the simple moving average has had 20 periods to dissipate.

Below is an example of a chart with both the SMA
The 1960's were punctuated by a baby boom, the proliferation of television and low inflation. And finally, the 1990s saw the Internet boom, low inflation, the new economy and the alleged end of the business cycle
$DIAAF Profile on PST - For All Your DD Use More http://www.pennystocktweets.com/stocks/stockprofile/DIAAF
BULLISH HOMING PIGEON
Bullish Homing Pigeon Pattern is a small black real body contained by a prior relatively long black real body.
Recognition Criteria:
1. Market is in downtrend.
2. We see a black body in the first day.
3. Then we again see a black body in the second day where the real body of this second day is completely engulfed by the real body of the first day. It is not required that the shadows (high/low) of the second candlestick are contained within the first, though it's preferable if they are.
Explanation:
The Bullish Homing Pigeon Pattern is a signal of disparity. In a market characterized by downtrend, we first see heavy selling reflected by the long, black real body of the first day. However small body of second day points out to diminished power and enthusiasm of the sellers thus suggesting a trend reversal.
Important Factors:
The important fact about this pattern is the requirement that the second day has a minute real body relative to the prior candlestick and that this small body is completely contained by the larger one. The Bullish Homing Pigeon Pattern is not necessarily a signal for a rally. Market usually has a tendency to enter into a congestion phase following a Homing Pigeon.
We must check the third day to confirm that the downtrend has reversed. This confirmation may be in the form of a white candlestick, a large gap up or a higher close on the next trading day (on the third day).
$ETLS Profile on PST - For All Your DD Use More http://www.pennystocktweets.com/stocks/stockprofile/ETLS
Because long-term charts (typically 1-4 years) cover a longer time frame with compressed data, price movements do not appear as extreme and there is often less noise.
Form N-1A ~ SEC Filings Explained
Initial registration statement for open-end management investment companies
|
Followers
|
3288
|
Posters
|
|
|
Posts (Today)
|
0
|
Posts (Total)
|
2804248
|
|
Created
|
08/22/10
|
Type
|
Free
|
| Moderator Nilbud | |||
| Assistants mick ManicTrader PhotoChick Kirimi $Pistol Pete$ | |||
   Investor Hub Alerts: Sign up for 'STOCKGOODIES PLAYS OF THE WEEK ' E-Mail List Investor Hub Alerts: Sign up for 'STOCKGOODIES PLAYS OF THE WEEK ' E-Mail ListUPDATE; 5-1-22 courtesy of charting /\ wit tweezer top calls /\ Tony @Montana_Trades Really good study sheet on Candlestick Patterns [-chart]pbs.twimg.com/media/FRn8188XMAAdZvk?format=jpg&name=small[/chart] 

02-07-2021
|
|
Posts Today
|
0
|
|
Posts (Total)
|
2804248
|
|
Posters
|
|
|
Moderator
|
|
|
Assistants
|
| Volume | |
| Day Range: | |
| Bid Price | |
| Ask Price | |
| Last Trade Time: |


