 News
News  Market Data
  Discover

Support: 888-992-3836
Copyright © 2023 InvestorsHub Inc.


Register for free to join our community of investors and share your ideas. You will also get access to streaming quotes, interactive charts, trades, portfolio, live options flow and more tools.
When the stock failed to advance past 42.5, the resistance level was confirmed. The stock subsequently traded up to 42.5 two more times after that and failed to surpass resistance both times.
Keep an eye out for after hours trading gaps. Stock price gaps after-hours can cause the stock to trade through the stop loss order trigger price causing the order to miss altogether. This is can spell bad news for any investor's position 
For All Your $MPPCQ DD ~ Use PennyStock Tweets
http://www.pennystocktweets.com/stocks/profile/MPPCQ

There were still two more opportunities (days) to get in on the action. On the third day after the breakout, the stock gapped up and moved above 56.
Tweezer Bottoms

The Tweezer Bottom formation is a bullish reversal pattern seen at the bottom of downtrends.
Tweezer Bottom formation consists of two candlesticks:
Bearish Candle (Day 1)
Bullish Candle (Day 2)
Sometimes Tweezer Bottoms have three candlesticks.
A bullish Tweezer Bottom occurs during a downtrend when bears continue to take prices lower, usually closing the day near the lows (a bearish sign). Nevertheless, Day 2 is completely opposite because prices open and go nowhere but upwards. This bullish advance on Day 2 sometimes eliminates all losses from the previous day.

The bears pushed the price of Exxon-Mobil (XOM) downwards on Day 1; however, the market on Day 2 opened where prices closed on Day 1 and went straight up, reversing the losses of Day 2. A buy signal would generally be given on the day after the Tweezer Bottom, assuming the candlestick was bullish green.
The Tweezer Top and Bottom reversal pattern is extremely helpful because it visually indicates a transfer of power and sentiment from the bulls and the bears. Of course other technical indicators should be consulted before making a buy or sell signal based on the Tweezer patterns. 
Where does Wallstreet get their whisper numbers try here http://www.whispernumber.com/ .
$PDOS Profile on PST - For All Your DD Use More http://www.pennystocktweets.com/stocks/stockprofile/PDOS
Support and Resistance Zones
Because technical analysis is not an exact science, it is useful to create support and resistance zones. This is contrary to the strategy mapped out for Lucent Technologies (LU), but it is sometimes the case.
$GAEC Profile on PST - For All Your DD Use More http://www.pennystocktweets.com/stocks/stockprofile/GAEC
Successful traders isolate themselves from the opinions of others.
When supply and demand are equal, prices move sideways as bulls and bears slug it out for control.
BULLISH BREAKAWAY
There is a downtrend but we also see that the prices bottom out and level off now. The result is a long white candlestick that however does not close the initial downward gap of the first and second days. This suggests a short-term reversal.
Recognition Criteria:
1. Market is characterized by downtrend.
2. We see a long black candlestick in the first day.
3. Then we see a black candlestick on the second day with a gap below the first day.
4. Bearish mood continues on the third and fourth days as evidenced by lower consecutive closes.
5. Finally however, we see a long white candlestick on the fifth day characterized by a closing price inside the gap caused by the first and second days.
Explanation:
The Bullish Breakaway Pattern appears during a downtrend and it shows that selling accelerated to the point of an oversold market. It starts with a long black day then involves a gap in the direction of the downtrend followed by three consecutively lower price days. So far, all days in this pattern are black with the exception of the third day, which can be either be black or white. The three days after the gap are similar to the Three Black Crows pattern since their highs and lows are each consecutively lower. It is by now apparent that the downtrend has accelerated with a big gap and then starts to fizzle, however it still continues. There is an evident slow deterioration of the downtrend suggested by this pattern. Finally, we see a burst in the opposite direction, which completely recovers the previous three days' price action. The gap is not filled which points out to the weakness of the reversal. This is a short-term reversal.
Important Factors:
A confirmation on the sixth day is recommended in the form of a white candlestick, a large gap up or a higher close, to be sure about the reversal.
Use PennyStock Tweets For All Your $BFCF DD
http://www.pennystocktweets.com/stocks/profile/BFCF
Even though there is a long black candlestick indicating an open at 59, the stock fell so fast that it was impossible to exit above 44.
You should check daily at OTC markets to see if your stock has filed a 14-C for potential reverse splits and other valuable information
List of Direxion ETF’s
Symbol Fund Index/Benchmark Daily Target Bloomberg Index Symbol
Long Term Investment
ETFs
KNOW
Direxion All Cap Insider Sentiment Shares
Sabrient Multi-Cap Insider/Analyst Quant-Weighted Index - SBRQAM
INSD
Direxion Large Cap Insider Sentiment Shares
Sabrient Large-Cap Insider/Analyst Quant-Weighted Index - SBRQAL
VSPY
Direxion S
More On $MSVS At PennyStock Tweets
http://www.pennystocktweets.com/stocks/profile/MSVS
The high and low are represented by the top and bottom of the vertical bar and the close is the short horizontal line crossing the vertical bar.
Form N-2 ~ SEC Filings Explained
Initial filing of a registration statement on Form N-2 for closed-end investment companies
The deepest secret for the trader is to subordinate his will to the will of the market. The market is truth as it reflects all forces that bear upon it. As long as he recognizes this he is safe. When he ignores this, he is lost and doomed.
For All Your $BRYN DD ~ Use PennyStock Tweets
http://www.pennystocktweets.com/stocks/profile/BRYN
Once you have chosen a particular charting methodology, it is probably best to stick with it and learn how best to read the signals.
Choose only reputable brokers – Potential penny stock investors can improve their chances of a legitimate investment by researching their brokers as well as the stocks themselves. By taking the time to make sure the broker and the firm he or she belongs to have been registered with the SEC, can do business in a particular state, and have no complaints filed against them with the state securities regulator, investors can protect their money and increase the odds of finding a winner.
Rising Three Methods
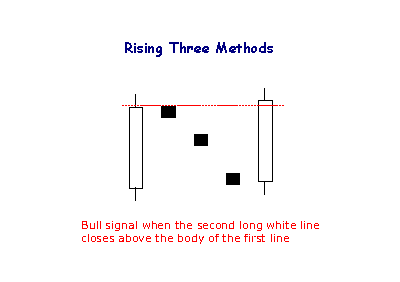
The Rising Method consists of two strong white lines bracketing 3 or 4 small declining black candlesticks. The final white line forms a new closing high. The pattern is definitely bullish.
$PARA Profile on PST - For All Your DD Use More http://www.pennystocktweets.com/stocks/stockprofile/PARA
While technical analysts use charts almost exclusively, the use of charts is not limited to just technical analysis.
The simplest and most common type of stock trade is a market order. Market orders simply tell your broker that you are willing to take whatever price is presented to you when your order is executed. These orders are often subject to the lowest commission since they are the easiest to execute.
Form TA-2 ~ SEC Filings Explained
Annual report of transfer agent activities filed pursuant to the Securities Exchange Act of 1934
New era economic thinking was also cited by Shiller as a cultural factor that contributed to the stock market bubble. New era thinking is not new. Stock market advances in the late 1800s, 1920's and 1960's were also facilitated by new era thinking.

Use PennyStock Tweets For All Your $CRCUF DD
http://www.pennystocktweets.com/stocks/profile/CRCUF
Do more of that which is working for you , there are so many different ways to play the market.
BULLISH MEETING LINES
We sometimes see that market gaps sharply lower when it opens and then closes at the same level as the prior session’s close. This is seen following a black candlestick in a downtrend. Such an occurrence is called Bullish Meeting Lines Pattern that is a pattern reflecting a stalemate between bulls and bears.

Recognition Criteria:
1. Market is characterized by downtrend.
2. We see a black candlestick on the first day.
3. Then we see a long white candlestick on the second day. Its body is lower than the previous trend.
4. The closing prices are same or almost same on both days.
5. Both candlesticks are long but the second candlestick may be shorter than the first.
Explanation:
This pattern appears during a decline. The first candlestick of this pattern is long and black. However the next session opens sharply lower causing the bears to feel confident. Then the bulls start a counterattack pushing the prices up and leading to a close equal to previous close. The downtrend is now breached.
Important Factors:
The Bullish Meeting Lines Pattern is a pattern that is comparable to the Bullish Piercing Line Pattern. The Piercing Line has the same two-candlestick pattern. The main difference between the two is the fact that the bullish counterattack does not carry the prices up to the prior session’s white real body in the case of Bullish Meeting Lines Pattern. It can only get back to prior session’s close while The Piercing Line Pattern’s second line pushes well into the black real body. Consequently the Piercing Line Pattern is a more significant bottom reversal. Nonetheless, the Bullish Meeting Lines Pattern should also be respected.
The Bullish Meeting Lines Pattern requires confirmation of the reversal on the third day. This confirmation may be in the form of a white candlestick, a large gap up or a higher close on the third day.
A graphical historical record makes it easy to spot the effect of key events on a security's price, its performance over a period of time and whether it's trading near its highs, near its lows, or in between.
More On $NWMT At PennyStock Tweets
http://www.pennystocktweets.com/stocks/profile/NWMT
Position Sizing – How much to buy or sell The decision about how much to buy or sell is absolutely fundamental, and yet is often glossed over or handled improperly by most traders.
LONG LEGGED DOJI
Long Legged Doji is a doji characterized with very long shadows. It shows the indecision of the buyers and sellers. It is one of the important reversal signals.

Recognition Criteria:
1. Market is characterized by a bearish mood and downtrend.
2. Then we see a Doji that gaps in the direction of the downtrend.
3. The real body is either a horizontal line or it is significantly small.
4. Both of the upper and lower shadows are long and they are almost equal in length.
Explanation:
Long Legged Doji shows that there is a great deal of confusion and indecision in the market. This particular pattern shows that the prices moved well above and below the day's opening level, however they finally closed virtually at the same level with the opening price. The end result is only a little change from the opening price despite the whole volatility and excitement during the day that clearly reflects that the market lost its sense of direction.
Important Factors:
Long Legged Doji is more important at tops.
Long Legged Doji is a single candlestick pattern. It requires confirmation in the form of a move opposite to the prior trade on the next trading day.
The market peak and downturn are followed by a contraction in the economy. At this stage, the Fed starts to lower interest rates and the yield curve steepens.
For All Your $NILA DD ~ Use PennyStock Tweets
http://www.pennystocktweets.com/stocks/profile/NILA
Never use stop loss orders for active trading. For investors that watch their screens all day and are involved in day trading a stop loss order serves little purpose.
Form NT 10-Q ~ SEC Filings Explained
Notice under Rule 12b25 of inability to timely file all or part of a form 10-Q or 10-QSB
More On $SHMX At PennyStock Tweets
http://www.pennystocktweets.com/stocks/profile/SHMX
In Nov/Dec-99, Lucent Technologies (LU)[Lu] formed a trading range that resembled a head and shoulders pattern (red oval). When the stock broke support at 60, there was little or no time to exit.
Technical analysis involves learning to read a stock's price and volume chart and timing your decisions properly.
Form T-3 ~ SEC Filings Explained
Initial application for qualification of trust indentures
More On $MAXE At PennyStock Tweets
http://www.pennystocktweets.com/stocks/profile/MAXE
Falling prices reflect decreasing demand and a weak economy. The chart below shows a clear positive relationship between industrial metals and the S
Greed Is Your Worst Enemy
There's an old saying on Wall Street that "pigs get slaughtered." This greed in investors causes them to hang on to winning positions too long, trying to get every last tick. This trait can be devastating to returns because the trader is always running the risk of getting whipsawed or blown out of a position.
$WTAR Profile on PST - For All Your DD Use More http://www.pennystocktweets.com/stocks/stockprofile/WTAR
Walking the Bands
Moves above or below the bands are not signals as such. As Bollinger puts it, moves that touch or exceed the bands are not signals, but rather "tags". On the face of it, a move to the upper band shows strength, while a sharp move to the lower band shows weakness. Momentum oscillators work much the same way. Overbought is not necessarily bullish. It takes strength to reach overbought levels and overbought conditions can extend in a strong uptrend. Similarly, prices can "walk the band" with numerous touches during a strong uptrend. Think about it for a moment. The upper band is 2 standard deviations above the 20-period simple moving average. It takes a pretty strong price move to exceed this upper band. An upper band touch that occurs after a Bollinger Band confirmed W-Bottom would signal the start of an uptrend. Just as a strong uptrend produces numerous upper band tags, it is also common for prices to never reach the lower band during an uptrend. The 20-day SMA sometimes acts as support. In fact, dips below the 20-day SMA sometimes provide buying opportunities before the next tag of the upper band.

The chart above shows Air Products (APD) with a surge and close above the upper band in mid July. First, notice that this is a strong surge that broke above two resistance levels. A strong upward thrust is a sign of strength, not weakness. Trading turned flat in August and the 20-day SMA moved sideways. The Bollinger Bands narrowed, but APD did not close below the lower band. Prices, and the 20-day SMA, turned up in September. Overall, APD closed above the upper band at least five times over a four month period. The indicator window shows the 10-period Commodity Channel Index (CCI). Dips below -100 are deemed oversold and moves back above -100 signal the start of an oversold bounce (green dotted line). The upper band tag and breakout started the uptrend. CCI then identified tradable pullbacks with dips below -100. This is an example of combining Bollinger Bands with a momentum oscillator for trading signals.
|
Followers
|
3286
|
Posters
|
|
|
Posts (Today)
|
0
|
Posts (Total)
|
2804248
|
|
Created
|
08/22/10
|
Type
|
Free
|
| Moderator Nilbud | |||
| Assistants mick ManicTrader PhotoChick Kirimi $Pistol Pete$ | |||
   Investor Hub Alerts: Sign up for 'STOCKGOODIES PLAYS OF THE WEEK ' E-Mail List Investor Hub Alerts: Sign up for 'STOCKGOODIES PLAYS OF THE WEEK ' E-Mail ListUPDATE; 5-1-22 courtesy of charting /\ wit tweezer top calls /\ Tony @Montana_Trades Really good study sheet on Candlestick Patterns [-chart]pbs.twimg.com/media/FRn8188XMAAdZvk?format=jpg&name=small[/chart] 

02-07-2021
|
|
Posts Today
|
0
|
|
Posts (Total)
|
2804248
|
|
Posters
|
|
|
Moderator
|
|
|
Assistants
|
| Volume | |
| Day Range: | |
| Bid Price | |
| Ask Price | |
| Last Trade Time: |


