 News
News  Market Data
  Discover
Support: 888-992-3836
Copyright © 2023 InvestorsHub Inc.


Register for free to join our community of investors and share your ideas. You will also get access to streaming quotes, interactive charts, trades, portfolio, live options flow and more tools.
It would appear that some sort of timing mechanism is needed to avoid the big declines and participate in the big advances. Hmm… sounds like technical analysis!

To trade successfully, think like a fundamentalist; trade like a technician. It is imperative that we understand the fundamentals driving a trade, but also that we understand the market's technicals. When we do, then, and only then, can we or should we, trade.
Form 15-15D, 15-15D/A ~ SEC Filings Explained
Notice of suspension of duty to file reports pursuant to Section 13 and 15(d) of the Act (and amendment thereto)

For All Your $LNXGF DD ~ Use PennyStock Tweets
http://www.pennystocktweets.com/stocks/profile/LNXGF

Russia and China come to mind over the last 20 years. George W. Bush promoted the ownership society by advocating property and stocks for all.
A combination of fundamental and technical investment styles is essential to picking winning stocks. 
Exponential Moving Average (EMA)
EMA helps with the lag we get on Simple Moving Averages (SMA) by giving more weight to the more recent price information. The weight given to the most recent price will depend on the number of periods in the moving average. EMA is calculated using 3 steps:
1st - get the SMA by adding the closing prices over the specified period i.e. 5 SMA on a daily chart is the closing price each day over a 5 day period, divided by 5.
2nd - Calculate the weighting multiplier by dividing 2 by the time period 1 and multiplying that answer by 100 to get the percentage i.e. 5 EMA = 2/(5 1) = 0.3333 X 100 = 33.33%
3rd - Calculate the EMA using the % that applies to the time period you are using. Here is the formula:
EMA: {Close - EMA(previous day)} x multiplier EMA(previous day).
Your head may be hurting right now, don't worry most trading platforms will calculate the EMA for you. The important thing is that you remember that the lagging we get with SMA is counteracted with the EMA, giving us a stronger trend indicator.
For those of you who are math freaks like myself, below is an example of how to calculate EMA:
A 10-period exponential moving average applies an 18.18% weighting to the most recent price. A 10-period EMA can also be called an 18.18% EMA. A 20-period EMA applies a 9.52% weighing to the most recent price (2/(20 1) = .0952). Notice that the weighting for the shorter time period is more than the weighting for the longer time period. In fact, the weighting drops by half every time the moving average period doubles.
Below is a spreadsheet example of a 10-day simple moving average and a 10-day exponential moving average for Intel. Simple moving averages are straight forward and require little explanation. The 10-day average simply moves as new prices become available and old prices drop off. The exponential moving average starts with the simple moving average value (22.22) in the first calculation. After the first calculation, the normal formula takes over. Because an EMA begins with a simple moving average, its true value will not be realized until 20 or so periods later. In other words, the value on the excel spreadsheet may differ from the chart value because of the short look-back period. This spreadsheet only goes back 30 periods, which means the affect of the simple moving average has had 20 periods to dissipate.

Below is an example of a chart with both the SMA
$CRTP Profile on PST - For All Your DD Use More http://www.pennystocktweets.com/stocks/stockprofile/CRTP
The move out of stocks and into Treasuries greatly reduces risk because one is not exposed to riskier stocks. There have been a few big bad bear markets over the years and preserving capital is one of the keys to investment success.

In Penny Stocks never risk more than 10% of your account equity on any one investment, trade, or recommendation.This is for any trading you do on your own. The only exceptions: Long-term core positions where you are not using any kind of leverage or margin.
Use PennyStock Tweets For All Your $CMRZF DD
http://www.pennystocktweets.com/stocks/profile/CMRZF
Three White Soldiers (Bullish)
Bullish Three White Soldiers Pattern is indicative of a strong reversal in the market. It is characterized by three long candlesticks stepping upward like a staircase. The opening of each day is slightly lower than previous close rallying then to a short term high.
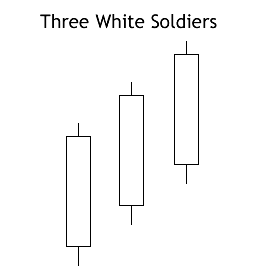
Recognition Criteria:
1. Market is characterized by downtrend.
2. We see three consecutive long white candlesticks.
3. Each candlestick closes at a new high.
4. The opening of each candlestick is within the body of the previous day.
5. Each consecutive day closes near or at its highs.
Explanation:
The Bullish Three White Soldiers Pattern appears in a context where the market stayed at a low price for too long. The market is still falling down and it is now approaching a bottom or already at bottom. Then we see a decisive attempt upward shown by the long white candlestick. Rally continues in the next two days characterized by higher closes. Bears are now forced to cover short positions.
Important Factors:
The opening prices of the second and third days can be anywhere within the previous day's body. However, it is better to see the opening prices above the middle of the previous day's body.
If the white candlesticks are very extended, one should be cautious about an overbought market.
The reliability of this pattern is very high, but still a confirmation in the form of a white candlestick with a higher close or a gap-up is suggested.
Stage 5 marks a peak in economic growth and the stock market. Even though the expansion continues, the economy grows at a slower pace because rising interest rates and rising commodity prices take their toll. Stocks anticipate a contraction phase by peaking before the expansion actually ends. Commodities remain strong and peak after stocks.
For All Your $HRRN DD ~ Use PennyStock Tweets
http://www.pennystocktweets.com/stocks/profile/HRRN
When screening for a good penny stock to trade you should look for positive single day movers with higher than average volume.
SPDRs
Usually referred to as spiders, these investment instruments bundle the benchmark S
Plan your strategy by taking one step further than what you’re trading actively while maintaining a close watch on a trend in a particular time period all the time. Utilizing a trading chart, try to be completely aware of weekly and monthly trends.
As interest rates fall and the economy strengthens, demand for commodities increases and commodity prices rise. Keep in mind that an "inflationary environment" does not mean runaway inflation. It simply means that the inflationary forces are stronger than the deflationary forces.
$GDSI Profile on PST - For All Your DD Use More http://www.pennystocktweets.com/stocks/stockprofile/GDSI
Form S-8 ~ SEC Filings Explained
Initial registration statement for securities to be offered to employees pursuant to employee benefit plans
trading stocks requires many different methods, schemes, and styles.
Lo and MacKinlay used powerful computers and advanced econometric analysis to test the randomness of security prices. Although this book is a heavy read, the findings should be of interest to technical analysts and chartists. In short, this book documents the presence of predictable components in stock prices.
For All Your $AERO DD ~ Use PennyStock Tweets
http://www.pennystocktweets.com/stocks/profile/AERO
SEC Filings Explained ~ POS AM Form
Post-effective amendments to provide updated prospectus information.
If you don't like the market or have anything compelling to buy, it's never wrong to go with cash
Deflationary Relationships
Murphy notes that the world shifted from an inflationary environment to a deflationary environment around 1998. It started with the collapse of the Thai Baht in the summer of 1997 and quickly spread to neighboring countries to become known as Asian currency crisis.
$LTCH Profile on PST - For All Your DD Use More http://www.pennystocktweets.com/stocks/stockprofile/LTCH
Form N-30B-2 ~ SEC Filings Explained
Periodic and interim reports mailed to investment company shareholders
News sites such as Yahoo Finance and Google Finance serve as a great resource for new investors. By reading headline stories investors can expose themselves to different stock terms for example. Pulling quotes and observing fundamental data can also serve as another good source of exposure.
The 1995 Republican congress proposed cutting the capital gains tax and it was cut in 1997. Further cuts were proposed soon thereafter. These tax cuts as well as the anticipation of future capital gains tax cuts provided incentives to buy stocks.
For All Your $CAHI DD ~ Use PennyStock Tweets
http://www.pennystocktweets.com/stocks/profile/CAHI
SEC Filings Explained ~ Form 3
Form 3 is an SEC filing filed with the US Securities and Exchange Commission to indicate a preliminary insider transaction by an officer, director, or beneficial (10%) owner of the company's securities. These are typically seen after a company IPOs when insiders make their first transactions. After a Form 3 is filed, future filings of the same nature are filed under Form 4 (standard disclosure) or Form 5 (annual disclosure).
All three of these advances would appear as the same vertical distance on a logarithmic scale. Most charting programs refer to the logarithmic scale as a semi-log scale, because the time axis is still displayed arithmetically.

The chart above uses the 4th-Quarter performance of VeriSign to illustrate the difference in scaling. On the semi-log scale, the distance between 50 and 100 is the same as the distance between 100 and 200. However, on the arithmetic scale, the distance between 100 and 200 is significantly greater than the distance between 50 and 100.
Use PennyStock Tweets For All Your $MJNA DD
http://www.pennystocktweets.com/stocks/profile/MJNA
Don't get emotionally involved with your stocks. Follow a set of buying and selling rules, and don't let your emotions change your mind
BULLISH ENGULFING
Bullish Engulfing Pattern is a pattern characterized by a large white real body engulfing a preceding small black real body, which appears during a downtrend. The white body does not necessarily engulf the shadows of the black body but totally engulfs the body itself. The Bullish Engulfing Pattern is an important bottom reversal signal.
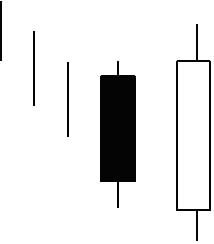
Recognition Criteria:
1. Market is characterized by downtrend.
2. Then we see a small black body.
3. Next day we see a white body that completely engulfs the black real body of the preceding day.
Explanation:
While the market sentiment is bearish; we see some subsided selling reflected by the short, black real body of the first day. Next day shows bull strength with a closing price at or above the previous day’s open. It means that the downtrend is now losing momentum and the bulls started to take the lead.
Important Factors:
The relative size of the bodies in the first and second days is important. If the first day of the Bullish Engulfing Pattern is characterized by a very small real body (it may even be a doji or nearly a doji) but the second day is characterized by a very long real body, this strongly indicates that the bearish power is diminishing and the disparity of white versus black body is indicative of the emerging bull power.
There is higher probability of a bullish reversal if there is heavy volume on the second real body or if the second day of the Bullish Engulfing Pattern engulfs more than one real body (which essentially means we see two or more small black bodies preceding the long white body).
The reversal of downtrend needs further confirmation on the third day. This confirmation may be in the form of a white candlestick, a large gap up or a higher close on the third day.
Check Out $HYDI On PennyStock Tweets
http://www.pennystocktweets.com/stocks/profile/HYDI
Don’t ever allow a big winning trade to turn into a loser. Stop yourself out if the market moves against you 20% from your peak profit point.
Stocks and many other securities are judged in relative terms through the use of ratios such as PE, Price/Revenues and Price/Book. With this in mind, it also makes sense to analyze price movements in percentage terms.
Form 20-F, 20-F/A ~ SEC Filings Explained
Annual and transition report of foreign private issuerspursuant to sections 13 or 15(d) (and amendment thereto)
Use PennyStock Tweets For All Your $EMWW DD
http://www.pennystocktweets.com/stocks/profile/EMWW
Bear markets are more violent than are bull markets and so also are their retracements.
Technicians, technical analysts and chartists use charts to analyze a wide array of securities and forecast future price movements.
Shadow and Tail
The shadow is the portion of the trading range outside of the body. We often refer to a candlestick as having a tall shadow or a long tail.
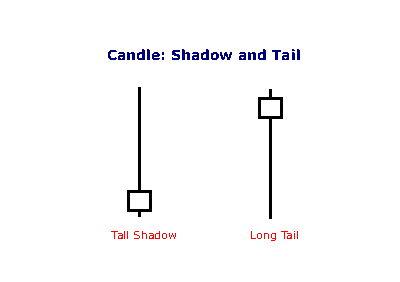
A tall shadow indicates resistance;
A long tail signals support.
A short sell order means you tell your broker to sell shares of stock that you don't own. If the stock falls, you can close the transaction with a buy-to-close order, replacing the borrowed stock and pocketing the difference.
$WLOL Profile on PST - For All Your DD Use More http://www.pennystocktweets.com/stocks/stockprofile/WLOL
A price rise due to a supply shock is negative for stocks, but a price rise due to rising demand can be positive for stocks. This is also true for industrial metals, which are less susceptible to these supply shocks.
Simple vs Exponential Moving Averages
Even though there are clear differences between simple moving averages and exponential moving averages, one is not necessarily better than the other. Exponential moving averages have less lag and are therefore more sensitive to recent prices - and recent price changes. Exponential moving averages will turn before simple moving averages. Simple moving averages, on the other hand, represent a true average of prices for the entire time period. As such, simple moving averages may be better suited to identify support or resistance levels.
Moving average preference depends on objectives, analytical style and time horizon. Chartists should experiment with both types of moving averages as well as different timeframes to find the best fit.
Below is an example of a chart with both the SMA
Day trading means buying and selling stocks and shares in a very short timescale, sometimes only minutes. All trades when daytrading happen within one market session (so stocks are never held overnight, for example). There are many systems used to day trade, and most aren’t very successful. In fact, the only system that has shown consistent success in daytrading is the one used by Wall Street professionals.
$GLDG Profile on PST - For All Your DD Use More http://www.pennystocktweets.com/stocks/stockprofile/GLDG
|
Followers
|
3286
|
Posters
|
|
|
Posts (Today)
|
0
|
Posts (Total)
|
2804248
|
|
Created
|
08/22/10
|
Type
|
Free
|
| Moderator Nilbud | |||
| Assistants mick ManicTrader PhotoChick Kirimi $Pistol Pete$ | |||
   Investor Hub Alerts: Sign up for 'STOCKGOODIES PLAYS OF THE WEEK ' E-Mail List Investor Hub Alerts: Sign up for 'STOCKGOODIES PLAYS OF THE WEEK ' E-Mail ListUPDATE; 5-1-22 courtesy of charting /\ wit tweezer top calls /\ Tony @Montana_Trades Really good study sheet on Candlestick Patterns [-chart]pbs.twimg.com/media/FRn8188XMAAdZvk?format=jpg&name=small[/chart] 

02-07-2021
|
|
Posts Today
|
0
|
|
Posts (Total)
|
2804248
|
|
Posters
|
|
|
Moderator
|
|
|
Assistants
|
| Volume | |
| Day Range: | |
| Bid Price | |
| Ask Price | |
| Last Trade Time: |


