 News
News  Market Data
  Discover
Support: 888-992-3836
Copyright © 2023 InvestorsHub Inc.


Register for free to join our community of investors and share your ideas. You will also get access to streaming quotes, interactive charts, trades, portfolio, live options flow and more tools.
This link will help thou $GFNL BarChart Trader's Cheat Sheet NITE-LYNX
http://www.barchart.com/cheatsheet.php?sym=GFNL

Random Walk vs Non-Random Walk
Pfizer (PFE) shows an example of three sizable trends emerging over a two year period. The stock was up over 50% in 2009, down around 25% in the first half of 2010 and up around 50% from July 2010 to March 2011.


Use PennyStock Tweets For All Your $CYUXF DD
http://www.pennystocktweets.com/stocks/profile/CYUXF

Losses make the trader studious – not profits. Take advantage of every loss to improve your knowledge of market action, go back and look at the chart and figure out why you were wrong.
This link will help thou $INCC BarChart Trader's Cheat Sheet NITE-LYNX
http://www.barchart.com/cheatsheet.php?sym=INCC
Line charts are also used when open, high and low data points are not available. Sometimes only closing data are available for certain indices, thinly traded stocks and intraday prices.
Check Out $FFFC On PennyStock Tweets
http://www.pennystocktweets.com/stocks/profile/FFFC
There is much more to the discipline of accepting your losses than simply realizing that you must do so. I strongly urge you to have a plan in mind with each trade that you make BEFORE execution. Know your loss tolerance and take steps to execute your discipline. 
NITE-LYNX $MDBX BarChart Trader's Cheat Sheet
http://www.barchart.com/cheatsheet.php?sym=MDBX
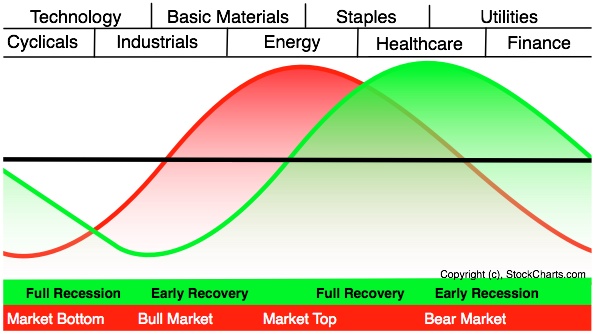
Sector Rotation
Unsurprisingly, the business cycle influences the rotation of stock market sectors and industry groups. Certain sectors perform better than others during specific phases of the business cycle. Knowing the stage of the business cycle can help investors position themselves in the right sectors and avoid the wrong
sectors.
Use PennyStock Tweets For All Your $ELRA DD
http://www.pennystocktweets.com/stocks/profile/ELRA
Day trading means buying and selling stocks and shares in a very short timescale, sometimes only minutes. All trades when daytrading happen within one market session (so stocks are never held overnight, for example). There are many systems used to day trade, and most aren’t very successful. In fact, the only system that has shown consistent success in daytrading is the one used by Wall Street professionals.
This link will help thou $ITEX BarChart Trader's Cheat Sheet NITE-LYNX
http://www.barchart.com/cheatsheet.php?sym=ITEX
All three of these advances would appear as the same vertical distance on a logarithmic scale. Most charting programs refer to the logarithmic scale as a semi-log scale, because the time axis is still displayed arithmetically.

The chart above uses the 4th-Quarter performance of VeriSign to illustrate the difference in scaling. On the semi-log scale, the distance between 50 and 100 is the same as the distance between 100 and 200. However, on the arithmetic scale, the distance between 100 and 200 is significantly greater than the distance between 50 and 100.
This link will help thou $CVRG BarChart Trader's Cheat Sheet NITE-LYNX
http://www.barchart.com/cheatsheet.php?sym=CVRG
The 1995 Republican congress proposed cutting the capital gains tax and it was cut in 1997. Further cuts were proposed soon thereafter. These tax cuts as well as the anticipation of future capital gains tax cuts provided incentives to buy stocks.
$AGIJ BarChart Technical Analysis
http://www.barchart.com/technicals/stocks/AGIJ
Bollinger Bands is a technical analysis tool invented by John Bollinger in the 1980s, and a term trademarked by him in 2011.
Form 10-Q~ SEC Filings Explained
Form 10-Q, (also known as a 10-Q or 10Q) is a quarterly report mandated by the United States federalSecurities and Exchange Commission, to be filed by publicly traded corporations.
Pursuant to Section 13 or 15(d) of the Securities Exchange Act of 1934, it's an SEC filing that must be filed quarterly with the US Securities and Exchange Commission. It contains similar information to the annual form 10-K, however the information is generally less detailed, and the financial statements are generally unaudited. Information for the final quarter of a firm's fiscal year is included in the 10-K, so only three 10-Q filings are made each year.
These reports generally compare last quarter to the current quarter and last years quarter to this years quarter. The SEC put this form in place to facilitate better informed investors. The form 10-Q must be filed within 40 days for large accelerated filers and accelerated filers or 45 days after the end of the fiscal quarter for all other registrants (formerly 45 days)

$LGBS BarChart Technical Analysis
http://www.barchart.com/technicals/stocks/LGBS
Keltner Channels are volatility-based envelopes set above and below an exponential moving average. This indicator is similar to Bollinger Bands, which use the standard deviation to set the bands. Instead of using the standard deviation, Keltner Channels use the Average True Range (ATR) to set channel distance.
13H, 13H-Q, 13H-A, 13H-I, 13H-R, 13H-T ~ SEC Filings Explained
Large Trader Registration Information Required of Large Traders Pursuant to the Securities Exchange Act of 1934 and Rule 13h-1 Thereunder. Initial Filing (13H), Amended Filing (13H-Q), Annual Filing (13H-A), Inactive Status (13H-I), Reactivated Status (13H-R), and Termination Filing (13H-T)
$HKWO BarChart Technical Analysis
http://www.barchart.com/technicals/stocks/HKWO
Coppock used monthly data to identify buying opportunities when the indicator moved from negative territory to positive territory. Although Coppock did not use it for sell signals, many technical analysts consider a cross from positive to negative territory as a sell signal.
Form NT 11-Q ~ SEC Filings Explained
Notice under Rule 12b25 of inability to timely file all or part of a form 11-K
$SATM BarChart Technical Analysis
http://www.barchart.com/technicals/stocks/SATM
Indicators based on channels, bands and envelopes are designed to encompass most price action. Therefore, moves above or below the channel lines warrant attention because they are relatively rare. Trends often start with strong moves in one direction or another. A surge above the upper channel line shows extraordinary strength, while a plunge below the lower channel line shows extraordinary weakness. Such strong moves can signal the end of one trend and the beginning of another.
BEARISH TRI STAR
The Bearish Deliberation Pattern is a derivative of the Bearish Three White Soldiers Pattern. This pattern also shows a weakness similar to the Bearish Advance Block Pattern since it becomes weaker in a short period of time. However here the weakness occurs all at once on the third day. The small third body of the pattern shows that the rally is losing strength and a reversal is possible.

Recognition Criteria:
1. Market is characterized by uptrend.
2. We see three Dojis on three consecutive days.
3. The second day Doji has a gap above the first and third.
Explanation:
The Bearish Tri Star Pattern appears in a market characterized by uptrend for a long time. When the trend starts to show weakness, we see smaller real bodies. The first Doji is already a matter of considerable concern. The second Doji shows that market now lost its direction. Finally, the third Doji announces the end of uptrend since this now shows utmost indecision leading to reversal of the positions.
Important Factors:
A confirmation on the fourth day is required to show that the uptrend has reversed. This may be in the form of a black candlestick, a large gap down or a lower close on the fourth day.
$ABBY BarChart Technical Analysis
http://www.barchart.com/technicals/stocks/ABBY
The triple-smoothed EMA is very different from a plain EMA. In a plain EMA the latest few days dominate and the EMA follows recent prices quite closely; however, applying it three times results in weightings spread much more broadly, and the weights for the latest few days are in fact smaller than those of days further past. The following graph shows the weightings for an N=10 triple EMA (most recent days at the left).
iShares MSCI Emerging Market Index (NYSE:EEM)
This investment attempts to mimic the returns seen in the MSCI Emerging Markets index which was created as an equity benchmark for international security performance. If you would like to gain some international exposure, specifically to emerging markets, this ETF might be for you.
$IVFH BarChart Technical Analysis
http://www.barchart.com/technicals/stocks/IVFH
MACD Bullish Signal Line Cross: This scan reveals stocks that are trading above their 200-day moving average and have a bullish signal line crossover in MACD. Also notice that MACD is required to be negative to insure this upturn occurs after a pullback. This scan is just meant as a starter for further refinement.
$BESV BarChart Technical Analysis
http://www.barchart.com/technicals/stocks/BESV
Candlestick Patterns
Long Lines
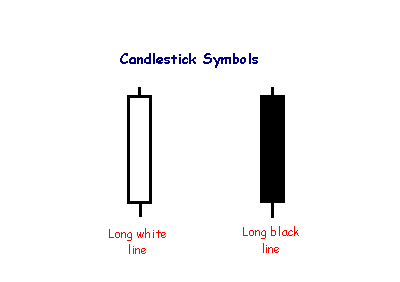
The long white line is a sign that buyers are firmly in control - a bullish candlestick.
A long black line shows that sellers are in control - definitely bearish.
Bollinger Bands reflect direction with the 20-period SMA and volatility with the upper/lower bands. As such, they can be used to determine if prices are relatively high or low. According to Bollinger, the bands should contain 88-89% of price action, which makes a move outside the bands significant.
Stock ETFs
The first and most popular ETFs track stocks. Many funds track national indexes; for example, Vanguard Total Stock Market ETF NYSE: VTI tracks the MSCI US Broad Market Index, and several funds track the S
$CWBS BarChart Technical Analysis
http://www.barchart.com/technicals/stocks/CWBS
The Money Flow Multiplier in Chaikin Money Flow focuses on the level of the close relative to the high-low range for a given period (day, week, month). With this formula, a security could gap down and close significantly lower, but the Money Flow Multiplier would rise if the close were above the midpoint of the high-low range.
$CGUD BarChart Technical Analysis
http://www.barchart.com/technicals/stocks/CGUD
Form 8-K~ SEC Filings Explained
Form 8-K is a very broad form used to notify investors of any material event that is important to shareholders or the United States Securities and Exchange Commission. This is one of the most common types of forms filed with the SEC. After a significant event like bankruptcy or departure of a CEO, a public company generally must file a Current Report on Form 8-K within four business days to provide an update to previously filed quarterly reports on Form 10-Qand/or Annual Reports on Form 10-K. Form 8-K is required to be filed by public companies with the SEC pursuant to the Securities Exchange Act of 1934, as amended. For a list of events that would trigger a Form 8-K to be filed, see the Official SEC Form 8-K Summary, reproduced below.
When Form 8-K is required
Form 8-K is used to notify investors of a current event. These types of events include:
? Material definitive agreements not made in the ordinary course of business
? Bankruptcies or receiverships
? Director is elected
? Director departs
? If a director departs because of a disagreement with the company on any matter relating to the registrant’s operations, policies, or practices then an 8-K must be filed to disclose a brief description of the circumstances representing the disagreement.[1]
? Asset movement: acquisition or sale
? Result of operations and financial condition
? Material Direct Financial obligations (bonds, debentures)
? Triggering events that accelerate material obligations (defaults on a loan)
? Exit or disposal plans
? Layoffs
? shutting down a plant
? material change in services or outlets
? Material impairments
? Delisting or transfer exchange notices
? Unregistered equity sales
? Modifications to shareholder rights
? Change in accountant - and good idea to explain why
? SEC investigations and internal reviews
? Financial non-reliance notices
? Changes in control of the company
? Someone takes a large equity position (more than 15%); shareholder also needs to file with SEC as to intent
? Someone takes a 51% position
? Changes in executive management
? Officer leaves
? Officer is fired
? Officer is hired
? Departure or appointment of company officers
? Amendments to company Governance Policies
? Code of Ethics
? Board Committee Governance Policies
? Trading suspension
? Change in credit
? Change in company status
? Other events
? Financial exhibits
Investors should always read any 8-K filings that are made by companies in which they are invested. These reports are both material and relevant to the company, and often contain information that will affect the share price.
Reading Form 8K
Typically an 8-K filing will only have two major parts. They are:
? The name and description of the event - this contains all the information that the company considers relevant to shareholders and the SEC. It is important to read this information, as it has been deemed "material" by the company.
? Any exhibits that are relevant - these exhibits may include financial statements, press releases, data tables, or other information that is referenced in the description of the event.
The TRIX is available on many trading and charting platforms, and is added to existing charts in the same fashion as other popular technical analysis tools. However, the TRIX may require some customization appropriate for the time frame being traded. Active traders may desire a TRIX that is more sensitive to price changes. A common default is a 9-period setting, which analyzes less than two weeks of data when applied to a daily chart. As an alternative, a 30-period configuration is more appropriate for investors with a longer time frame in mind.
Form F-7 ~ SEC Filings Explained
Registration statement for securities of certain Canadian issuers offered for cash upon the exercise of rights granted to existing security holders
$PVSP BarChart Technical Analysis
http://www.barchart.com/technicals/stocks/PVSP
RSI is considered overbought when above 70 and oversold when below 30. These traditional levels can also be adjusted to better fit the security or analytical requirements. Raising overbought to 80 or lowering oversold to 20 will reduce the number of overbought/oversold readings. Short-term traders sometimes use 2-period RSI to look for overbought readings above 80 and oversold readings below 20.
Tweezer Tops

The Tweezer Top formation is a bearish reversal pattern seen at the top of uptrends.
Tweezer Top formation consists of two candlesticks:
Bullish Candle (Day 1)
Bearish Candle (Day 2)
Sometimes Tweezer Tops have three candlesticks.
A bearish Tweezer Top occurs during an uptrend when bulls take prices higher, often closing the day off near the highs (a bullish sign). However, on the second day, how traders feel (i.e. their sentiment) reverses completely. The market opens and goes straight down, often eliminating the entire gains of Day One.

On Day 1, the bulls were in charge of the Russell 2000 E-mini. On Day 2, however, the bulls began the day trying to make a new high, but were rejected by the overhead resistance created by the prior day's highs. The market then sank quickly only to recover halfway by the end of the close on Day 2. Day 3 opened with a spectacular gap up, but the bulls were promptly rejected by the bears at the now established resistance line. The Russell 2000 E-mini then fell for the rest of the day. Many classic chartists will recognize this triple Tweezer Top as a Double Top formation (see: Double Top).
The Tweezer Top and Bottom reversal pattern is extremely helpful because it visually indicates a transfer of power and sentiment from the bulls and the bears. Of course other technical indicators should be consulted before making a buy or sell signal based on the Tweezer patterns.
TRIX is negative as long as the triple-smoothed 15-day EMA is moving lower. TRIX turns positive when the triple-smoothed 15-day EMA turns up. The extra smoothing insures that up turns and down turns are kept to a minimum. In other words, it takes more than a one-day advance to reverse a downtrend.
$PLSB BarChart Technical Analysis
http://www.barchart.com/technicals/stocks/PLSB
Commodity ETFs or ETCs
Commodity ETFs (ETCs or CETFs) invest in commodities, such as precious metals and futures. Among the first commodity ETFs were gold exchange-traded funds, which have been offered in a number of countries. The idea of a Gold ETF was first officially conceptualised by Benchmark Asset Management Company Private Ltd in India when they filed a proposal with the SEBI in May 2002.[24] The first gold exchange-traded fund was Gold Bullion Securities launched on the ASX in 2003, and the firstsilver exchange-traded fund was iShares Silver Trust launched on the NYSE in 2006. As of November 2010 a commodity ETF, namely SPDR Gold Shares, was the second-largest ETF by market capitalization.[25]
However, generally commodity ETFs are index funds tracking non-security indices. Because they do not invest in securities, commodity ETFs are not regulated as investment companies under the Investment Company Act of 1940 in the United States, although their public offering is subject to SEC review and they need an SEC no-action letter under the Securities Exchange Act of 1934. They may, however, be subject to regulation by the Commodity Futures Trading Commission.[26][27]
Exchange-traded commodities (ETCs) are investment vehicles (asset backed bonds, fully collateralised) that track the performance of an underlying commodity index including total return indices based on a single commodity. Similar to ETFs and traded and settled exactly like normal shares on their own dedicated segment, ETCs have market maker support with guaranteed liquidity, enabling investors to gain exposure to commodities, on-exchange, during market hours.
The earliest commodity ETFs (e.g., GLD and SLV) actually owned the physical commodity (e.g., gold and silver bars). Similar to these are NYSE: PALL (palladium) and NYSE: PPLT (platinum). However, most ETCs implement a futures tradingstrategy, which may produce quite different results from owning the commodity.
Commodity ETFs trade just like shares, are simple and efficient and provide exposure to an ever-increasing range of commodities and commodity indices, including energy, metals, softs and agriculture. However, it is important for an investor to realize that there are often other factors that affect the price of a commodity ETF that might not be immediately apparent. For example, buyers of an oil ETF such as USO might think that as long as oil goes up, they will profit roughly linearly. What isn't clear to the novice investor is the method by which these funds gain exposure to their underlying commodities. In the case of many commodity funds, they simply roll so-called front-month futures contracts from month to month. This does give exposure to the commodity, but subjects the investor to risks involved in different prices along the term structure, such as a high cost to roll
$BLIBQ BarChart Technical Analysis
http://www.barchart.com/technicals/stocks/BLIBQ
|
Followers
|
3284
|
Posters
|
|
|
Posts (Today)
|
0
|
Posts (Total)
|
2804248
|
|
Created
|
08/22/10
|
Type
|
Free
|
| Moderator Nilbud | |||
| Assistants mick ManicTrader PhotoChick Kirimi $Pistol Pete$ | |||
   Investor Hub Alerts: Sign up for 'STOCKGOODIES PLAYS OF THE WEEK ' E-Mail List Investor Hub Alerts: Sign up for 'STOCKGOODIES PLAYS OF THE WEEK ' E-Mail ListUPDATE; 5-1-22 courtesy of charting /\ wit tweezer top calls /\ Tony @Montana_Trades Really good study sheet on Candlestick Patterns [-chart]pbs.twimg.com/media/FRn8188XMAAdZvk?format=jpg&name=small[/chart] 

02-07-2021
|
|
Posts Today
|
0
|
|
Posts (Total)
|
2804248
|
|
Posters
|
|
|
Moderator
|
|
|
Assistants
|
| Volume | |
| Day Range: | |
| Bid Price | |
| Ask Price | |
| Last Trade Time: |


