 News
News  Market Data
  Discover
Support: 888-992-3836
Copyright © 2023 InvestorsHub Inc.


Register for free to join our community of investors and share your ideas. You will also get access to streaming quotes, interactive charts, trades, portfolio, live options flow and more tools.
A "market maker" is a firm that stands ready to buy and sell a particular stock on a regular and continuous basis at a publicly quoted price. You'll most often hear about market makers in the context of the Nasdaq or other "over the counter" (OTC) markets. Market makers that stand ready to buy and sell stocks listed on an exchange, such as the New York Stock Exchange, are called "third market makers." Many OTC stocks have more than one market-maker. 
Bar Chart
Perhaps the most popular charting method is the bar chart. The high, low and close are required to form the price plot for each period of a bar chart.
Use PennyStock Tweets For All Your $EVPH DD
http://www.pennystocktweets.com/stocks/profile/EVPH

Evening Star
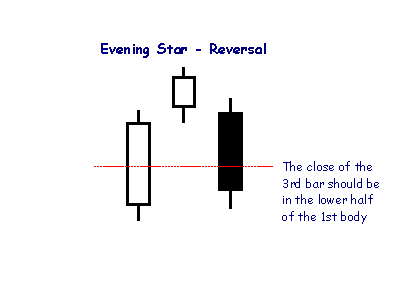
The Evening Star pattern is opposite to Morning Star and is a reversal signal at the end of an up-trend. The pattern is more bearish if the second candlestick is filled rather than hollow. 
Check to see when a company will announce earnings before you buy an option. If you are within a week of an earnings announcement, the option may not have enough time to move in the anticipated direction. Wait until after earnings.
Form N-23C3A ~ SEC Filings Explained
Notification of periodic repurchase offer Filed pursuant to Rule 23c-3(b) only
The decision process is not based on carefully considered facts backed by numbers and evidence. Instead, investors make investment decisions based on the opinion of others. This stems from the need to conform.

More On $DEEL At PennyStock Tweets
http://www.pennystocktweets.com/stocks/profile/DEEL
A limit order allows you to limit either the maximum price you pay or the minimum price you are willing to accept when buying or selling a stock. The primary difference between a market order and a limit order is that your stock broker cannot guarantee that the latter will be executed.
At the 1901 peak, new era thinking centered around railroads, big industrial trusts and the age of optimism. The roaring 20's were marked by the electrical age for big cities and the widening use of autos.
$ILNS Profile on PST - For All Your DD Use More http://www.pennystocktweets.com/stocks/stockprofile/ILNS
Taxation on ETF’s
ETFs are structured for tax efficiency and can be more attractive than mutual funds. In the U.S., whenever a mutual fund realizes a capital gain that is not balanced by a realized loss, the mutual fund must distribute the capital gains to its shareholders. This can happen whenever the mutual fund sells portfolio securities, whether to reallocate its investments or to fund shareholder redemptions. These gains are taxable to all shareholders, even those who reinvest the gains distributions in more shares of the fund. In contrast, ETFs are not redeemed by holders (instead, holders simply sell their ETF shares on the stock market, as they would a stock, or effect a non-taxable redemption of a creation unit for portfolio securities), so that investors generally only realize capital gains when they sell their own shares or when the ETF trades to reflect changes in the underlying index.[5]
In most cases, ETFs are more tax-efficient than conventional mutual funds in the same asset classes or categories.[42] Because Vanguard's ETFs are a share-class of their mutual funds, they don't get all the tax advantages if there are net redemptions on the mutual fund shares.[43] Although they do not get all the tax advantages, they get an additional advantage from tax loss harvesting any capital losses from net redemptions.[44][45]
In the U.K., ETFs can be shielded from capital gains tax by placing them in an Individual Savings Account or self-invested personal pension, in the same manner as many other shares. Because UK-resident ETFs would be liable for UK corporation tax on non-UK dividends, most ETFs which hold non-UK companies sold to UK investors are issued in Ireland or Luxembourg
Successful traders have a well-scheduled planned time for studying the markets.
Line charts are also used when open, high and low data points are not available. Sometimes only closing data are available for certain indices, thinly traded stocks and intraday prices.
$MDHI Profile on PST - For All Your DD Use More http://www.pennystocktweets.com/stocks/stockprofile/MDHI
Doji Candlesticks (General)
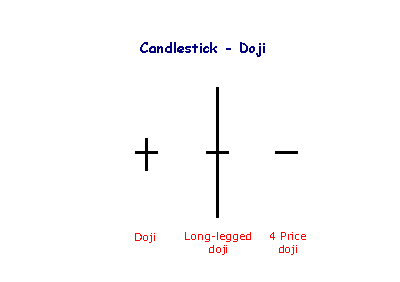
The doji candlestick occurs when the open and closing price are equal.
An open and close in the middle of the candlestick signal indecision. Long-legged dojis, when they occur after small candlesticks, indicate a surge in volatility and warn of a potential trend change. 4 Price dojis, where the high and low are equal, are normally only seen on thinly traded stocks.
One cannot do anything about yesterday. When one door closes, another door opens. The greater opportunity always lies through the open door.
Each unit of measure is the same throughout the entire scale. If a stock advances from 10 to 80 over a 6-month period, the move from 10 to 20 will appear to be the same distance as the move from 70 to 80. Even though this move is the same in absolute terms, it is not the same in percentage terms.
Use PennyStock Tweets For All Your $INKPQ DD
http://www.pennystocktweets.com/stocks/profile/INKPQ
SEC Filings Explained ~ Form13D
Schedule 13D is an SEC filing that must be submitted to the US Securities and Exchange Commission within 10 days, by anyone who acquires beneficial ownership of more than 5% of any class of publicly traded securities in a public company. A filer must promptly update its Schedule 13D filing to reflect any material change in the facts disclosed, including, among other things, the acquisition or disposition of 1% or more of the class of securities that are the subject of the filing.
Form Uses
13D filings allow the investing public to see who a public company's large shareholders are and, perhaps more importantly, why they have an interest in the company. These filings may be a precursor to hostile takeovers, company breakups, and other "change of control" events.
Reading the Form
Schedule 13D consists of seven different sections:
? Security and Issuer - This section contains basic information regarding the type and class the security and the contact information of the owner.
? Identity and Background - This section contains even more background into the owner, including if they were involved in any criminal activity in the past.
? Source and Amount of Funds or Other Considerations - This section lets investors know where the money is coming from. The most important use for this section is in determining if a buyout situation is overleveraged, when a majority of the purchase is leveraged or borrowed capital.
? Purpose of Transaction - This is the most important portion of the 13D filing. It allows you to see why they are buying shares in the company, whether it be for acquisition, hostile takeover, proxy war, or simply because they believe it is undervalued.
? Interest in Securities of the Issuer - This section states the express purpose of the transaction, which should be explained better in section 4 (Purpose of Transaction).
? Contracts, Arrangements, Understandings or Relationships with Respect to the Securities of the Issuer - This section contains any special relationships between the owner and the company. This is important to be sure that the buying is legitimate and not just a friend purchasing stock or the result of some other agreement.
? Materials to Be Filed as Exhibits - This is the second most important section. It contains any exhibits that may be filed along with the form. This is famously used for the filing of letters to management in the event of a hostile takeover. Exhibits can also elaborate on the Purpose of Transaction (Section 4).
If you love the very idea of fundamental research, then day trading is probably not for you. Day trading requires quick responses to price changes, not a careful understanding of accounting methods and business trends. A little fundamental analysis can be helpful in day trading, but a lot can slow you down.
Where Is Support Established?
Support levels are usually below the current price, but it is not uncommon for a security to trade at or near support.
$NYXO Profile on PST - For All Your DD Use More http://www.pennystocktweets.com/stocks/stockprofile/NYXO
Surround yourself with those people with whom you share similar characteristics and disciplines, but never try to become something that you are not. Always, always, be willing to learn from both success and failure.
BULLISH HOMING PIGEON
Bullish Homing Pigeon Pattern is a small black real body contained by a prior relatively long black real body.
Recognition Criteria:
1. Market is in downtrend.
2. We see a black body in the first day.
3. Then we again see a black body in the second day where the real body of this second day is completely engulfed by the real body of the first day. It is not required that the shadows (high/low) of the second candlestick are contained within the first, though it's preferable if they are.
Explanation:
The Bullish Homing Pigeon Pattern is a signal of disparity. In a market characterized by downtrend, we first see heavy selling reflected by the long, black real body of the first day. However small body of second day points out to diminished power and enthusiasm of the sellers thus suggesting a trend reversal.
Important Factors:
The important fact about this pattern is the requirement that the second day has a minute real body relative to the prior candlestick and that this small body is completely contained by the larger one. The Bullish Homing Pigeon Pattern is not necessarily a signal for a rally. Market usually has a tendency to enter into a congestion phase following a Homing Pigeon.
We must check the third day to confirm that the downtrend has reversed. This confirmation may be in the form of a white candlestick, a large gap up or a higher close on the next trading day (on the third day).
The choice of data compression and time frame depends on the data available and your trading or investing style.
Use PennyStock Tweets For All Your $HYDI DD
http://www.pennystocktweets.com/stocks/profile/HYDI
Form 15F-15D, 15F-15D/A ~ SEC Filings Explained
Notice of a foreign private issuers suspension of duty to file reports pursuant to Section 13 and 15(d) of the Act (and amendment thereto)
The successful day trader must learn how to accept a loss and when to recognize that the this rule is being violated. The day trader must be willing to accept what he or she has achieved by the end of each day without undue frustration and/or wishful thinking --win, lose, or draw.
Random Walk vs Non-Random Walk
Pfizer (PFE) shows an example of three sizable trends emerging over a two year period. The stock was up over 50% in 2009, down around 25% in the first half of 2010 and up around 50% from July 2010 to March 2011.

For All Your $ATDN DD ~ Use PennyStock Tweets
http://www.pennystocktweets.com/stocks/profile/ATDN
Form N-14 ~ SEC Filings Explained
Initial registration statement for open-end investment company
Level 2 market data is also known as the order book. When orders are placed, they are placed through many different market makers and other market participants. Level 2 will show you a ranked list of the best bid and ask prices from each of these participants, giving you detailed insight into the price action, including the market depth. Knowing exactly who has an interest in a stock can be extremely useful, especially if you are day trading.
$DUSS Profile on PST - For All Your DD Use More http://www.pennystocktweets.com/stocks/stockprofile/DUSS
Support Equals Resistance
Another principle of technical analysis stipulates that support can turn into resistance and vice versa.
"Markets can remain illogical longer than you or I can remain solvent," according to our good friend, Dr. A. Gary Shilling. Illogic often reigns and markets are enormously inefficient despite what the academics believe.
BULLISH LADDER BOTTOM
The shorts may have a chance to close their positions and realize their profits by the fourth day of a considerable downtrend. Then we see an upward gap on the fifth day as a result of this. If the body of the fifth day is long, or the volume of trading is high, this may also imply a bullish reversal.

Recognition Criteria:
1. Market is characterized by downtrend.
2. We see three long black candlesticks characterized by consecutively lower opens and a closing sequence just like the Bearish Three Black Crows Pattern.
3. Then we see a black candlestick on the fourth day with an upper shadow.
4. Finally we see a white candlestick opening above the body of the fourth day on the fifth day.
Explanation:
There is a considerable downtrend for some time and the bears are happy. Then we see a good move downward. Prices start trading above the opening price and almost reaching to the new high of the previous day, but then they close at another new low. This action is a warning for shorts telling them that the market will not go down forever. The shorts may then be forced to reevaluate their positions and they may start closing their positions on the next day if profits are good. This act is the reason behind the upward gap we see on the last day of the pattern and also the close is considerably higher. If volume is high on the last day, a trend reversal has probably occurred.
Important Factors:
A confirmation on the sixth day is suggested in the form a white candlestick, a large gap up or a higher close, to be sure that the market has reversed.
$TUCN Profile on PST - For All Your DD Use More http://www.pennystocktweets.com/stocks/stockprofile/TUCN
The data may be the same, but each method will provide its own unique interpretation, with its own benefits and drawbacks.
In bull markets we can only be long or neutral, and in bear markets we can only be short or neutral. That may seem self-evident; it is not, and it is a lesson learned too late by far too many.
SEC Filings Explained ~ Form 4
Form 4 is a United States SEC filing that relates to insider trading. Every director, officer or owner of more than ten percent of a class of equity securities registered under Section 12 of the Securities Exchange Act of 1934 must file with the United States Securities and Exchange Commission a statement of ownership regarding such security. The initial filing is on Form 3 and changes are reported on Form 4. The Annual Statement of beneficial ownership of securities is on Form 5. The forms contain information on the reporting person's relationship to the company and on purchases and sales of such equity securities.
Form 4 is stored in SEC's EDGAR database. EDGAR is Electronic Data Gathering, Analysis and Retrieval System. It is a registered trademark of the SEC.
A Form 4 must be filed before the end of the second business day following a change in ownership of securities or derivative securities (including the exercise or grant of stock options) for individuals subject to Section 16 of the Securities Exchange Act of 1934.
For All Your $HALB DD ~ Use PennyStock Tweets
http://www.pennystocktweets.com/stocks/profile/HALB
The most recurring height (value) would be in the middle and the remaining heights would be equally distributed on either side. Furthermore, 68.5% of all values would fall within ±1 standard deviation of the mean, 95.4% would fall within ±2 standard deviations and 99.7% would fall within ±3 standard deviations. The solid black line shows a typical bell curve with a normal distribution

Because penny stocks are high speculation plays you should be getting in and out as soon as you realize some good profits.
For All Your $EVPH DD ~ Use PennyStock Tweets
http://www.pennystocktweets.com/stocks/profile/EVPH
Bond ETFs
Exchange-traded funds that invest in bonds are known as bond ETFs. They thrive during economic recessions because investors pull their money out of the stock market and into bonds (for example, government treasury bonds or those issues by companies regarded as financially stable). Because of this cause and effect relationship, the performance of bond ETFs may be indicative of broader economic conditions.[22] There are several advantages to bond ETFs such as the reasonable trading commissions, but this benefit can be negatively offset by fees if bought and sold through a third party
Traders usually concentrate on charts made up of daily and intraday data to forecast short-term price movements.
. Many day traders make sure to trade with the ax because it typically results in a higher probability of success.
Use PennyStock Tweets For All Your $HRAL DD
http://www.pennystocktweets.com/stocks/profile/HRAL
Form 10-Q~ SEC Filings Explained
Form 10-Q, (also known as a 10-Q or 10Q) is a quarterly report mandated by the United States federalSecurities and Exchange Commission, to be filed by publicly traded corporations.
Pursuant to Section 13 or 15(d) of the Securities Exchange Act of 1934, it's an SEC filing that must be filed quarterly with the US Securities and Exchange Commission. It contains similar information to the annual form 10-K, however the information is generally less detailed, and the financial statements are generally unaudited. Information for the final quarter of a firm's fiscal year is included in the 10-K, so only three 10-Q filings are made each year.
These reports generally compare last quarter to the current quarter and last years quarter to this years quarter. The SEC put this form in place to facilitate better informed investors. The form 10-Q must be filed within 40 days for large accelerated filers and accelerated filers or 45 days after the end of the fiscal quarter for all other registrants (formerly 45 days)
|
Followers
|
3286
|
Posters
|
|
|
Posts (Today)
|
0
|
Posts (Total)
|
2804248
|
|
Created
|
08/22/10
|
Type
|
Free
|
| Moderator Nilbud | |||
| Assistants mick ManicTrader PhotoChick Kirimi $Pistol Pete$ | |||
   Investor Hub Alerts: Sign up for 'STOCKGOODIES PLAYS OF THE WEEK ' E-Mail List Investor Hub Alerts: Sign up for 'STOCKGOODIES PLAYS OF THE WEEK ' E-Mail ListUPDATE; 5-1-22 courtesy of charting /\ wit tweezer top calls /\ Tony @Montana_Trades Really good study sheet on Candlestick Patterns [-chart]pbs.twimg.com/media/FRn8188XMAAdZvk?format=jpg&name=small[/chart] 

02-07-2021
|
|
Posts Today
|
0
|
|
Posts (Total)
|
2804248
|
|
Posters
|
|
|
Moderator
|
|
|
Assistants
|
| Volume | |
| Day Range: | |
| Bid Price | |
| Ask Price | |
| Last Trade Time: |


