 News
News  Market Data
  Discover
Support: 888-992-3836
Copyright © 2023 InvestorsHub Inc.


Register for free to join our community of investors and share your ideas. You will also get access to streaming quotes, interactive charts, trades, portfolio, live options flow and more tools.
With $SMCE- huge gift here .004-.0045 + pps
There is no way this stays down here. Several factors caused this last week among others profit taking and debt sellers.
That being said - the value proposition here is too high for the current pps and I suspect we will see .006-.007 + here again over the next week.
Chaintrade has too much value imo
Outstanding Shares = 1,284,701,483 Shares as of 07/08/2024
https://www.otcmarkets.com/stock/SMCE/security
SMC Completes Asset Purchase of UK-registered ChainTrade Ltd.’s AI-powered Trading Platform
https://www.otcmarkets.com/stock/SMCE/news/story?e&id=2897240
Playing me? Hahahahahahaha I wish. Look, just because you don’t know how to read the fins, you don’t get to call this a scam. I understand you bought high but don’t get disgruntled over such, it happens to best of the tickers. This is OTCM, it is all a gamble. For the record, SMCE is based and always will be based in FL, so not sure what you talking about it is a scam due to location. The AI purchased is real and they paid 2.5M shares in preferred B stocks at $10 per share. Think about this, $25M for the sale. The seller must believe on this company to give his company at a price it hasn’t reached yet. Yes, there are debtors diluting, 06/30 was one diluting millions of shares and 07/30 mature another one with 100M more. But it is normal in all these companies. You just gotta know what and when you are getting into.
Will it continue going down? Potentially, with these shares converted, it probably keeps going down the hill at 0.0030 ish
They can’t monetize this until FINRA approves it, so I heard it takes like up to 180 days for such. Name change and ticker submitted. Yes, the downtime and silence time the company will go into, won’t help the PPS, it will tank. Diamond hands
A lot of shareholders are buying this silently.
Under .005 is a gift here imo!
I do know about you but I've made good money here
Erik BluM is playing you
How many bought up above .005?
I said .007’s was Blums top tipping point here.
Nothing changed from 2021 same BluM Boca Raton FL scam play as usual
I’m curious. You made a ton of what here?
Erik BluM on dumb
We made a ton here well I did, but thank you for trying to teach others your BS
Nothing like this one mate. Also check their year revenue in 2023 year. Chaintrader is amazing
The fins are being dropped accordingly, this CEO means serious business moving forward. I am adding in the DIP next week. I hope it drops harder so I can buy the cheapest possible
Why. because they have a trading app? There are many out there now....some are free
I've made some good money trading this one, what's your problem.??
Can't lose now with free shares! Holding my 48 ave here for .0115, then .015 easy! Look around, OTC is coming back!
Follow and learn the hard way with SMCE
You really have no idea on what you are talking about do you?
How many scams like this one this year?
Grab some more bags, space them out
One can always say that the Devil made me do it
SMCE is the current one!!
.0075 you are absolutely right!!!
That is the spirit!!! I will add again in the DIP next week when my money clears. Probably the chart master will be accurate this time, in the mid or high 0.0030ish next week. I cant wait
ADDED AGAIN AND AGAIN ... ;)
SHARE HOLDINGS: 33,043,502 STRONG SHARES
SMCE
If this goes under.0040 I will buy 6 million shares... I'm ready for it!!!
Good call. Congrats!
PS. I like 0040's 😁
I think so to .
Yup, as expected 0.00484, more to come down
If that is the way you think of such, you are in the wrong field. You forgot that this Market comes to a basic principle of hands to hands transactions. For you to win money, someone else must lose. If you do not agree with such, then please enlighten me. Nobody is a saint in here, I think you are confused... Maybe you were referring to yourself when looked at your reflection. You shouldn't, this is not a monastery, this is a competition and nobody is friendly, last men standing
Load the cheapies! Soon these prices will be gone for good! Pennies coming!!
POS!!
And I'm not talking about the stock!
Owners are not dumping! Stop with the lies!!
You guys must be so pathetically miserable with your life to get a thrill out of
People losing money! So disgusting.
You are just playing levels of support and resistance (levels of balance and interest) in the charting structure, nothing special and nothing new. Get over yourself. Hahaha
owner dumping a lot of inventory now
.0045..pecision charting right here...if she falls through .0045...its ready for .0036..watch and learn!!!
AS MENTIONED .0045 NEXT..Fake chart clowns never get it right
0.00494 we just hit the 0.004ish zone, for the Hyped non-believers. Cheapies cheapies
Yea that was so crazy a few years ago I’m a TA momo trader don’t flip I swing, that was a dream year unfortunately I was an addict, sports gambling junkie on sports, professional at NFL but got addicted after making 300k on NFL started playing other sports lost it all sickening man, my trading account was linked to fan duel by hit of a button even on Sundays. lol Between that and the most expensive drug I went through all my trading profits. Don’t get me wrong I bought a bunch of stuff but you get my point. As a momo trader that was a traders dream.
Now the otc is different like you said so yes I had to adjust very selective less plays, absolutely have to pick winners 7 out of 10 times by being selective cutting losses asap on losers. But I am profitable is it 21 profits no but if I trade SMCE and Company follows through I will hit massively, hope you do to, hey you do what works for you. I hope you hit on your plays I really do, hope we all do, we need some runners so if you ever see one that just jumps out to you please pm me and I will alert you if I come across something that pops out to me. Best of luck brother!
that's why you go stuck holding so may bags from 2021 clown...you are a terrible trader and that's why you still hold this one
I will pass. I have 30+ years of trading the OTC successfully and making decent money. I will never use a chart. And I am not in and out of my OTCs daily. I own over 150 of them. The only year that guy made serious money or money at all in the OTC was 2021 and that's all we hear about. Everyone, including myself made huge OTC money early 2021 because everything OTC went up. As long as they took profits and didn't just hold and didn't buy the March 2021 highs and then get stuck. You do realize in early 2021 that there was not one reporting trip play left in the trips. All were .001 or above. We will never see that again. The SEC with the new filing rules killed the OTC 2021 party and the OTC was bad in 2022 and 2023. That guy lost money in the 2023 and 2023 OTC. If charts worked a good chartist would have still have cleaned up in the 2022 and 2023 OTC.
My friend respectively have you ever truly studied TA in otc. I can tell you for 100% certain they work now of course you have to pick a winning stock that’s the key and hardest part. If you do if only you understood what Chartmaster is doing. While a fundamentalist is holding there shares a TA swing trader is literally doubling their position each leg up. They are creating new shares out of thin air because of trading skills. I’ll give you the biggest secret in TA you can look at any stock than has ever run in otc you will see this pattern 100% bullet proof. Pull up the upper bollie on any ticker in history of otc then watch the price action once it’ over extends the upper bollie a 2nd day. You will get a 3rd at times but it will never put a new high in its impossible, its a sell signal to then wait for a fib retrace of 50 to 60.1% you literally double your shares if you execute properly. Look at my analysis on hiru just watch you will see a good example.
So who wouldn’t be buying for 690% chance from 20 day currently at .0051. That’s a .0351 pps not far fetched. Why you think Trendtrade was bashing saying .0051 it’s the 20 day he knows it, he wanted to steal shares there rather than make a bold prediction he lies, steals, manipulates, tries to cause panic, fear. If I’m wrong I can live with it but I would never trick people into selling, at that point your not a trader your a manipulator. Look at history here was bashing for shares then bragging this is the best chart in otc. History don’t lie. If you fall for it it’s on you be smart, trade smart, calculated, etc, best of luck to all you
So who wouldn’t be buying tomorrow off that .0051 20 day for a chance at 690% based off past data. I’m not predicting .50 $1.00 potential is there if company follow through I’m speaking terms of data, patterns, etc. that we can see now in front of us. $smce
— Brian Sowa (@sowa32214) July 19, 2024
Some TA patterns
Technical trading is all I have known for 20 years with basic fundamentals. Check out the last time $SMCE broke out of a bullish flagpole. It hovered the 20 around .001 for 9 consolidation days. Then it broke away ran 690%. Were now in a Bullish pennant a bit different formation
— Brian Sowa (@sowa32214) July 19, 2024
Now checkout the consolidation pattern since we started consolidating around the 20 day. This is the 1st time we have tested it since .001 notice the consolidation period is almost identical so far we’re on day 9 or so which is when $SMCE last ran 690% with some ups and downs
— Brian Sowa (@sowa32214) July 19, 2024
In screenshot 2 is current action around 20 day. Screenshot 3 is full vie of 3 month chart. .0351 is not a far fetched price prediction from past data on $SMCE pic.twitter.com/vFrHrzTAec
— Brian Sowa (@sowa32214) July 19, 2024
Buying next week the dip then
Ohh, I am buying next week after bloody Tuesday. 0.004ish. Then Kaboom!
I like all the info I can get when placing an order....but chartists that rely on it totally are completely missing the mark....and when they push their system....then they really lose cred
What the hell is your problem? STFU!!!!
Scientifically charting is used to identify and to predict trends....feed the info and see if it is working or needs a tweak.....not the case with micropenny stocks...they move on their own and typically haven't a chance of showing a trend....a total misuse of a tool by fools
Exactly! The people who have not used charts for the past 2-3 decades are in denial cuz if they admit charts work now, then they are admitting their slackness for all those past losing years trading without them....SMCE will be .0115 soon, then .015 is my call too!
Load and hold for much higher. It's coming!!!
This will be over a penny soon and anyone who says it won't is just trying to get cheap shares
Charts are a very useful tool even in the OTC.
|
Followers
|
194
|
Posters
|
|
|
Posts (Today)
|
0
|
Posts (Total)
|
22006
|
|
Created
|
10/14/06
|
Type
|
Free
|
| Moderators LCJR DD_dempsey MrPuff | |||

Our wholly owned subsidiary, Fyniti Global Equities EBT Inc. markets a software-as-a-service (“SaaS”) proprietary platform for Certified Public Accountants (“CPAs”) Financial Institutions and Registered Investment Advisors (“RIAs”) (the “Platform”). The Platform is a SaaS platform enabling users to see the developing market trends and use it to create customizable baskets if applicable.
Currently, the Company has earned only minimal revenue. The SaaS is ready to implement, and we are currently talking to different CPAs and RIAs about beta testing the Platform beginning in the first quarter of 2024.
Pending the results of beta testing, the Company plans on using a model of an initial set up fee with a monthly content fee. Each CPA, Financial Institution and RIA will be charged an initial fee of $50,000 and a monthly maintenance fee for the software of up to $100,000 per month. The Company anticipates signing a beta test contract after its Form 10 Registration Statement is effective.
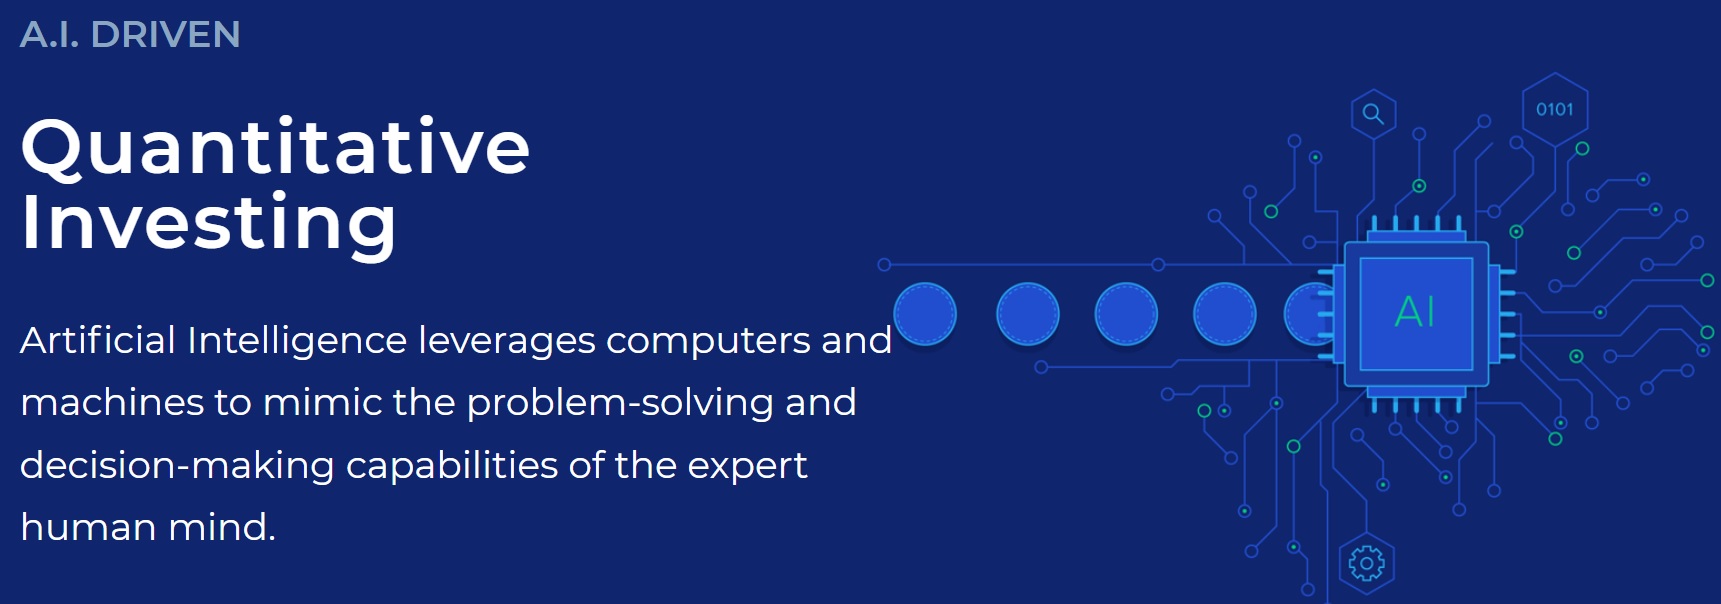
The Platform’s IQ Engine enables the user to see changes occurring on the underlying indexes daily and provides alternatives based on machine learning (“ML”) and artificial intelligence (“AI”) which the user can incorporate into its decision making process.
Our AI and ML Capabilities:
Fyniti Global Equities EBT employs state-of-the-art AI/ML technologies along with Quant algorithms, to enhance our quantitative investing strategies and wealth management solutions. The primary purpose of our AI/ML capabilities is to optimize trading strategies, risk management, and portfolio allocation.
Operation of the IQ Engine:
The IQ Engine operates by continuously analyzing vast amounts of financial data, market indicators, and historical trading patterns. It employs advanced statistical models and machine learning algorithms to identify trends, correlations, and anomalies in the data. These insights are then used to make data-driven decisions regarding the execution of trades, asset allocation, and risk mitigation. By using the IQ engine, Financial Institutions, RIAs, and CPAs will have more access to information flow with which to make better decisions for their clients.
Datasets Utilized:
Our AI/ML algorithms utilize a wide range of datasets to inform their decision-making processes. These datasets include but are not limited to:
We use both public and paid sources for input. Most of the input is correlated by amassing the collective data points at the end of business everyday., Our AI/ML algorithms utilize a wide range of datasets to inform their decision-making processes. The AL/ML Algorithm captures between 20 and 30 thousand data points every day from different places. These data points comprise but are not limited to:
Market Data: Real-time and historical price data, trading volumes, bid-ask spreads, and order book information.
Economic Indicators: Macro-economic data such as GDP, inflation rates, and interest rates.
News and Sentiment Analysis: News articles, social media sentiment, and other textual data sources to gauge market sentiment.
Fundamental Data: Company financials, earnings reports, and analyst recommendations.
Alternative Data: Non-traditional data sources are also incorporated to enhance the capabilities. As an example, regarding the financial sector. Buy now pay later tracking, Credit card usage, M1distribution, and Fed Data.
We obtain those datasets from paid data providers like financial data publishers as well as public sources like corporate SEC filings Edgar and Bloomberg etc. The nature of these datasets is both structured and unstructured data. Depending on the source of the dataset, the cost varies. Regarding the AI, we use 3 broader types of algorithms, supervised learning, unsupervised learning and reinforcement learning.
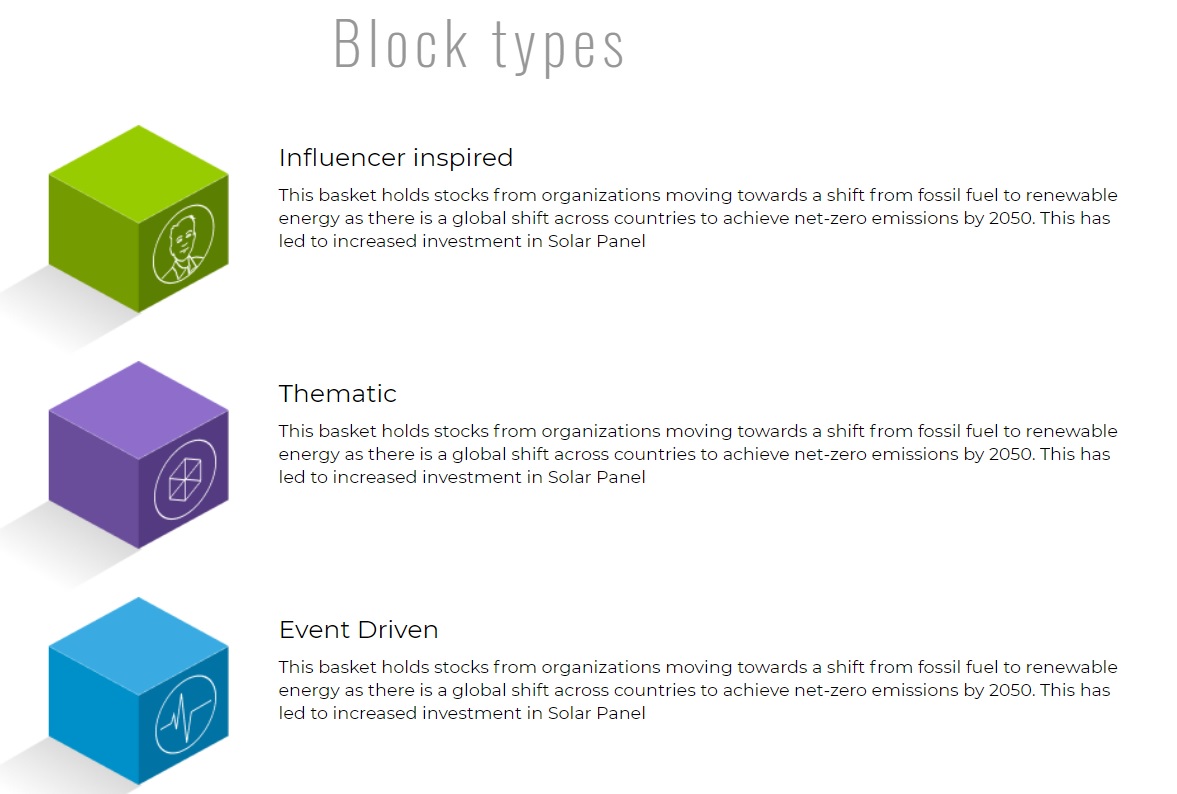
The SaaS is used to create a projected weighting on each block. In essence creating a customized index basket that is actionable on by the RIA As an example there are 500 stocks in the SP 600 the AI/ML could customize a block minus oil and gas or minus banks. The institution would have access to alerts on a daily basis showing recommended adjustments within their customized block. The RIA or institution would have the decision to act or not act on the alert.
We use AI in various capacities including (but not limited to) the following use cases: RAG based Information retrieval from unstructured data like SEC filings, quarterly reports etc., Text summarization and classification, Predictive analytics using financial metrics, Automatic data enrichment and predictions, Autonomous agents to continuously analyze data, identify missing features, rank and assign based on metrics v Analyze and enhance news stories, structured inputs like analyst ratings etc. All these datasets, 3rd party inputs are internally used to predict various ratings and analysis, but those data are not shown directly to the end users.
The mix of data points is designed to provide actionable alerts to financial institutions the exact set of data points is proprietary to the SaaS platform and the company would like to not divulge it publicly.
We obtain those datasets from paid data providers like financial data publishers as well as public sources like corporate SEC filings Edgar and Bloomberg etc. The nature of these datasets is both structured and unstructured data. Depending on the source of the dataset, the cost varies. Regarding the AI, we use 3 broader types of algorithms, supervised learning, unsupervised learning and reinforcement learning.
We use AI in various capacities including (but not limited to) the following use cases: RAG based Information retrieval from unstructured data like SEC filings, quarterly reports etc., Text summarization and classification, Predictive analytics using financial metrics, Automatic data enrichment and predictions, Autonomous agents to continuously analyze data, identify missing features, rank and assign based on metrics Analyze and enhance news stories, structured inputs like analyst ratings etc. All these datasets, 3rd party inputs are internally used to predict various ratings and analysis, but those data are not shown directly to the end users.
Third-Party AI Products:
While we primarily rely on our proprietary AI models and Quant algorithms, we also utilize third-party AI products and services for specialized analyses or data enhancements. These third-party tools are carefully vetted to ensure their accuracy, reliability, and compliance with regulatory standards.
We use the comparable and mention the ETF market because we wanted to draw parallel to how these two differ in the ability to cater to same segment of stock investors.
Fyniti Blocks -- as we call it-- may look similar to ETFs, however these two are different financial products, however the end goal is these two helps professional investors in simplifying their investment strategy. Fyniti Blocks offer Ria’s and Hedge Fund managers the ability to leverage real time trends and events, offering customization etc., Our product is a technology product offered as Software-as-a-Service because it leverages latest technologies to help the RIAs/brokers while giving them the controls they need to manage these by themselves and also without changing how these stocks are traded. It helps them in managing their portfolios better. ETF are set in their weighting the software offers institutions the ability to change their weightings as needed to reflect the underlying sentiment of the machine learning protocol.
We do use data like any other typical technology-based stock trading platform would use, but not necessarily would extrapolate data from ETF markets. For the reasons given above, the way it operates is very different and also, it addresses the gaps in customization that the ETFs currently do not provide.

| Volume | |
| Day Range: | |
| Bid Price | |
| Ask Price | |
| Last Trade Time: |


