 News
News  Market Data
  Discover
Support: 888-992-3836
Copyright © 2023 InvestorsHub Inc.


Register for free to join our community of investors and share your ideas. You will also get access to streaming quotes, interactive charts, trades, portfolio, live options flow and more tools.
Trading Notes: Thursday, January 7th
By Brett Steenbarger, Ph.D.
* January 7, 2016
* Yesterday's post noted the macro headwinds from China/EM/commodities and pointed out that intermediate cycles had not yet bottomed for stocks. Overnight we're seeing more of the headwind dynamics, with another day of weak trade in China and oil trading sharply lower. That has dragged stocks down significantly. Selling bounces remains the operative strategy; my cycle measures are in oversold territory, but not yet at levels associated with recent market bottoms.
* Because of the China dynamic, important market moves are occurring outside of U.S. trading hours. That has important implications for both day-traders and for those holding positions overnight. Day-traders operating during U.S. hours are finding markets already extended by the time trading starts. Traders holding individual stocks overnight are subject to gap risk. It's a classic example of a change in markets that requires traders to adapt.
* In yesterday's trade, new three-month lows expanded, ending divergences that appeared to be showing up among breadth figures. With today's weakness, I expect further negativity of breadth. While my intermediate cycle measures are not in bottom territory quite yet, short-term we're quite oversold (see chart below) and my measure of pure volatility (volatility per unit of volume) has once again spiked. That combination raises the odds for short-term, sharp short-covering rallies.

* The collapse of oil hurts commodity producing countries, hurts major growth areas of the U.S. economy, and reflects a situation in which demand from weak economies overseas cannot overcome increased supply. Below is a chart of the past year in WTI crude. The bear in oil has become the bear in stocks.

http://traderfeed.blogspot.com/2016/01/trading-notes-week-of-january-4th-2016.html
• George.
Click on "In reply to", for Authors past commentaries.
ETFs Sector Performance Today
* January 7, 2016
>> Best Performing Technolgy ETFs Today
http://www.dogsofthedow.com/best-performing-technology-etfs-today.htm
>> Best Performing Healthcare ETFs Today
http://www.dogsofthedow.com/best-performing-healthcare-etfs-today.htm
>> Best Performing Energy ETFs Today
http://www.dogsofthedow.com/best-performing-energy-etfs-today.htm
>> Best Performing Financial ETFs Today
http://www.dogsofthedow.com/best-performing-financial-etfs-today.htm
>> Best Performing Real Estate ETFs Today
http://www.dogsofthedow.com/best-performing-real-estate-etfs-today.htm
>> Best Performing Commodity ETFs Today
http://www.dogsofthedow.com/best-performing-commodity-etfs-today.htm
• George.
Trading Notes: Wednesday, January 6th
By Brett Steenbarger, Ph.D.
* January 6, 2016
* After an indecisive session yesterday in which bulls could not mount much follow through to the strong bounce late Monday, we've continued the downtrend in overnight trade, with oil notably trading weaker. I continue to see China/EM/commodity weakness as major headwinds for stocks. My intermediate cycle measure is not yet in bottom territory, per the chart below:

* Interestingly, thus far we're not seeing as many stocks making new lows as we did at similar levels in December following declines. I'm particularly impressed with how utilities stocks and energy stocks have held up reasonably well despite the Fed rate hike concerns and falling oil prices, respectively. My base case expectation is for a break of the December lows and an expansion of breadth weakness, but I am very aware of the alternate scenario in which weakness cannot expand new lows. That would be more consistent with a trade in which we're closer to the bottom of a range than poised for a true bear correction.

http://traderfeed.blogspot.com/2016/01/trading-notes-week-of-january-4th-2016.html
• George.
Click on "In reply to", for Authors past commentaries.
Peek Into Future Through Futures
* January 5, 2016
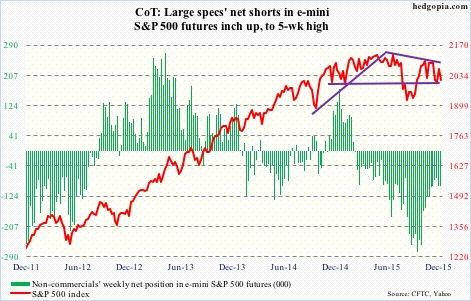
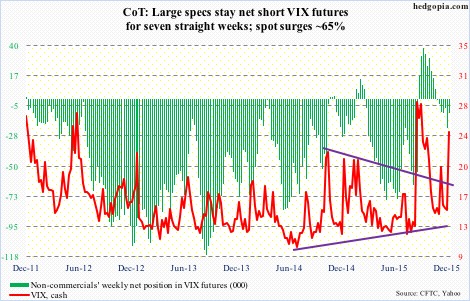
The following are futures positions of non-commercials as of December 29, 2015. Change is week-over-week. (Due to New Year’s Day last week, the CFTC released numbers on Monday, instead of last Friday.)
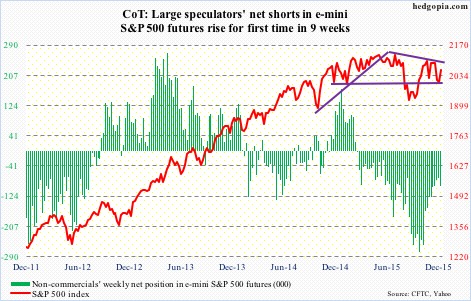
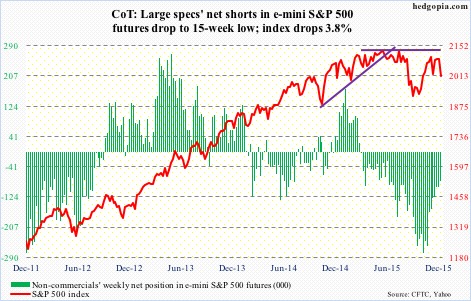
E-mini S&P 500: For the first time in five weeks, U.S.-based equity funds attracted inflows in the week ended last Wednesday, amounting to $10 billion (courtesy of Lipper). This was after $30.3 billion left these funds in the prior four weeks.
With this, a total of $8.6 billion has been withdrawn since September 30th. This is a good reference point as stocks in general, including the S&P 500 index, bottomed on the 29th of that month.
The lack of flows was evident in how December performed. It was the first back-to-back down Decembers since 1981/’82. A record!
After three years of double-digit gains, the S&P 500 dropped 0.7 percent in 2015. Another record! For the first time in 145 years, a year ending in 5 ended up in the red column. The last time this happened was in 1875 – down 3.7 percent (courtesy of @RyanDetrick, a must-follow). The year 1895 came close – up a mere 0.5 percent.
As a matter of fact, 2015 could have very much ended up like 1895. By December 30th, 2015 was up 0.22 percent. The next session – the year’s last –was a volatile session. Down, up and then down on a five-minute chart. At one point during the session – shortly after noon – the S&P 500 was up 0.18 percent for the year. Then gradually it gave up the gains, and then some.
Enough looking through the rearview mirror. On to the windshield.
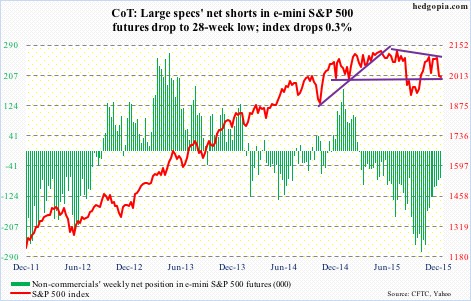
Once again, @RyanDetrick points out that the S&P 500 has not been down the first day of the year three straight years since 1999-2001. The index was lower the past two years – down 0.89 percent and 0.03 percent, respectively. Yesterday, stocks were taken to the woodshed, with the S&P 500 down 1.5 percent.
The index has been trapped within a descending channel for a couple of months now. The upper end of the channel lies at 2090, which was not even tested last week, although it came close. With the drop yesterday, support at both 2040 and 2020 has been lost.
If there is any consolation in yesterday’s price action, it is that 1990, a must-hold, was tested and held. This is where the low end of that channel lies as well. Remains to be seen if bulls can build on this. They seem to be swimming upstream.
Currently net short 97.2k, up 1.9k.
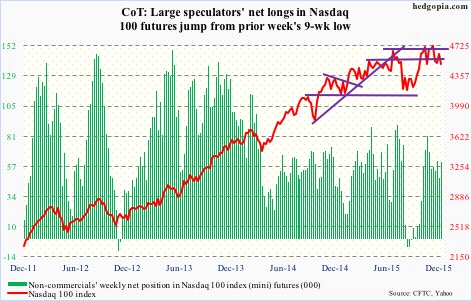
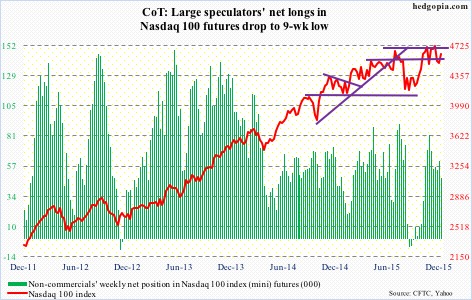
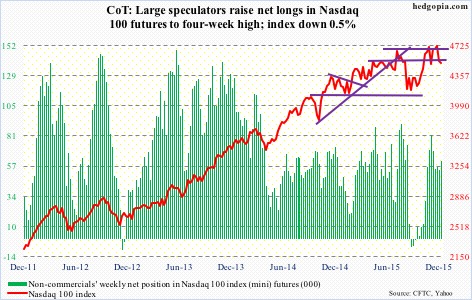
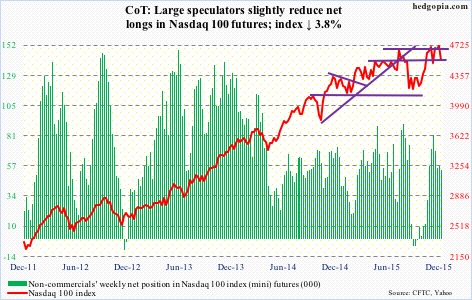
Nasdaq 100 index (mini): Tech-heavy indices fared well last year, with the Nasdaq 100 up 8.4 percent and the Nasdaq composite up 5.7 percent. In contrast, the S&P 500 fell 0.7 percent and the Dow Industrials lost 2.2 percent.
The tech outperformance is laudable until we consider this. The so-called FANG propelled these indices. Facebook (FB) rallied 34.2 percent, Amazon (AMZN) 117.8 percent, Netflix (NFLX) 134.4 percent, and Alphabet (GOOGL, formerly Google) 46.6 percent.
In the Nasdaq 100, these four names are respectively weighted 4.3 percent, 5.5 percent, 0.9 percent, and 4.6 percent. At 12.9 percent, the largest weight goes to Apple (AAPL), which lost three percent last year. Technically, it has broken its June 2013 trend line. And, there is potentially a head-and-shoulders pattern forming on a weekly chart, with the neckline break occurring around $105, where it sat on Thursday and was broken intra-day yesterday, but was salvaged by close. AAPL remains grossly oversold on a daily basis, let us see if bulls can take advantage of this as well as yesterday’s reversal.
Further, it is hard to imagine the FANG names – particularly AMZN and NFLX – repeat their performance this year. Can energy – last year’s laggards – provide the leadership? XLE, the SPDR Energy ETF, lost 21.5 percent in 2015. Even if it does, it does not help the Nasdaq 100 much.
For some time now, 4560 has proven to be an important price point, and was lost yesterday; the index did, however, manage to save the 200-day moving average.
Currently net long 60.9k, up 13k.
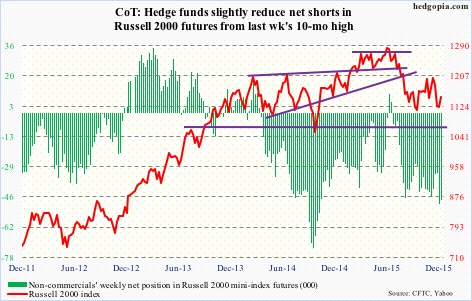
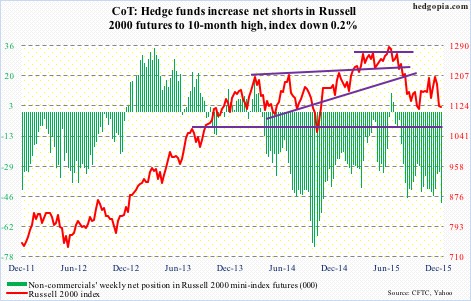
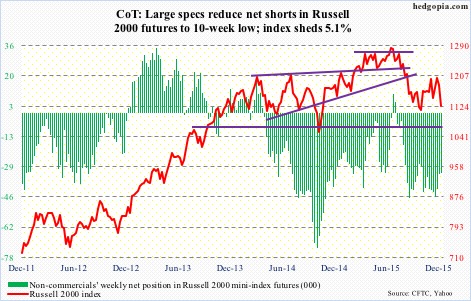
Russell 2000 mini-index: If we are indeed in a sustained tightening cycle in the U.S., then small-caps will probably continue to lag large-caps. In 2015, the Russell 2000 index lost 5.7 percent, lagging large-caps big time.
If small-caps were any indication, investors were not in risk-on mode last year. This is the same as high-yielding stocks lagging dividend growth stocks, or, for that matter, debt-heavy stocks over cash-rich.
How about 2016?
Well, the year has not gotten off to a good start, and 2015 did not end well.
Early last month, the 1210-1215 resistance, which has been in place since March 2014, held firm, with the index subsequently also losing 1170.
The 200-day moving average is decidedly pointing lower, with the 50-day flat to slightly down.
The index is now down 14-plus percent from the July 2015 high.
Kudos to non-commercials for having nailed this. Net shorts are at a 10-month high.
Currently net short 49.6k, up 2.4k.

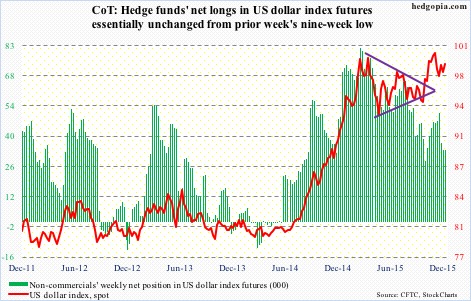
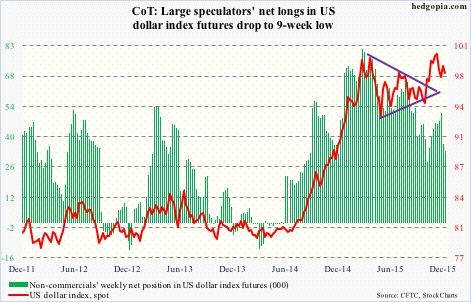
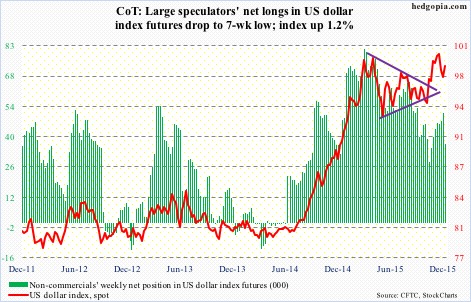
US Dollar Index: Gained nine percent in 2015, its third straight year of gains.
At least going by non-commercials’ holdings, it is tough to argue the streak continuing in 2016.
Back in March last year, the dollar index reached a high of 100.71, before coming under pressure. Then in November, it tested that high by rallying to 100.60. Non-commercials were net long a lot more contracts in March than they were in November. That is not a vote of confidence from these traders.
In the prior week, they cut back net longs to a nine-week low.
Currently net long 33.6k, up 208.
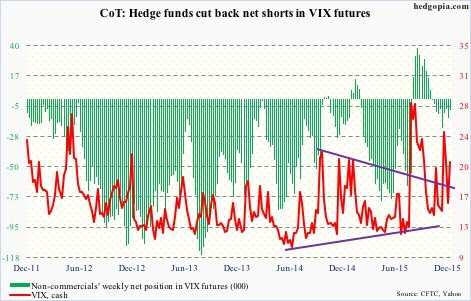
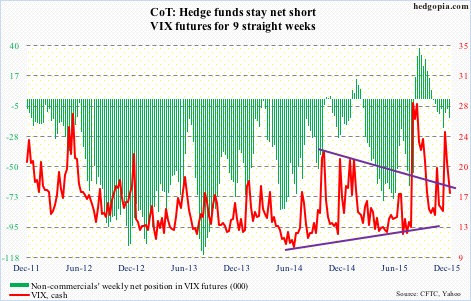
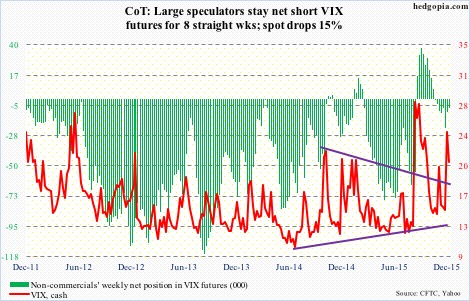
VIX: In the prior week, spot VIX was acting like it wanted to rally. That it has… continued to do so yesterday.
As recently as the middle of December, the spot shot up to just under 27, before reversing. No such spike-reversal signal just yet. That said, it was unable to hang on to the gains yesterday, as it got slammed in the last half hour. Worth watching for a spike that gets sold.
Currently net short 8.4k, down 5.4k.
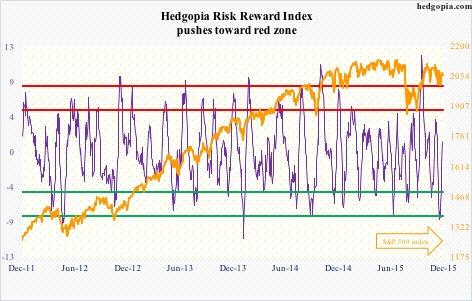
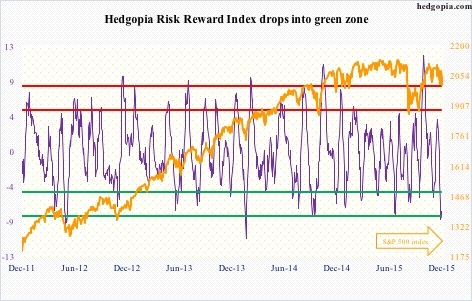
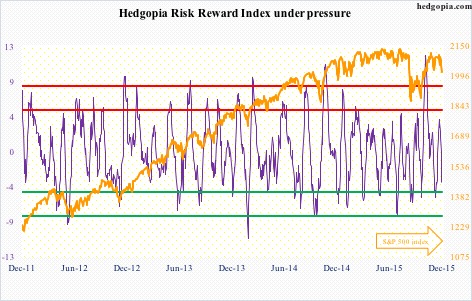
Hedgopia Risk Reward Index
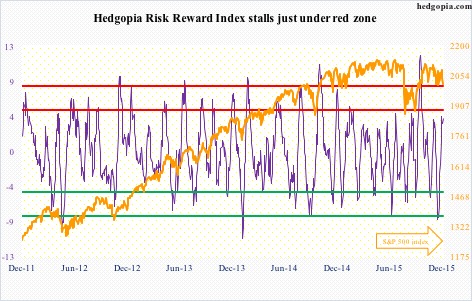
http://www.hedgopia.com/cot-peek-into-future-through-futures-24/
• George.
Click on "In reply to", for Authors past commentaries.
Trading Notes: Tuesday, January 5th
By Brett Steenbarger, Ph.D.
* January 5, 2016
* Great post from Bella on the kind of self-observation and diligence it takes to be a consistently successful trader.
* We continued the sharp decline in early trade Monday, but per yesterday's observation re: volatility, we saw a ferocious late-day rally that wiped out the day's declines. The intraday advance-decline line had been showing strength into the afternoon, leading to that late day rally. When we're oversold and selling can't push the market to new highs, that's when we're most vulnerable to the sharp short squeezes.
* The weakness has continued in overnight trade and, per the intermediate overbought/oversold measure below, we're not yet at oversold levels that have historically led to sustained bounces. This measure is based on 5, 20, and 100-day new highs versus lows among SPX stocks only (data from Index Indicators):

* That being said, we're quite short-term oversold per the measure of the percentages of SPX stocks trading above their short-term moving averages, per the chart below. When we're oversold like this on a short time frame, my leaning is to play make-it, take-it with short positions and not necessarily count on moves to extend over longer time horizons.

* Right now, it's just a one-day observation, but I do notice that despite yesterday's broad weakness, fewer stocks across all exchanges made fresh new lows than at the December low points. It would be very significant if those downside divergences were to hold up on further weakness in stocks.
http://traderfeed.blogspot.com/2016/01/trading-notes-week-of-january-4th-2016.html
• George.
Click on "In reply to", for Authors past commentaries.
Trading Notes: Monday, January 4th
By Brett Steenbarger, Ph.D.
* January 4, 2016
* With the sharp decline in China to start the new year, stocks have sold off sharply overnight. The decline on the heels of an already short-term oversold market confirms yet further that the intermediate-term cycle has turned downward, per the chart below:

* My measure of "pure volatility"--the volatility that we see per unit of market volume traded--has exploded higher with the overnight move. Spikes in pure volatility commonly occur near market bottoms, but the cycle measure above is nowhere near a bottom level. My concern here is that we're starting 2016 at a higher volatility regime, where we'll not only see high volume and volatility, but higher volatility for each unit of volume traded. That means we could see large moves even on relatively short time horizons. Short-covering rallies can be painful when volatility regimes explode.
* China and emerging markets broadly have underperformed U.S. stocks for a while now. This trend may be accelerating, as concerns about global weakness in the face of a strong U.S. dollar take hold. Such a global trend would make it difficult for the Fed to engage in further tightening and could weigh on the U.S. economy. These are themes I'll be tracking early in 2016.
http://traderfeed.blogspot.com/2016/01/trading-notes-week-of-january-4th-2016.html
• George.
Click on "In reply to", for Authors past commentaries.
Upgrades/Downgrades
* Updated: January 04, 2016 07:59 a.m. ET

Equity ratings changes direct from brokerage firms.
http://online.wsj.com/mdc/public/page/2_3024-UpgradesDowngrades.html?mod=topnav_2_3022
• George.
Stocks With the Largest Short Interest
* Thursday, December 31, 2015
> nyse
http://bigcharts.marketwatch.com/reports/bigmovers.asp?data=1&start=1&report=10&report_country_code=US&date=20151231
• George.
Click on "In reply to", to see reports from prior weeks.
Amateur Investors: Weekend Analysis
* January 2, 2016
For the first time in 140 years the S&P Composite failed to have a positive gain when the year ended in a "5". The last time a negative return happened was way back in 1875.

Meanwhile despite a slightly negative return of -0.7% in 2015 the S&P 500 has only had "1" significant down year since 2003 which was in 2008.

Next if we look at a historical chart of the Monthly S&P Composite in terms of Real Dollars plotted on a log scale notice the nice upward channel that has been in place. Also notice the S&P currently resides at the top of the upward channel (red line) which has been acting as significant resistance the past year.
As I have pointed out before it's been very rare to see the S&P rise to the top of its upward channel. Furthermore there has only been two occurrences when it has risen significantly above it which were in 1999/2000 and way back in the mid 1830's.

Keep in mind each time the S&P has reached or exceeded the top of its upward channel (red line) eventually it has reverted back to the mean which is reflected by the green line. In fact in every case it has actually dropped below the green line before a bottom has occurred (points A to B). This is why I have some concerns about the market going forward.

http://www.amateur-investors.com/AII_Weekend_AnalysisJan_2_16.htm
• George.
Click on "In reply to", for Authors past commentaries.
Trading Notes: Thursday, December 31st
By Brett Steenbarger, Ph.D.
* December 31, 2015
* The weakness yesterday has continued into early trading today, raising the odds that we've seen a price peak for the current cycle. If that is the case, we could see a meaningful correction back toward prior cycle lows. As has been the case for a while, weakness in the oil market has accompanied stock weakness.
* Here's where we stand with my favorite intermediate-term overbought/oversold measure. It appears to be cresting, as do my cycle measures.

My best wishes to readers for a happy, healthy, and profitable 2016!!
http://traderfeed.blogspot.com/2015/12/trading-notes-week-of-december-28th.html
• George.
Click on "In reply to", for Authors past commentaries.
Best Performing ETFs: Post-Financial Crisis
* December 31, 2015
http://www.dogsofthedow.com/best-performing-etfs-post-financial-crisis.htm
• George.
Best Performing ETFs: 12 Months
* December 31, 2015
http://www.dogsofthedow.com/best-performing-etfs-12-months.htm
• George.
Best Performing ETFs Today
* December 31, 2015
http://www.dogsofthedow.com/best-performing-etfs-today.htm
• George.
Daily Charts = SPY, $INDU, QQQ, IWM
* December 30, 2015
http://stockcharts.com/public/1107832/chartbook/308233753;
http://stockcharts.com/public/1107832/chartbook/308234274;
http://stockcharts.com/public/1107832/chartbook/308234284;
http://stockcharts.com/public/1107832/chartbook/308234291;
• George.
60 min Charts = $SPX, SPY, DIA, QQQ, IBB,
* December 30, 2015
http://stockcharts.com/public/1107832/chartbook/308233786;
http://stockcharts.com/public/1107832/chartbook/308233773;
http://stockcharts.com/public/1107832/chartbook/308234273;
http://stockcharts.com/public/1107832/chartbook/308234283;
http://stockcharts.com/public/1107832/chartbook/308233772;
• George.
Trading Notes: Wednesday, December 30th
By Brett Steenbarger, Ph.D.
* December 30, 2015
* I was looking for signs of weakening breadth in Tuesday's session and what we got was the reverse: consistent buying through the session, accompanied by strength in commodities. New highs among SPX stocks, as well as across all exchanges, hit their highest level since early December. The chart of breadth among SPX stocks only shows that we continue strong, with over 80% of stocks above their 3, 5, and 10-day moving averages. While profit taking from such levels is not at all unusual, that breadth strength is not typical of a market about to morph into a bear.

* My intermediate cycle measure is maturing as shown below:

* My five-day measure of selling pressure is at unusually low levels, meaning that it's been as much the absence of selling as the presence of huge buying that has lifted the market recently. Past occasions when we've seen similar low selling pressure levels have been late December, 2014; late February, 2015; the third week in March, 2015; and the third week in May, 2015. All led to short-term moves lower within a matter of days.
http://traderfeed.blogspot.com/2015/12/trading-notes-week-of-december-28th.html
• George.
Click on "In reply to", for Authors past commentaries.
Peek Into Future Through Futures
* December 29, 2015
The following are futures positions of non-commercials as of December 22, 2015. Change is week-over-week. (Due to Christmas last week, the CFTC released numbers on Monday, instead of last Friday.)
E-mini S&P 500: Outflows continued in the week ended last Wednesday. Another $7.6 billion exited U.S.-based equity funds (courtesy of Lipper). In the past three weeks, north of $29 billion came out of these funds. And since September 30th, $18.6 billion left.
This may be why shorts are beginning to press a little. Short interest on SPY, the SPDR S&P 500 ETF, went up eight percent mid-December, to 312.7 million shares. This is the highest in two months. That said, it is some 28 percent below the high three months ago.
Back then, shorts persistently built into that mid-September high, just when stocks were about to bottom out and rally. Soon followed a squeeze, with SPY short interest dropping to 278 million by the middle of November.
Viewed this way, the present level of short interest is probably not enough to set in motion another squeeze cycle. Besides, as stated earlier, flows are not cooperating.
Seasonality still favors stocks… at least that has been the case historically. But it is also a known seasonal phenomenon, with traders increasingly positioning earlier.
In the very near-term, there is room to rally. Daily overbought conditions still have room left for unwinding. Daily MACD just crossed up.
Here is the rub. With last week’s rally the S&P 500 sat right on its 50- and 200-day moving averages. Come Monday, it lost both. The consolation is that the index yesterday finished substantially off the lows.
The level to watch is 2090 on the way up and 2040 on the way down, followed by 2020 and must-hold 1990.
For the first time in nine weeks, non-commercials added to net shorts.
Currently net short 95.2k, up 19.9k.
Nasdaq 100 index (mini): The 4560 level continues to act like a magnet. Having lost it in the prior week, the index recaptured the level last week.
There is room for the index to push higher near-term, but here is the thing.
Daily momentum indicators such as the RSI and stochastics have reached the median, and this is where they can turn back if momentum is weak.
Apple (AAPL), which constitutes nearly 13 percent of the index, continues to be a wild card. It remains oversold on a daily chart, but has broken its June 2013 trend line. Moreover, there is potentially a head-and-shoulders pattern forming on a weekly chart, with the neckline break occurring around $105, which was saved last week.
Non-commercials continue to cut back net longs – now at a nine-week low.
Currently net long 47.9k, down 13.6k.
Russell 2000 mini-index: Short interest on IWM, the iShares Russell 2000 ETF, dropped 4.4 percent, to 99.7 million shares – an eight-month low. Since the end of September, it has dropped 24 percent. Between the periods, the Russell 2000 was up a mere 2.8 percent. Not much to write home about.
For a while now, investors/traders have not been showing much love for small-caps.
The 1210-1215 resistance has been in place since March 2014. Most recently, a rally attempt was repelled early this month. Before this gets tested again, small-cap bulls will have to now take out another resistance – 1170, which approximates the 50-day moving average.
The 200-day moving average is now pointing lower, with the 50-day flattish.
Non-commercials, having had bearish bias on small-caps for a while, in the prior week raised net shorts to a 10-month high.
Currently net short 47.2k, down 2k.
US Dollar Index: The dot plot tells us that FOMC members would wish to hike four times next year. Futures traders are pricing in only two. The dollar index is so far not buying the Fed’s hawkish message.
Back in March, the index reached a high of 100.71, before backing off. Then in November, that high was retested, as it rose to 100.60, before coming under renewed pressure.
Since the FOMC decision in the middle of the month, the dollar index is essentially unchanged, let alone take another stab at the afore-mentioned highs.
Also, non-commercials are nowhere near as net long US dollar index futures as they were back in March. In fact, in a week in which the Fed was all but certain to raise rates, non-commercials reduced net longs by 28 percent.
Last week, they cut back more, with holdings at a nine-week low.
Currently net long 33.4k, down 3.5k.
VIX: It has been a while spot VIX has vacillated around its 50- and 200-day moving averages. Having briefly dipped below 15 last Friday, it, once again, surged past both on Monday, although it was unable to close out the session near the highs.
Daily momentum indicators are oversold, and look to be itching to move higher.
In the meantime, the VIX-to-VXV ratio dropped to 0.8 last Friday – onto oversold zone – before rising to 0.86 yesterday. There is room for it to continue moving higher before it gets to overbought zone, and that could spell trouble for stocks.
Spot VIX’s probable path of least resistance near-term is up.
Currently net short 13.8k, up 6.4k.
Hedgopia Risk Reward Index
http://www.hedgopia.com/cot-peek-into-future-through-futures-23/
• George.
Click on "In reply to", for Authors past commentaries.
Trading Notes: Tuesday, December 29th
By Brett Steenbarger, Ph.D.
* December 29, 2015
* Continued profit taking early in the day on Monday led to an afternoon bounce and further strength overnight, as we engage in what looks like topping behavior. I will be watching breadth measures closely: if this, indeed, is topping, we should see reduced breadth. Yesterday we had 311 stocks across all exchanges make fresh monthly highs versus 239 new lows. Two days earlier, the new highs were 514 and 168. Below is a chart that tracks fresh three-month new highs minus lows (red line) versus SPY (blue line):

* The relative weakness in commodity related sectors (XLB, XLE, XME) continues, as does relative weakness among high yield bond funds (JNK, HYG) and emerging market stocks (EEM) and China (FXI). These continue to be on my radar, as they are significant drags on stocks overall.
http://traderfeed.blogspot.com/2015/12/trading-notes-week-of-december-28th.html
• George.
Click on "In reply to", for Authors past commentaries.
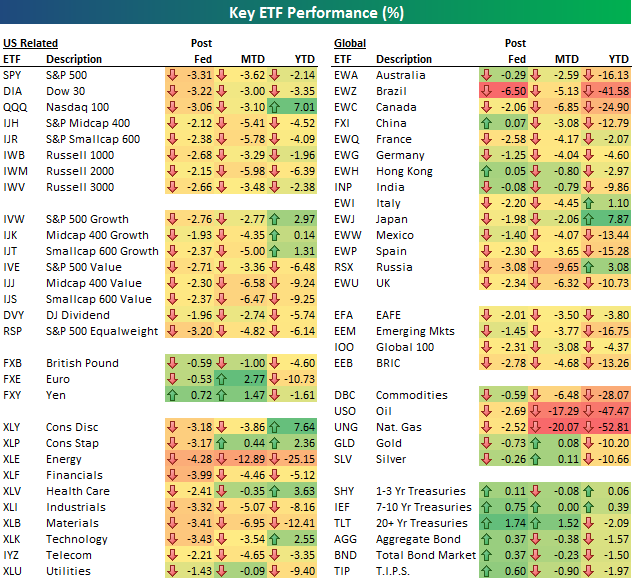
Key ETF Performance (%)
* December 28, 2015

https://www.bespokepremium.com/the-closer/bepokes-post-market-closer-report-122815/
• George.
Trading Notes: Monday, December 28th
By Brett Steenbarger, Ph.D.
* December 28, 2015
* Friday's partial session finished with a late decline, which has continued into the overnight session, as stocks seem to be following oil prices. I continue to look to commodity and credit markets, as well as the relative performance of emerging markets to developed markets, to update views on deflationary impacts upon the global economy. It is difficult to envision a bull market environment if we're seeing falling commodities, yield curve flattening, weak emerging markets, and distressed credit markets.
* A few of my overbought/oversold measures are not at levels normally seen at market tops, so I'm open to the possibility of some back-and-forth movement this week. Should we work off the prior oversold level in time more than in price and put in a lower high, that could set the stage for a stronger downward move.

* It would not surprise me to see light trading this week, given many traders' desire to take time off before the new year. Low volume generally accompanies narrow ranges. So far, however, the day's downward move in oil is not a small move. This is worth watching.
http://traderfeed.blogspot.com/2015/12/trading-notes-week-of-december-28th.html
• George.
Click on "In reply to", for Authors past commentaries.
The S&P 500 intraday charts over the past 14 years in the Christmas season. 9 of 14 times the index was positive and 9 of 14 times te index had a small reversal after Christmas


chart courtesy of marketvolume.com
Stocks With the Largest Short Interest
* Thursday, December 24, 2015
> nyse
http://bigcharts.marketwatch.com/reports/bigmovers.asp?data=1&start=1&report=10&report_country_code=US&date=20151224
• George.
Click on "In reply to", to see reports from prior weeks.
Amateur Investors: Weekend Analysis
* December 26, 2015
The S&P 500 rallied back above the 2059 level this week and now is just positive for the year. If it can hold above the 2059 level next week then that will make 12 out of the last 13 years with a positive or breakeven return. The only year with a negative return since 2003 was in 2008.

Meanwhile looking at an intra day chart shows the S&P 500 rallied back to its first area of upside resistance near the 2067 level (green line). If the S&P rises above the 2067 level the next area of resistance appears to be near 2090 (blue line).

http://www.amateur-investors.com/AII_Weekend_AnalysisDec_26_15.htm
• George.
Click on "In reply to", for Authors past commentaries.
Wishing everyone Merry Christmas and a healthy and prosperous New Year!

• George.
Screen ETFs Using 14 Criteria
* December 23, 2015
http://online.wsj.com/public/quotes/etf_screener.html?mod=topnav_2_3022
• George.
Sort ETFs by Investment Objective
* December 23, 2015
http://online.wsj.com/public/quotes/browse_etfs.html?mod=topnav_2_3024
• George.
Trading Notes: Tuesday, December 22nd
By Brett Steenbarger, Ph.D.
* TUESDAY, DECEMBER 22, 2015
* Here's what I found when I studied the most successful traders I've worked with--and here's what it could mean for your trading performance in the coming year.
* We've had a few recent bouts of selloff in the stock indexes. Interestingly, new monthly lows across all stocks peaked on December 14th at 2025. On Friday we closed lower in SPY but there were only 1131 new lows. Yesterday, new lows peaked at 867. My intermediate term indicators continue in oversold territory. With continuing weakness in oil and high yield markets, rallies have been fleeting. Breadth measures, however, are not weakening. With a late rally yesterday, it's the bulls' turn to show what they can muster. It is difficult for me to envision a solid rally without strength in oil, weakness in the dollar, and firmness in those high yield bond markets. I continue to watch those markets closely.
* Here's a chart you won't see elsewhere: It's a cumulative running total of buy signals minus sell signals for the Commodity Channel Index (CCI) across all NYSE stocks. Note the steady deterioration in net strength for most of 2015, which has accelerated recently. A similar picture can be found when tracking cumulative buy vs. sell signals for other technical systems. Quite simply, more stocks are demonstrating significant weakness than significant strength.

http://traderfeed.blogspot.com/2015/12/trading-notes-week-of-december-21st.html
• George.
Click on "In reply to", for Authors past commentaries.
Jeffrey Saut: The call for this week
* December 21, 2015
Out of balance
Two weeks ago the headline read, “Beware The ‘Massive Stop Loss’ - JPM's Head Quant Warns This Unexpected Downside Catalyst Looms Next Week.” For the first three days of last week that looked to be wrong, but it certainly was true late week. I am hoping the Thursday/Friday massive $1.2 trillion expiration was another aberration just like the 1100 Dow Downer of August 24th and the May of 2010 Flash Crash. As stated, the set up for a “rip your face off rally” was just about perfect with December 11th’s 90% Downside Day followed by last Monday/Tuesday’s back to back 80% Upside Days, meaning 80% of the total Up to Down volume came in on the upside. That’s typically the way bottoms are made. Normally one would expect to see some downside follow-through this morning, but preopening S&P futures are up 18 points at 6:00 a.m. So hopefully last Thursday/Friday’s “Massive Stop Loss” was indeed an aberration.
Upgrades/Downgrades
* Updated: December 21, 2015 08:05 a.m. ET
Equity ratings changes direct from brokerage firms.
http://online.wsj.com/mdc/public/page/2_3024-UpgradesDowngrades.html?mod=topnav_2_3022
• George.
ETF Tools
* December 20, 2015

 New Highs / Lows - List of ETFs making new highs and lows
 Volatility - Chart the rolling realized volatility of up to five ETFs
 Correlation - See how the relationship between two ETFs has varied over time.
 Dividend Yield - Compare the dividend yield of two ETFs
 Total Return vs Price Return - See the impact of dividend reinvestment - chart the difference between price return and total return
http://www.etfreplay.com/tools.aspx
• George.
Stocks With the Largest Short Interest
* Friday, December 18, 2015
> nyse
http://bigcharts.marketwatch.com/reports/bigmovers.asp?data=1&start=1&report=10&report_country_code=US&date=20151218
• George.
Click on "In reply to", to see reports from prior weeks.
Peek Into Future Through Futures
* December 19, 2015
The following are futures positions of non-commercials as of December 15, 2015. Change is week-over-week.
E-mini S&P 500: For the week ended Wednesday, $13.2 billion left U.S.-based equity funds (courtesy of Lipper). This follows withdrawal of $8.6 billion in the prior week.
On September 29th, the S&P 500 index successfully tested August lows, before getting on a powerful rally. Flows, however, failed to cooperate. Secondly, the index has been going sideways/down the past five weeks, and money is beginning to come out, as can be noticed particularly the past couple of weeks. Since September 30th, $11 billion has now left these funds.
In the meantime, foreigners continue to shun U.S. equities. In October, the 12-month running total of net foreign purchases of U.S. equities was minus $84.9 billion. The last time this metric was positive was two years ago.
Bulls have seasonal tailwind at their back, but if flows continue to behave this way, it is only a matter of time before stocks run into a headwind.
From bulls’ perspective, the good thing is that on Monday buyers showed up near 1990 – must-hold support. Resistance at the 50- and 200-day moving averages, which have now converged at 2062, proved too strong. The 1990 support is once again in play.
Non-commercials continue to cut back net shorts – now at a 28-week low.
Currently net short 75.3k, down 5.5k
Nasdaq 100 index (mini): On Monday, the index found support at its 200-day moving average, followed by a Thursday close right on its 50-day moving average. Friday, it lost that average.
Apple (AAPL), which makes up nearly 13 percent of the index, does not act well. It has broken its June 2013 trend line, and is meeting with resistance at the underside of that broken support. Also, there is potentially a head-and-shoulders pattern forming on a weekly chart, with the neckline break occurring around $105 – worth watching.
Beginning April this year, the 4560 level on the index has been a line in the sand of sorts. This has once again been lost. The 200-DMA is probably once again in play.
Currently net long 61.5k, up 7.5k
Russell 2000 mini-index: The 200-day moving average is now pointing lower, with the 50-day flat to slightly lower.
Things would probably look a whole lot different if early this month the index succeeded in taking out the 200-DMA, which at the time also approximated the 1210-1215 resistance in place since March 2014.
It has been a while investors have not fancied small-caps. At this stage in the cycle, it is hard to imagine them putting on their risk-on hat. In this scenario, the medium- to long-term outlook looks bleak.
That said, near-term is another matter. Daily conditions are oversold. Curiously, a reverse head-and-shoulders pattern seems to be developing on a daily chart. The neckline lies at that afore-mentioned 1210-1215 resistance… hard to imagine a breakout.
As things stand, the best that could happen is unwinding of daily overbought conditions.
That said, non-commercials do not agree, having raised net shorts to a 10-month high.
Currently net short 49.2k, up 16.7k
US Dollar Index: Responding to the Bank of Japan’s surprise easing move on Friday morning, the dollar took a wild ride. Immediately after the BoJ announcement, the greenback rallied, but then the markets decided the unexpected easing did not go far enough, pushing up the yen.
The BoJ left the overall target of annual asset purchases unchanged at around ¥80 trillion, but said it will lengthen the average maturity of the Japanese government bonds it purchases to seven to 12 years from seven to 10 years. Plus, it will buy another ¥300 billion of exchange-traded equity funds, which will be in addition to the ¥3 trillion in ETFs it has purchased annually since late 2014. Desperate!
Despite the reaction post-BoJ decision, the dollar index can go either way near-term. Medium- to long-term, for it to break out of March and November (this year) highs, the fed funds rate probably needs to go up at least a point next year – not likely.
Interestingly, in a week in which the Fed was all but certain to raise rates, non-commercials reduced net longs by 28 percent.
Currently net long 36.9k, down 14.1k
VIX: Last week, spot VIX surged past 50- and 200-day moving averages as well as horizontal resistance at 16 and 21-22. Come Monday, it spiked another 10 percent, before reversing.
More often than not, a spike reversal is followed by continued pressure on the spot. That was the case until Thursday when volatility buyers stepped up to defend 16.
The spot has once again reclaimed the afore-mentioned averages.
That said, VIX is not done unwinding daily overbought conditions. Friday, it was not able to hold on to gains, even as stocks in general closed near session lows.
In the meantime, the VIX to VXV ratio, at 0.97, is beginning to drop from overbought zone. Last Friday, the ratio spiked to unity.
The probable path of least resistance near-term? Down.
Currently net short 7.4k, down 2.7k
Hedgopia Risk Reward Index
http://www.hedgopia.com/cot-peek-into-future-through-futures-22/
• George.
Click on "In reply to", for Authors past commentaries.
Key ETF Performance (%)
* December 18, 2015
https://www.bespokepremium.com/bespoke-report/the-bespoke-report-121715/
• George.
Trading Notes: Friday, December 18th
By Brett Steenbarger, Ph.D.
* December 18, 2015
* Thursday's action during New York hours completely reversed recent strength, with price weakness evident essentially from the opening bell. When we did get some decent buying flows in the second half hour of trade, those were unable to push the market to new highs. Meanwhile, we saw a resumption of weakness in oil and high yield markets and strength in the U.S. dollar. From that point forward we traced out a trend day to the downside, as selling flows took over. When you get meaningful buying that cannot push prices to fresh highs (or vice versa), that is often a great tell for intraday trading. Those buyers are trapped on subsequent weakness and contribute to the continued decline.
* Per my plan, I bought the early weakness, went green on the trade with the morning buying, and then proceeded to lose that gain and go into the red. "That shouldn't be happening," was my response to the price action and I stopped out with a modest loss on the position. When good trades (trades based on historical tendencies) go bad, there is information there. Quite simply, the idiosyncratic influences of the oil and credit weakness, dollar strength, and market maker selling to hedge put option losses in the face of quadruple witching overwhelmed any historical tendency for an oversold market to continue higher. This is why flexibility in following the tape is paramount; getting locked into a market view blinds one to those unique influences that can turn markets.
* That being said, I'm not convinced that yesterday's weakness (and some weakness so far in pre-opening trade) is a one-off that we can simply attribute to options expiry. The weakness in emerging market stocks is real; the weakness in commodities is real; the weakness in high yield bond markets is real; and the number of stocks making annual lows vs. highs has been expanding. All of this leaves me open to the possibility that we work off the recent oversold condition in a low Sharpe manner, ultimately making lower highs in the major indexes, and setting the stage for a meaningful decline. The weaker and choppier any bounce from this latest weakness, the more open I become to that hypothesis.
* I find the weakness in AAPL to be noteworthy. It's one of those bellwether issues that bears watching. Notice also how small and midcap stocks (IWM) are further from their 2015 price highs than large caps. Microcaps (IWC) are similarly relatively weak. On the other hand, the more defensive consumer staples shares (XLP) touched a new high recently. Not exactly a pattern of relative strength that speaks to broad and strong economic growth expectations.
http://traderfeed.blogspot.com/2015/12/trading-notes-week-of-december-14th.html
• George.
Click on "In reply to", for Authors past commentaries.
Urban Carmel: Mid-Week Update
* Thursday, December 17, 2015
Below are a few mid-week thoughts.
Trend: The plunge in equity prices last week ended right on expected support. For SPY, that support was the bottom of the range that has persisted for 10 of the past 11 months. Risk/reward was attractive at the low; as price moves higher towards the top of the range, it becomes less so.

Support for NDX at the mid-November low held; price is now back to about 1% from the top of the 5-month range.

DJIA is also about 1% from the recent November high resistance, but there is room in its larger channel to move 3% higher to the top of its 11-month range. Of note is that DJIA will have a golden cross tomorrow, together with SPX (SPY and NDX have already had their golden cross; chart here).

So will US equities continue to run higher? Our best guess is that strength into year-end will be retraced in the new year. In other words, if Santa comes, fade him.
Seasonality: One the factors arguing in favor of a run higher is of course seasonality. The period from mid-December until early January is normally very bullish. Given the steep fall in the past week, that pattern might be especially potent as traders gave up on the year-end rally (today is Day 13; data from Sentimentrader).

Sentiment: Even before the plunge at the end of last week, more than $13b had flowed out of equity funds in the prior 5 days. That was a multi-year high and reflected extreme pessimism among traders.
This week, the Investors Intelligence bull/bear ratio dropped to 1.3x, the lowest since mid-October. The AAII bull-bear spread dropped to minus 15%, the second lowest in nearly 3 years. Evidence points mostly to excessive bearishness at a time of the year when investors are normally bullish.
Moreover, globally, fund managers are sour on US equities: they are now 19% underweight the US, an 8 year low. US equities normally outperform under similar instances (data from BAML; a full post on this here).

Also, fund managers are heavy cash (5.2% of their assets). Again, similar levels are associated with positive equity performance (data from BAML).
Volatility: Last week ended with VIX over 20. On Monday, VIX was 3 standard deviations above the mean: an extreme. Finally, the VIX term structure had inverted at the lows. Normally, volatility would subside after events like these. That should especially be the case as the markets head into the holidays.
Macro: The FOMC elected to initiate a rise in rates this week. This reflects confidence in the economy that is subsequently reflected in positive gains in equities. That linkage is both intuitive as well as empirical (data from Allianz)

Real retail sales this week climbed to a new all-time high. Consumption continues to grow.

Housing starts are up 16% in the past year; the latest figures show starts at the fourth highest level in the past 8 years. Permits are the second highest in 8 years. Strength in housing has a strong follow-on affect into the rest of the economy...
http://fat-pitch.blogspot.com/2015/12/mid-week-update_17.html
• George.
Click on "In reply to", for Authors past commentaries.
Upgrades/Downgrades
* Updated: December 17, 2015 08:04 a.m. ET
Equity ratings changes direct from brokerage firms.
http://online.wsj.com/mdc/public/page/2_3024-UpgradesDowngrades.html?mod=topnav_2_3062
• George.
Trading Notes: Wednesday, December 16th
By Brett Steenbarger, Ph.D.
* December 16, 2015
* Many traders try to predict what will happen next when they don't understand what is happening now. Here's an article that addresses that situation.
* Yesterday's post noted the oversold situation in the market and cited bullish expectations. Those played out well in yesterday's trade and now in the overnight session. Today's trading will be dominated by the Fed meeting announcement in the afternoon. With traders focused on recent turmoil in high yield markets and the drop in oil, some are anticipating dovish messaging from the Fed. It is not clear to me that this will be the Fed's primary focus, which could leave room for a "hawkish"/bearish surprise. That being said, given the queries cited yesterday, buying weakness that holds above overnight and prior day's lows continues to make sense.
* Note that we've bounced nicely in short-term breadth, given yesterday's rally. If this is the start of a bull move higher, we should see the "overbought" condition stay overbought for multiple days, as the early phase of an upward cycle typically features momentum. Where we're at in cycles helps determine whether we can expect short-term momentum versus mean reversion.

http://traderfeed.blogspot.com/2015/12/trading-notes-week-of-december-14th.html
• George.
Click on "In reply to", for Authors past commentaries.
Typical second-half December rally is likely underway
By Stock Trader's Almanac
* December 15, 2015

In some respects this December has felt more like an October than a typical December. Market volatility, measured by the CBOE Volatility index (VIX), spiked as high as 26.81 on December 14 and has been above 20 for three straight days after the second (S&P 500) or third (DJIA and NASDAQ) worst weekly loss of the year. The Russell 2000 small-cap index had its worst week of 2015 last week, off 5.1%.
We suspect much of this year’s first-half-December weakness was the result of heavier than usual tax-loss-selling pressure and Fed rate jitters. Energy stocks and crude oil had another tough year and were amongst last week’s biggest losers. High-yield bonds, many of which are linked to energy, also had a challenging year and found themselves being aggressively sold last week as well. The pace and magnitude of early-December’s declines would seem out of the ordinary at first glance. However, based upon the next four charts, this December is still well within the range of what the last 21 Decembers experienced.


These charts represent a somewhat different take on seasonality, but still apply the basic approach as many of our other seasonality charts. Instead of plotting the average percent change, one trading day at a time for the time period, we are plotting the minimum and the maximum for each trading day during the time period. The Day 21 Min value represents the worst December since 1994 and the Max value represents the best December finish. NASDAQ’s 21.98% gain in December 1999 pushes its min-max range to the largest spread amongst the four indices.
Of the four major indices plotted above, only Russell 2000 has exceeded the low-end of its 21-year December trading range. DJIA, S&P 500 and NASDAQ are trending in the lower half of the range, but remain comfortably above it thus far. The arrival of mid-month, today, accompanied by gains yesterday and today suggests the worst of tax-loss selling is likely over and the typical second-half December rally is likely underway.
http://jeffhirsch.tumblr.com/post/135279303398/typical-second-half-december-rally-is-likely
• George.
Trading Notes: Tuesday, December 15th
By Brett Steenbarger, Ph.D.
* December 15, 2015
* I found yesterday afternoon's trading in ES to be very constructive. We had significant bouts of selling pressure (high negative TICK readings) but price held above its morning lows. Since that time, we've seen a nice rally in stocks in European hours. The inability of selling to push prices lower and the inability of buying to push prices to new highs is often a good tell for price reversals. (Interestingly, the NYSE TICK readings for much of the day were much more negative than the TICK readings I look at that cover all stocks, including small caps and transactions on regional and electronic exchanges. That all-stock TICK is tracked via e-Signal. I will be monitoring divergences between these measures closely to see if there's consistent information there. As one savvy trader pointed out, the NYSE TICK is probably more dominated by bonds and bond-related shares trading on the exchange).
* Meanwhile, we're in pretty oversold territory as the chart below indicates. This tracks the number of SPX stocks making fresh highs vs. lows over a 5, 20, and 100 day time frame. (Data from Index Indicators). In the past couple of years, returns have been favorable when we've reached such oversold levels. Since 2010, when this measure has been in its most oversold quartile, the next five days in SPX have averaged a gain of +.63%. When the measure has been in the other three quartiles, the next five days have averaged a gain of only +.04%.

* In a future post, I'll be talking more about my research into market cycles. For now, here's a look at one of my cycle measures. It, too, shows us at quite oversold levels. Since 2012, when cycles have been in their most oversold quartile of values, the next ten days in SPY have averaged a gain of +1.05%. The remainder of occasions have averaged a ten-day gain of only +.33%.

http://traderfeed.blogspot.com/2015/12/trading-notes-week-of-december-14th.html
• George.
Click on "In reply to", for Authors past commentaries.
Jeffrey Saut: The call for this week
* December 14, 2015
It’s beginning to look a lot like Christmas . . . not
The long awaited FOMC rate ratchet is on queue and we look for a trading bottom coincident with that event. The equity markets are massively oversold, support levels are at hand, and everyone is bearish. Friday’s Fade did nothing to upset the bullish bias except continue the broad and volatile sideways corrective pattern from October’s upside explosion. So while it is natural to read negativity into Friday’s drop, it is entirely in keeping with the bullish scenario. This morning all is quiet on the western front with Chinese Industrial Production and Retail Sales both beating estimates, while in Europe EMU Industrial Production also beat estimates, leaving the pre-opening S&P futures flat.
Stocks With the Largest Short Interest
* Friday, December 11, 2015
> nyse
http://bigcharts.marketwatch.com/reports/bigmovers.asp?data=1&start=1&report=10&report_country_code=US&date=20151211
• George.
Click on "In reply to", to see reports from prior weeks.
Amateur Investors: Weekend Analysis
* Saturday, December 12, 2015
During the past several weeks the Volatility Index (VIX) was exhibiting a Triangle pattern which broke out to the upside this week. Normally one would expect it to follow through to the upside with an eventual move into the mid to upper 30's.

However the month of December historically has favored a positive bias for the market so I would be surprised if the market continued to sell off into the end of the year. The next support range in the S&P 500 is from 1991 to 1962 which are the 50% and 61.8% Retracement Levels from 1867 to 2016. Thus I would expect the S&P 500 to bounce from one of these levels next week. Also keep in mind for the S&P 500 to finish positive for the year it will have to close above the 2059 level by the end of the month.

Meanwhile for the longer term there are some disturbing chart patterns developing in some of the major averages. The Russell 2000 has formed a potential Head and Shoulders Top pattern with the Neckline support area near 1100.

Meanwhile the Equally Weighted S&P 500 is exhibiting a similar pattern with Neckline support around 2950.

Furthermore the Wilshire 5000 is also exhibiting a similar pattern as well with Neckline support around 1950.

I expect the Necklines will be tested at some point in the early half of 2016 and it will be very telling how they act near these key support areas going forward. If the Necklines fail to hold then a much larger correction may evolve similar to what occurred in 2011. Notice the S&P 500 had formed a Head and Shoulders Top pattern back then and when the Neckline failed to hold this led to additional selling pressure.

http://www.amateur-investors.com/AII_Weekend_AnalysisDec_12_15.htm
• George.
Click on "In reply to", for Authors past commentaries.
Urban Carmel: Weekly Market Summary
* Saturday, December 12, 2015
Summary:
The selling on Friday was extreme; there is typically some follow through downward momentum in the day(s) ahead.
SPY and NDX are near support and breadth is either washed out or close to being so. Volatility experienced an extreme spike; mean reversion usually follows. Seasonality, especially with December OpEx up next, is very bullish. All things being equal, risk/reward should be skewed higher.
The wild card is oil: equity markets are being driven lower by falling oil prices and their impact on high-yield. That could pressure markets further. Adding to the drama is the Fed is expected to initiate the first rate hike since 2006 this week.
* * *
For the week, SPY and NDX lost 3.6%, about the same as the high-yield ETF, HYG. Oil was the biggest loser, dropping 11%.
The week's biggest move belongs to VIX, which gained an astounding 63%.
What's going on?
First, recall that SPX has seen an average drawdown in December of 3.7% since 1928. Since the December 1 close, SPY is now down 4.2%. So what has happened is, in some ways, not so unusual.
Second, while December is typically very strong, the beginning of the month is not. The positive performance in December typically starts in the second half (meaning the week that's upcoming). Again, so far nothing extraordinarily unusual.
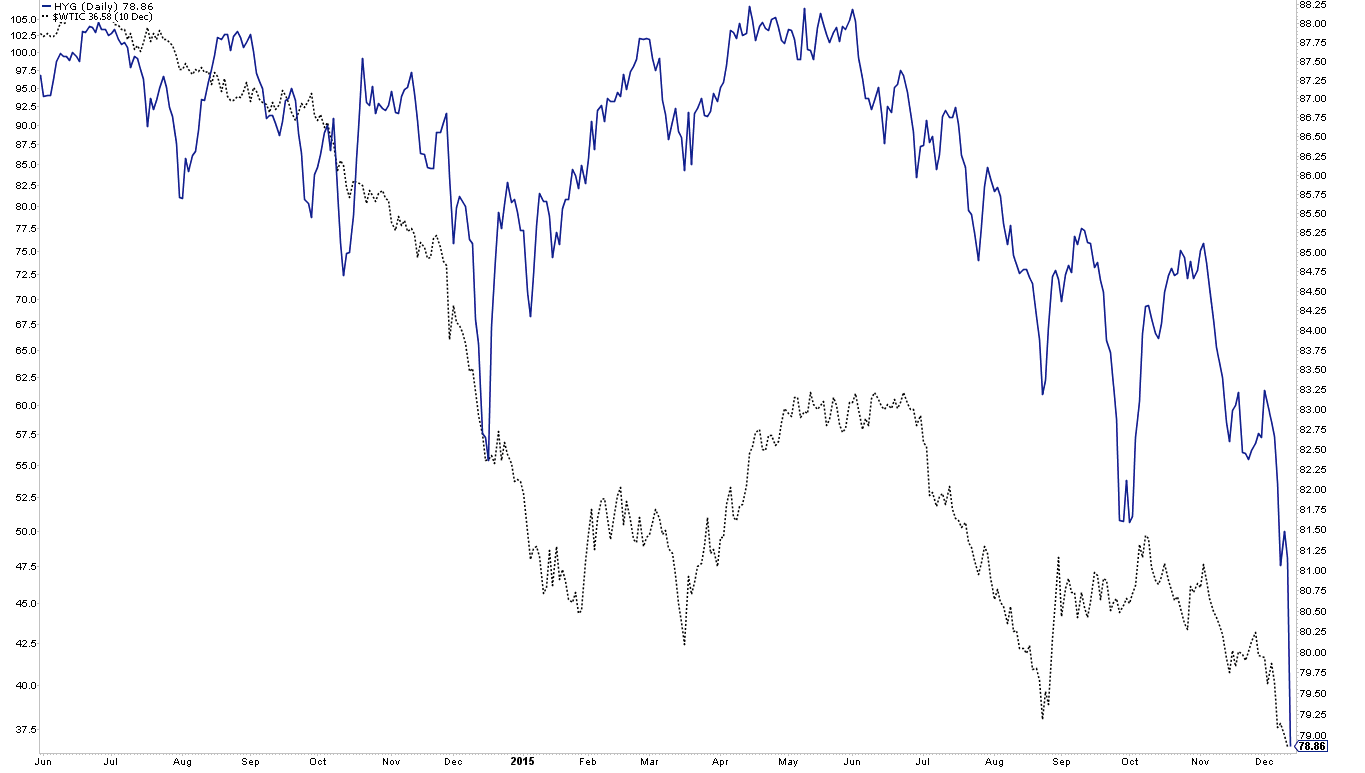
Third, and most importantly, the market is being driven by the collapse in oil. About 15% of the high-yield market is exposed to energy; so, falling oil (gray line) is pushing high-yield prices lower (blue line). And lower high-yield price (wider spreads) is creating concern that a larger credit crisis is unfolding, foreshadowing a recession.
Most of the drama is taking place overnight: SPY fell $7.70 this week, of which an astounding $5.20 (68%) was a result of overnight gap downs.
The drop this week put SPY near the bottom of its 2015 range. This comes just one week after closing about 1% from a new all-time high. While jarring, the index did the exact same move in the beginning of November. Aside from a month this summer, SPY has been trading between 202 and 212 since February.
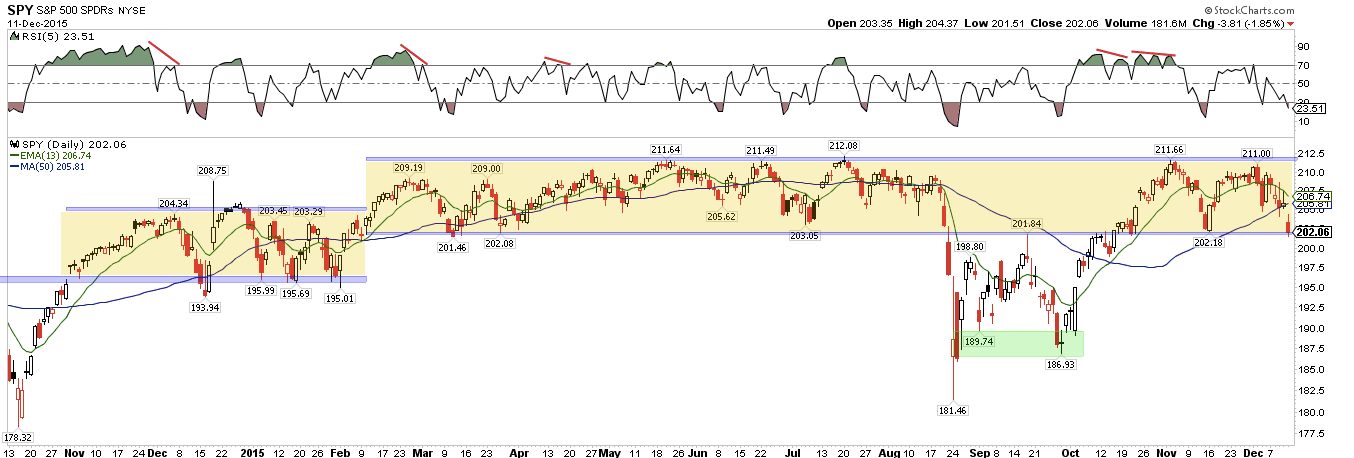
This area should be good initial support, as it has been in the past. If there is follow through weakness next week, the next level to watch is 199.3; this is WS1 (green line) and also an open gap from October 15 (arrow). That level represents risk of 1.5% from Friday's close.

Recall that the leader, NDX, made a new ATH last week. It's in the middle of its range and about 1% above the mid-November pivot at 4500 (risk). This is the first backtest of the rising 50-dma in two months. Note that the market pierced this same moving average last December before a strong rally (arrow).
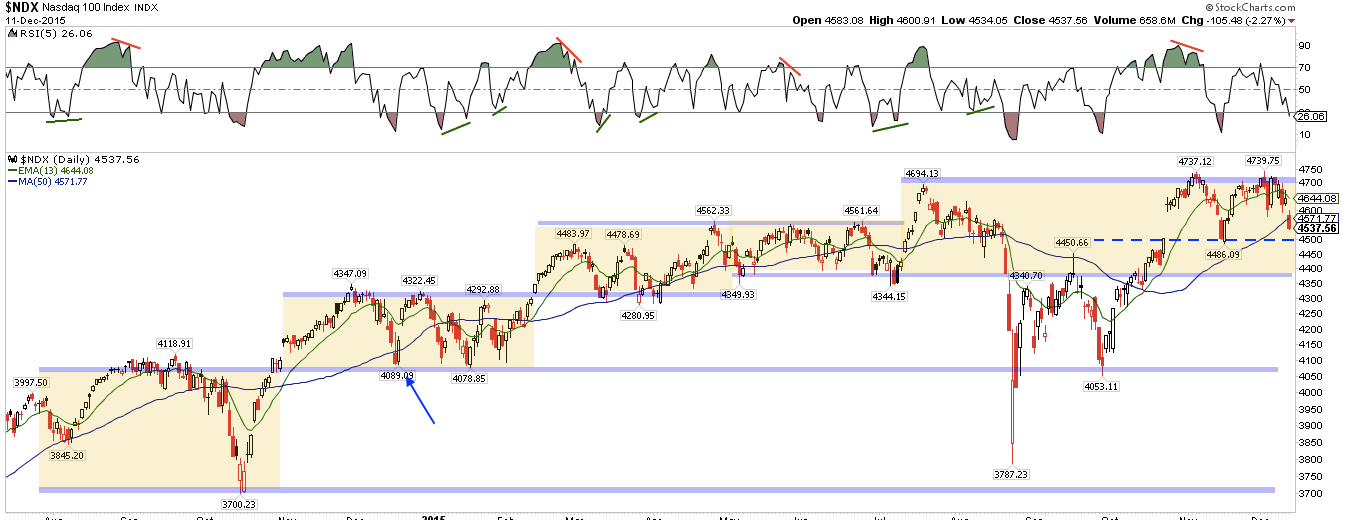
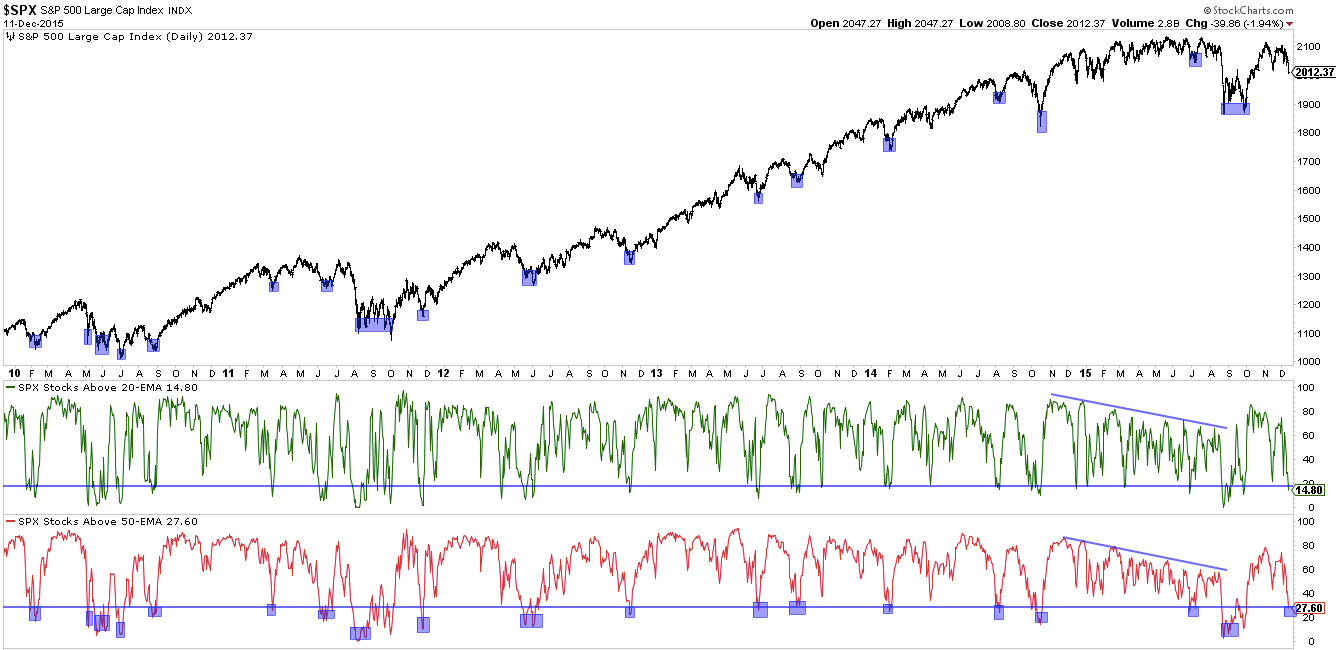
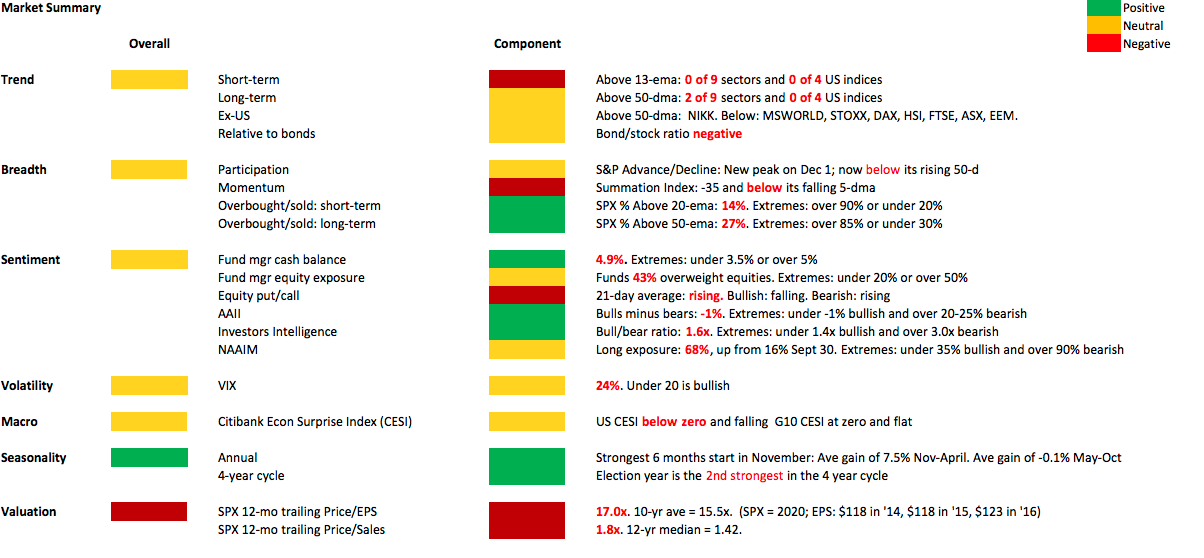
It was a horrible week for breadth. All nine of the SPX sectors closed below their 50-dma. Less than 30% of SPX companies are now above their 50-ema (lowest panel). This hasn't always marked the exact low in the index, but it has usually been very close to a washout where a low begins to form (blue shading).
That Friday may not be the exact low is also brought out by two other statistics.
First, when Friday closes down more 1.5%, the following Monday has had a "lower low" 95% of the time (86 of 90 instances since 1990; data from James DePorre).
Second, Friday was a major distribution day (MDD), meaning more than 90% of the volume on the NYSE was negative. That represents strong selling pressure and that momentum normally carries over into the days ahead.
Notably, the McClellan Oscillator (NYMO) closed at minus 82 on Friday. 85% of the time (28 of 34 instances since 1998) SPY has had some bounce before losing too much more. Half of the cases where it fell further right away were in bear markets, arguably not the case now (data from @RickyRoma0).

In the chart above, it is also notable that 2014 was the only other year where NYMO closed this low in December. The market rallied strongly from that point forward.
That is not entirely surprising since seasonality is strong in December. The period for positive performance in SPY begins next week (Monday is Day 10; data from Stock Almanac).
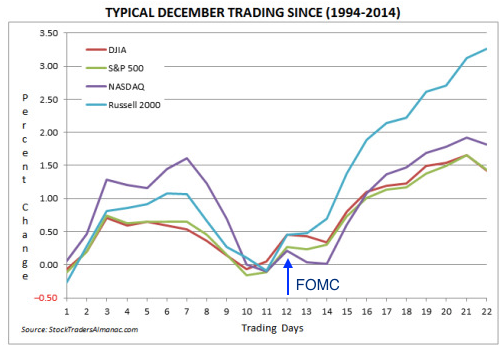
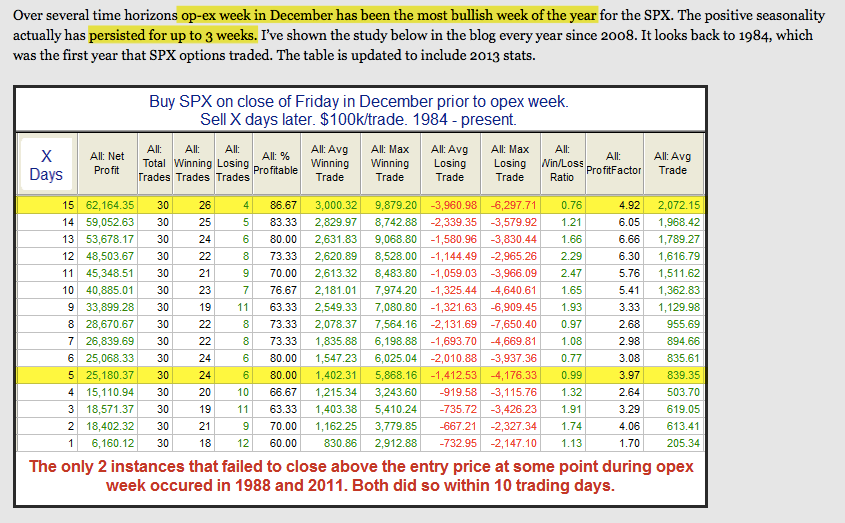
Next week is also December OpEx. This is one of the most bullish weeks of the year. SPY has closed higher from the prior week close within 10 days every time in the past 30 years (data from Rob Hanna).
Also notable this week is that VIX gained 63%. This is quite rare and has normally been at or near a low in SPY. Shown first are two cases in 1998 and 2001.

Next are cases in 2011, 2014 and 2015. Again, each was at or near a low in SPY.

Friday also marked the second spike in VIX above its Bollinger Band (BB) in the past month. We've noted many times in the past that VIX spikes tend to come in pairs within a month, with SPY making a lower low with the second spike (as it did today). SPY then normally rises; the safe play is to wait for VIX to close back under its upper BB.
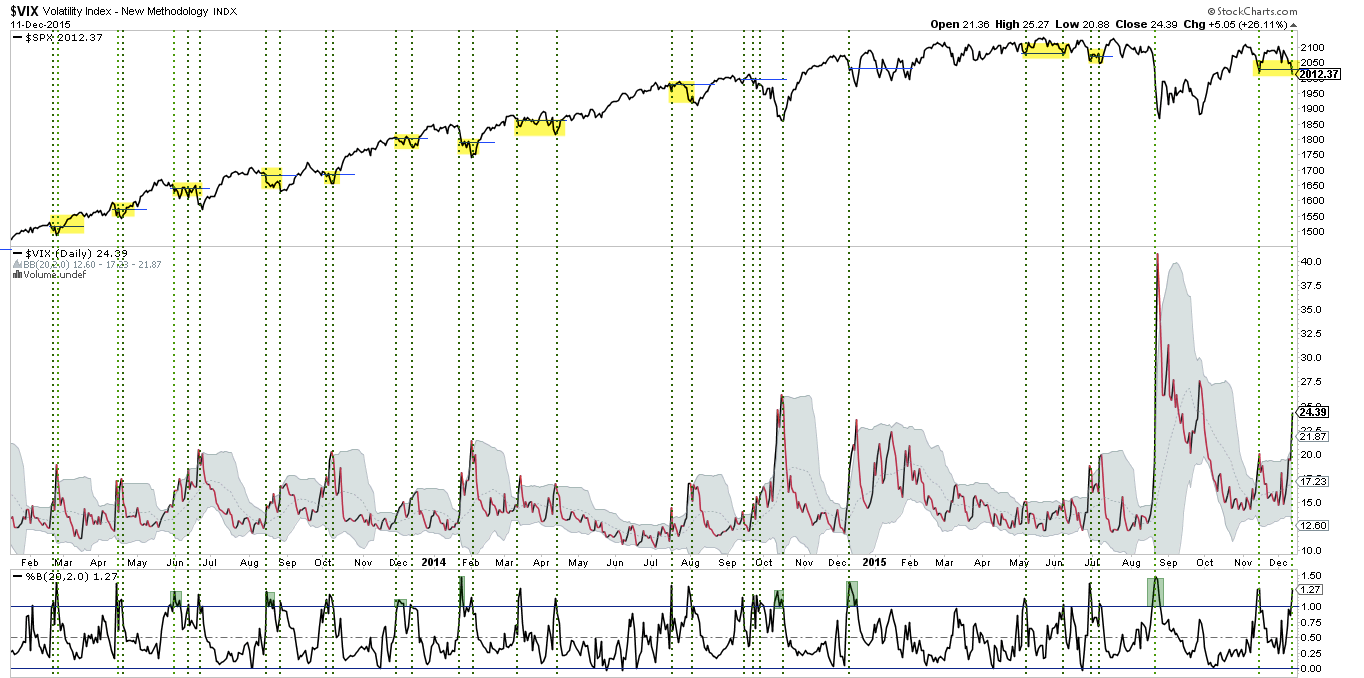
VIX also closed well over 20. This has most often been very close a low in SPY (exceptions highlighted in blue).

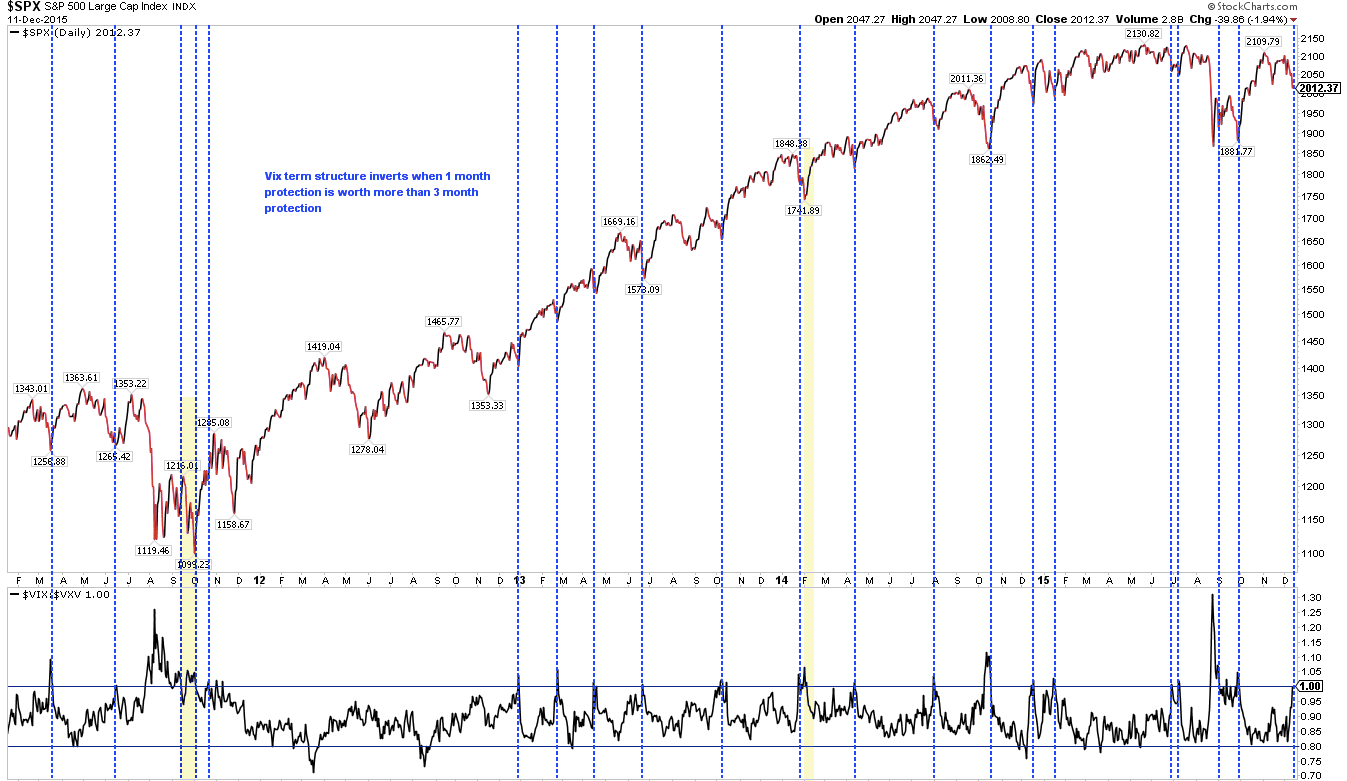
The VIX term structure also inverted on Friday. Again, this most often occurs very near a low in SPY (exceptions highlighted in yellow).
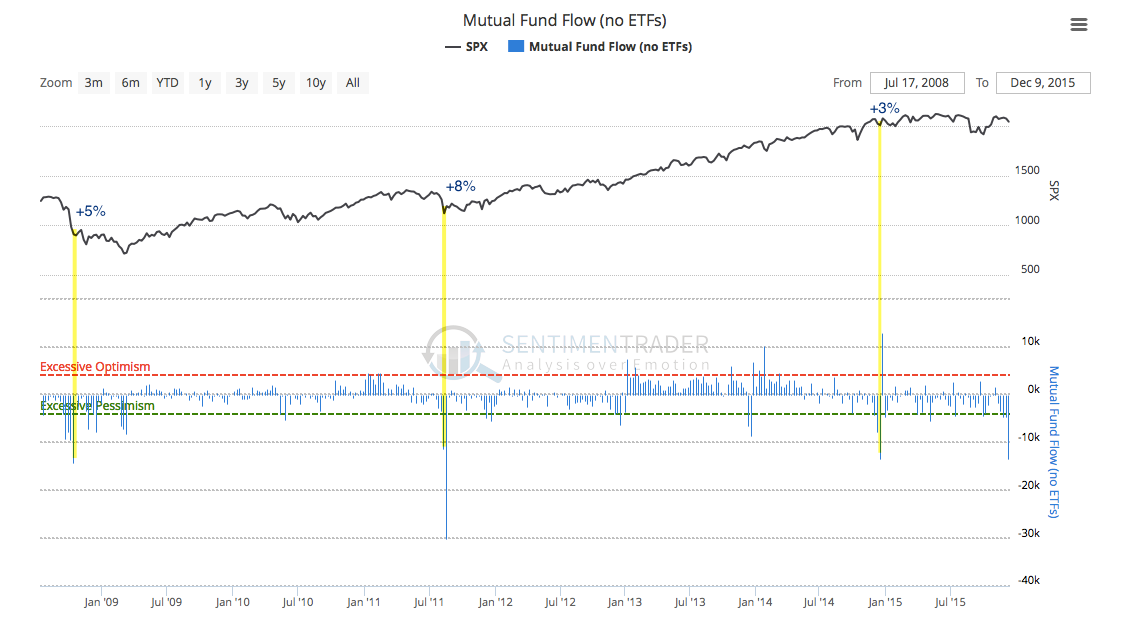
Sentiment has turned very sour. Last week, $13.5b was taken out of equity mutual funds, the most in a single week since 2011. There are only 3 other similar instances since 2008 and in each case SPY jumped at least 3% the following week(s). It's true that money can flow out of mutual funds in mid-December, but this was an extreme (data from Lipper and Sentimentrader).
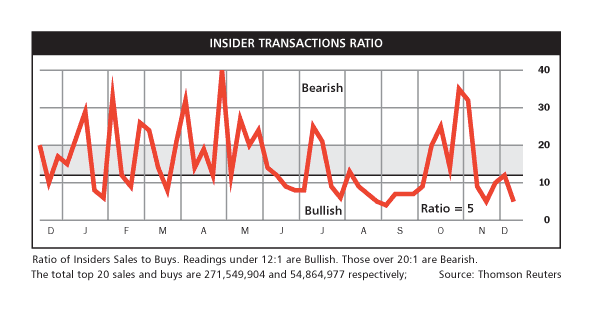
Insiders, who are often but not always right, are as bullish now as they were in mid-November before a 3% rally in SPX (data from Barron's).
In summary, SPY and NDX are near support and breadth is either washed out or close to being so. The spike in volatility was extreme and mean reversion usually follows. Seasonality, especially with December OpEx up next, is very bullish. All things being equal, risk/reward should be strongly skewed higher.
There are two big wild cards this week.
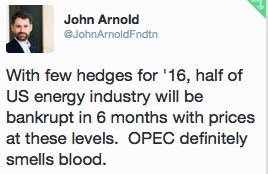
The first, as mentioned earlier, is the drop in oil prices that is weighing on high-yield and, in turn, equities. Lower oil pressures ISIS, which now controls 40% of Iraqi oil and is funding itself by selling oil through Turkey. Lower oil also allows OPEC to force out uncompetitive supply. There are a lot of political and economic crosscurrents and exactly what oil does next is anyone's guess. The price is making lower lows each day; there's no bottom forming. If this continues, expect weakness in equities to persist.
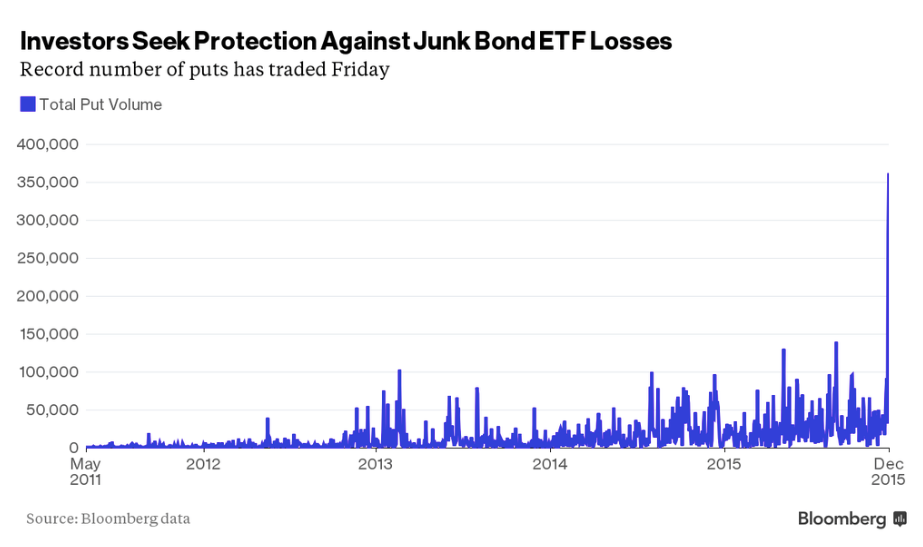
This vicious cycle has created an epic panic in the high-yield market. A record high number of puts traded on Friday. Put spikes in December 2014 and in August and September 2015 marked short-term reversal points in high-yield.
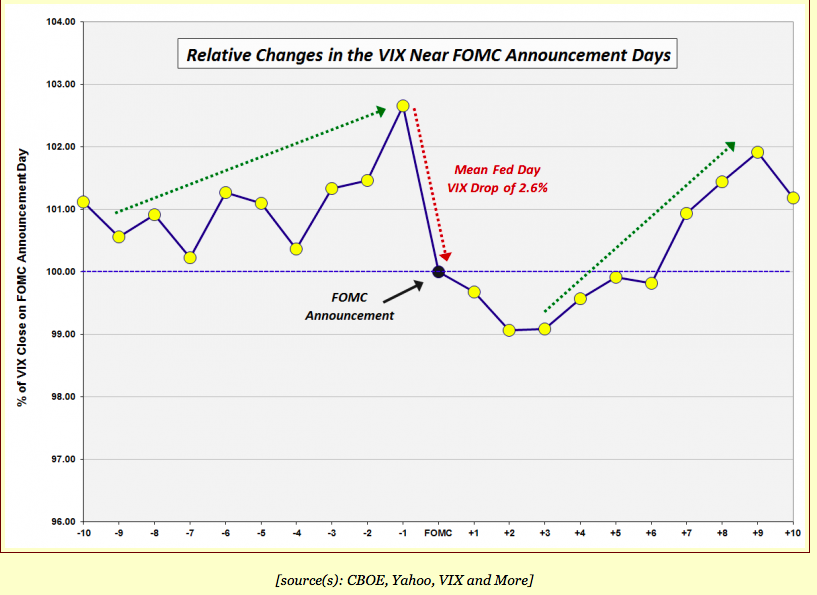
The second, of course, is that the Fed is expected to initiate raising rates this Wednesday. Further volatility before then might reduce the expected rise in rates. This event, given turbulence this week, has become a black box. Of note is that VIX typically rises ahead of the Fed and then falls after; if it does so again now, it will be a positive for equities after mid-week (data from Vix & More).
Our summary table follows:
http://fat-pitch.blogspot.com/2015/12/weekly-market-summary_12.html?spref=tw
• George.
Click on "In reply to", for Authors past commentaries.
Peek Into Future Through Futures
* December 12, 2015
The following are futures positions of non-commercials as of December 8, 2015. Change is week-over-week.
E-mini S&P 500: The index this week fell out of the pennant it had carved out for itself.
Flows continue not to cooperate. For the week ended Wednesday, $8.6 billion was withdrawn from U.S.-based equity funds (courtesy of Lipper). Since September 30th, inflows have only totaled $2.2 billion. In the meantime, in the past three weeks north of $37 billion has move into money-market funds.
Foreigners have been shunning U.S. stocks for a while now. In September, the 12-month running total stood at minus $95 billion. The last time this metric was positive was October 2013.
Data such as these give reason for shorts to hang in there, and they have.
As of the end of November, NYSE short interest is down five percent from the high two months ago which was the second highest ever. Similarly, short interest on the Nasdaq is down six percent from the end-September high but two months ago had risen to the highest since mid-September 2008.
These shorts were rewarded handsomely this week.
Non-commercials continue to cut back net shorts – now sub-100,000 contracts for three weeks; that said, this was before Friday’s carnage.
Support at 1990 is a must-hold.
Currently net short 80.8k, down 15.5k.
Nasdaq 100 index (mini): With the 3.8-percent drop this week, the Nasdaq 100 has now slightly breached 4560 support, which also approximates the 50-day moving average (4572). The 200-day moving average lies at 4461, and likely gets tested.
In the past month, non-commercials have cut back net longs by 34 percent.
Currently net long 54k, down 2.8k.
Russell 2000 mini-index: Along with small-caps, high-yield bonds help investors/traders take a pulse of risk-on/risk-off.
In this respect, high-yield bond ETFs are getting sold off hard. Trading volume has picked up. One wonders if institutional money is taking advantage of the drop in JNK, the SPDR High Yield Bond ETF, and HYG, the iShares High Yield Bond ETF. Or, maybe not.
The bigger question is, is the high-yield malaise just related to energy or spreading to other sectors/industries?
Fitch Ratings predicts that the energy sector’s default rate will surge to 11 percent in 2016, and that the U.S. high-yield default rate will rise to 4.5 percent. Taking out energy and metals/mining, however, the high-yield default rate drops to a manageable 1.5 percent.
The probable root cause? The business cycle is maturing and corporate costs are rising. This is reflected in how small-caps are trading, down a whopping 5.1 percent in the week.
For weeks/months, it has paid to listen to non-commercials, who have doggedly remained bearish, and to sell upside calls on IWM, the iShares Russell 2000 ETF.
Currently net short 32.5k, down 607.
US Dollar Index: After the IMF’s SDR decision last week, China has guided its yuan fix lower. November exports fell 6.8 percent, down for five straight months.
While China may not want to lose control of the situation, further depreciation can risk competitive devaluation by other central banks.
The ECB just last week lowered its discount rate, and extended its existing QE program. Japan is in the midst of its QE.
Amidst all this comes a rather hawkish message from the Fed.
The dollar index, having rallied into this, and overbought both near- and medium-term, has come under pressure. The massive December 3rd sell-off has potential to be an important inflection point.
Currently net long 51k, up 3.7k.

VIX: Having surged 9.58 points for the week, spot VIX took care of multiple resistance levels – 50- and 200-day moving averages as well horizontal resistance at 16 and 21-22.
It is beginning to look overbought on a daily basis, but the thing to watch for is a spike-reversal, in which it spikes but only to reverse hard. That is the time to go long equities.
As well, the VIX to VXV ratio spiked to unity on Friday. Several times in the past, the ratio has peaked around this level, which tends to help stocks. That said, it is yet to peak and head lower.
Currently net short 10.2k, down 11.6k.
Hedgopia Risk Reward Index
http://www.hedgopia.com/cot-peek-into-future-through-futures-21/
• George.
Click on "In reply to", for Authors past commentaries.
The Nine MAJOR SECTORS - Daily Charts, defined by Standard and Poors
* December 11, 2015
• George.
Daily Charts = SPY, $INDU, QQQ, IWM
* December 11, 2015
http://stockcharts.com/public/1107832/chartbook/308233753;
http://stockcharts.com/public/1107832/chartbook/308234274;
http://stockcharts.com/public/1107832/chartbook/308234284;
http://stockcharts.com/public/1107832/chartbook/308234291;
• George.
60 min Charts = $SPX, SPY, DIA, QQQ, IBB,
* November 11, 2015
http://stockcharts.com/public/1107832/chartbook/308233786;
http://stockcharts.com/public/1107832/chartbook/308233773;
http://stockcharts.com/public/1107832/chartbook/308234273;
http://stockcharts.com/public/1107832/chartbook/308234283;
http://stockcharts.com/public/1107832/chartbook/308233772;
• George.
Weekly Charts = SPY, $INDU, $NDX
* November 11, 2015
http://stockcharts.com/public/1107832/chartbook/308233788;
http://stockcharts.com/public/1107832/chartbook/308234275;
http://stockcharts.com/public/1107832/chartbook/405292385;
• George.
Market Update
By Erin Heim
* December 10, 2015
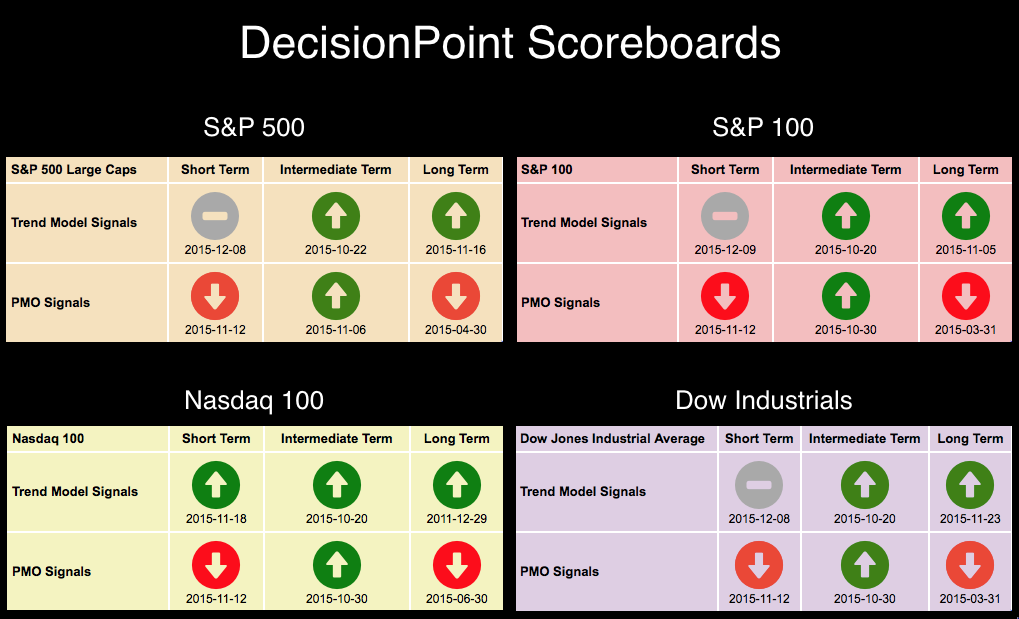
DecisionPoint Alert Daily Blog for 12/10/2015 - "It's Not Time, Santa"
Well, the short-term indicators are with Santa right now (pending Santa Claus Rally), but the price charts really need some more pullback to at least test the November lows. The DP Scoreboards are showing a deterioration in the short-term trend and momentum is negative in the short term as well.
The purpose of the DecisionPoint Alert Daily Update is to quickly review the day's action, internal condition, and Trend Model status of the broad market (S&P 500), the nine SPDR Sectors, the U.S. Dollar, Gold, Crude Oil, and Bonds. To ensure that using this daily reference will be quick and painless, we are as brief as possible, and sometimes we let a chart speak for itself.
STOCKS: Based upon a 10/21/2015 Intermediate-Term Trend Model BUY signal, our current intermediate-term market posture for the S&P 500 (SPY) is bullish. The Long-Term Trend Model, which informs our long-term outlook, is on a BUY signal as of 11/3/2015 so our long-term posture is bullish.
As it happens often on the 10-minute bar chart, the reverse flag formation never executed. Instead price traded in the black nearly all day. Bulls did lose two battles to get price to close on the intraday highs and now you could make a case for a very short-term double-top. The minimum downside target would put price on yesterday's lows which is quite reasonable.
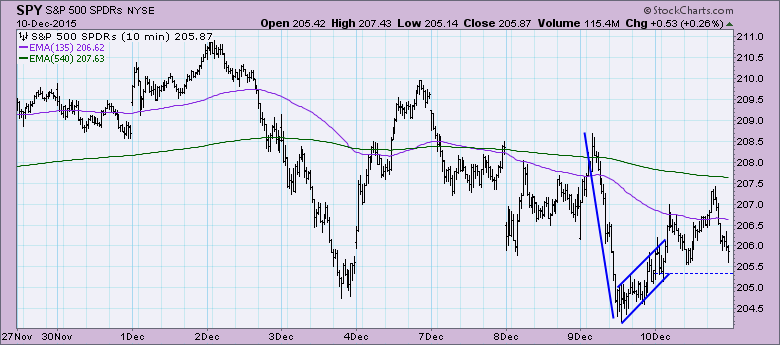
Intraday highs are continuing to form a steep declining tops line despite today's positive close. The PMO showed no signs of deceleration and volume was significantly lower on an 'up' day. Both suggest more decline.
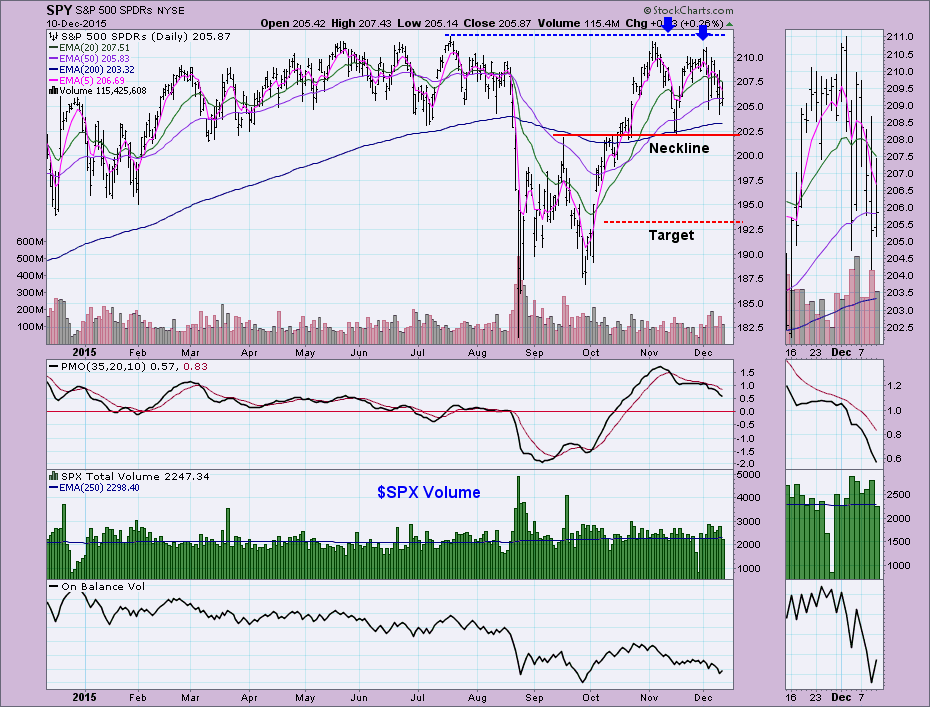
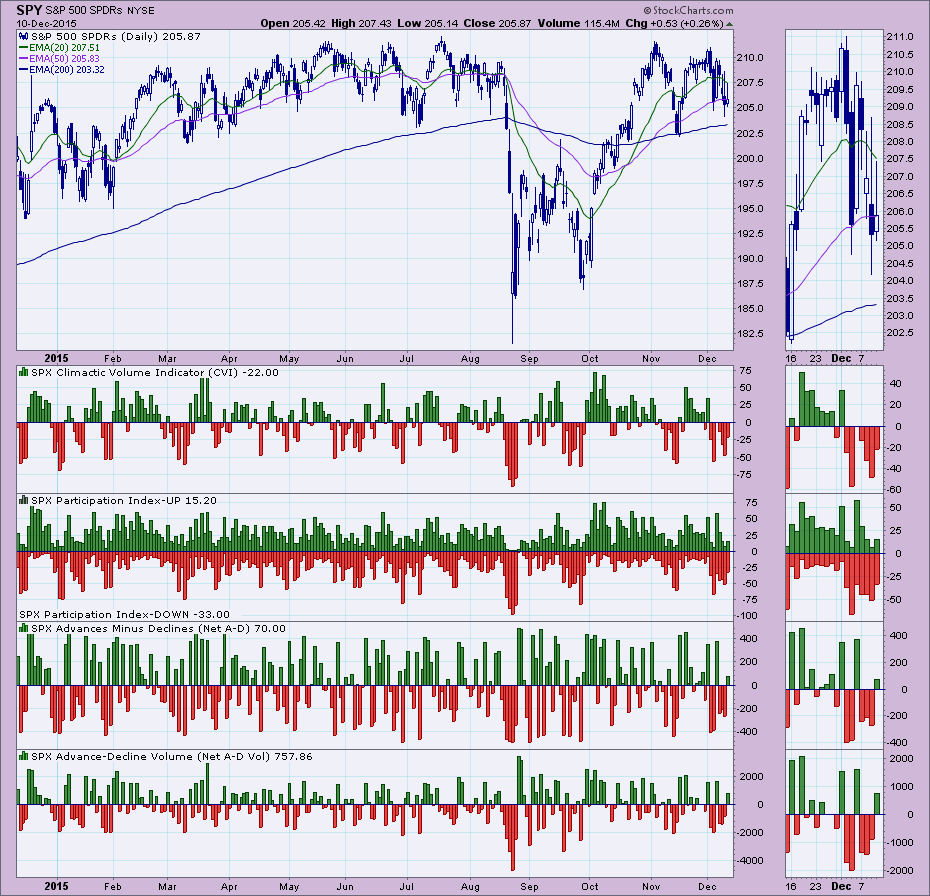
Ultra-Short-Term Indicators: Yesterday's negative spikes concerned me as they arrived during a pullback which would suggest a selling exhaustion. Today's positive close could suggest higher prices, however, notice that while the Net A-Ds had positive readings, the CVI had a negative reading and Participation Index - DOWN was much greater than the Participation Index - UP. This seems a weak bounce.
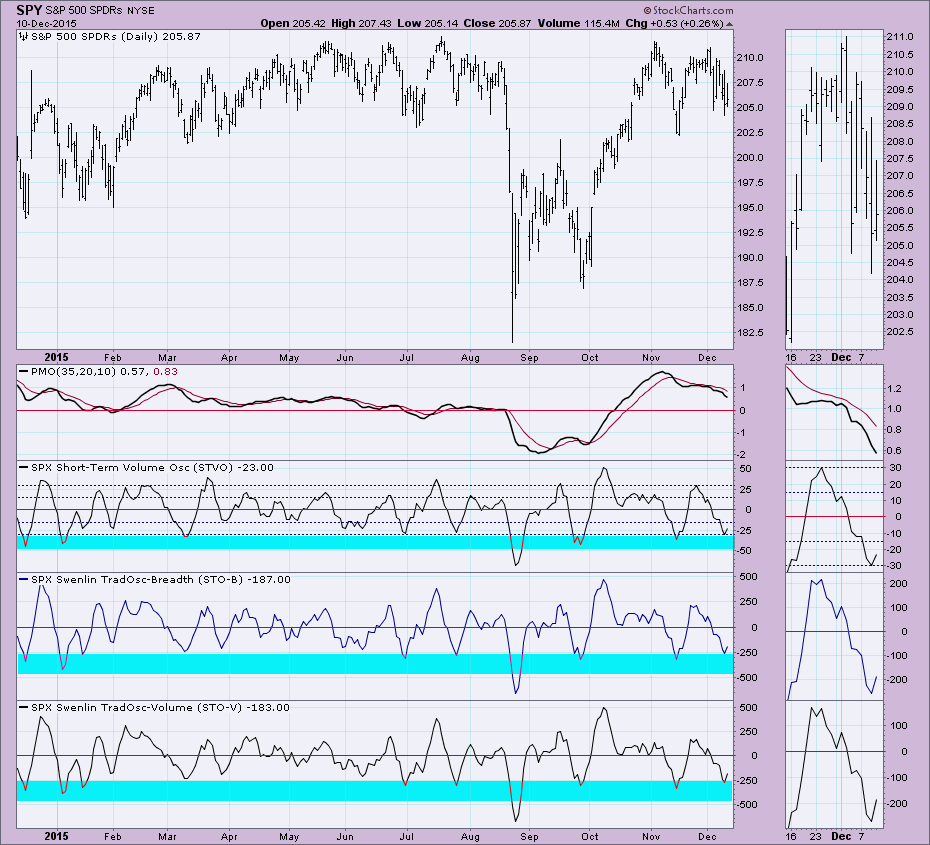
Short-Term Indicators: They all turned up in oversold territory which is very bullish for the short term. However, hold on to your reindeer, Santa. The readings were "ticks" up which can be quickly defeated by a solid price decline. I do believe it is still bullish, but I still expect more decline before a comeback rally.
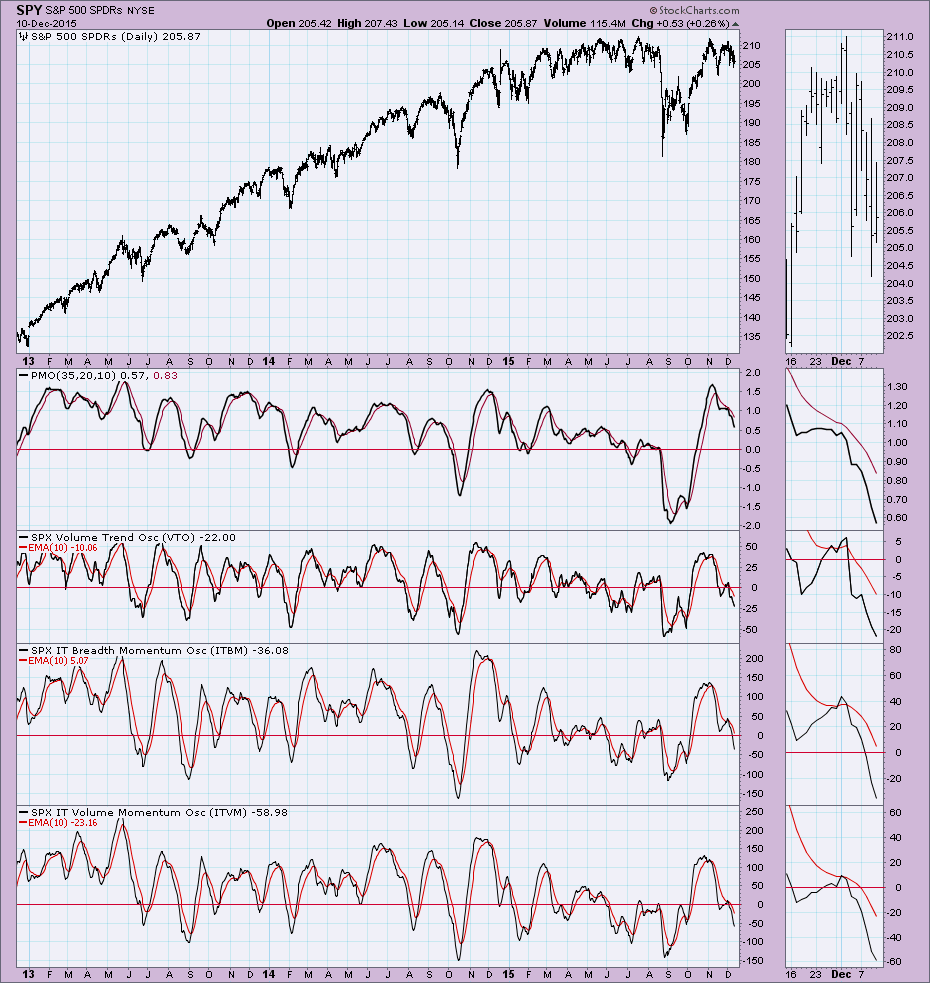
Intermediate-Term Indicators: How substantial would a short-term rally be? I suspect it would be more of a bounce with a return to lower prices. The intermediate-term indicators are very bearish, so Santa may bring a rally, but I would expect once he's back at the North Pole, prices will begin a longer-term price decline.
Conclusion: Santa, I know we are all looking forward to your return this year, but I think your rally would be much more effective if you let price decline at least to the November lows. The short-term indicators are definitely on your side, but ultimately once you leave the bulls their present, the bears can look forward to getting their present...a Bearish New Year.
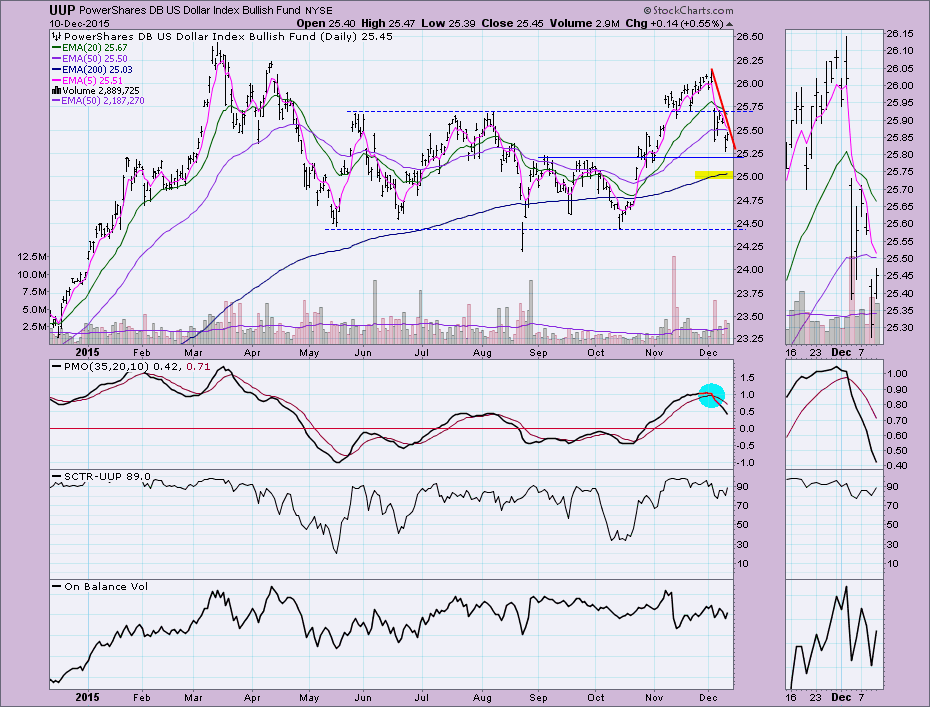
DOLLAR: As of 10/29/2015 the US Dollar Index ETF (UUP) is on an Intermediate-Term Trend Model BUY signal. The Long-Term Trend Model, which informs our long-term outlook, is on a BUY signal as of 8/21/2014, so our long-term posture is bullish.
The Dollar was up today, but it didn't improve the price pattern. The declining tops line is nearly vertical but price did successfully hold support at the September high. The very negative momentum as shown by the quickly declining PMO suggests to me that area of support will not hold. The next possible stop might be at the 200-EMA.
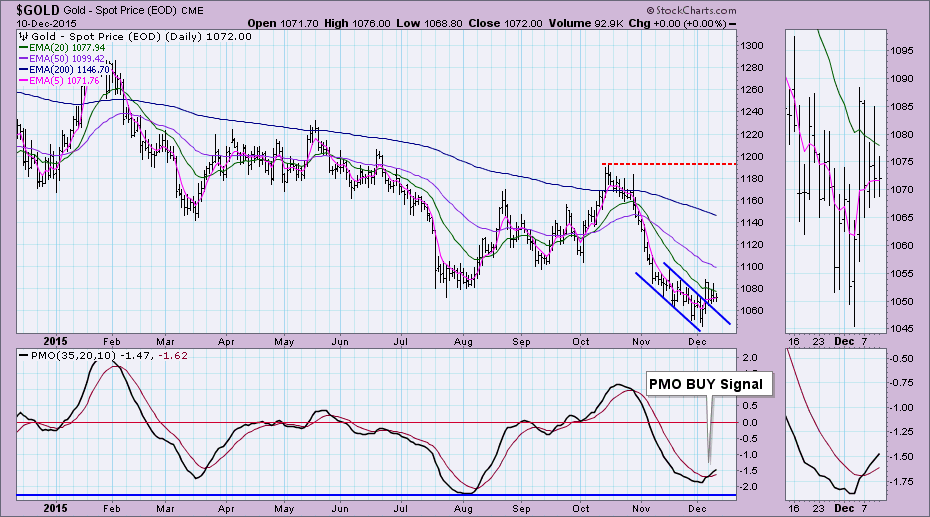
GOLD: As of 11/6/2015 Gold is on an Intermediate-Term Trend Model SELL signal. The Long-Term Trend Model, which informs our long-term outlook, is on a SELL signal as of 2/15/2013, so our long-term posture is bearish.
Gold is holding its own. While there was no change in price on Gold today, the Dollar was up over a half percent which would normally put pressure on Gold prices so the fact it didn't close lower is actually a positive. The PMO is configured very bullishly. Of concern would be the flattening 5-EMA. It was headed for a positive crossover the 20-EMA and now it has halted.
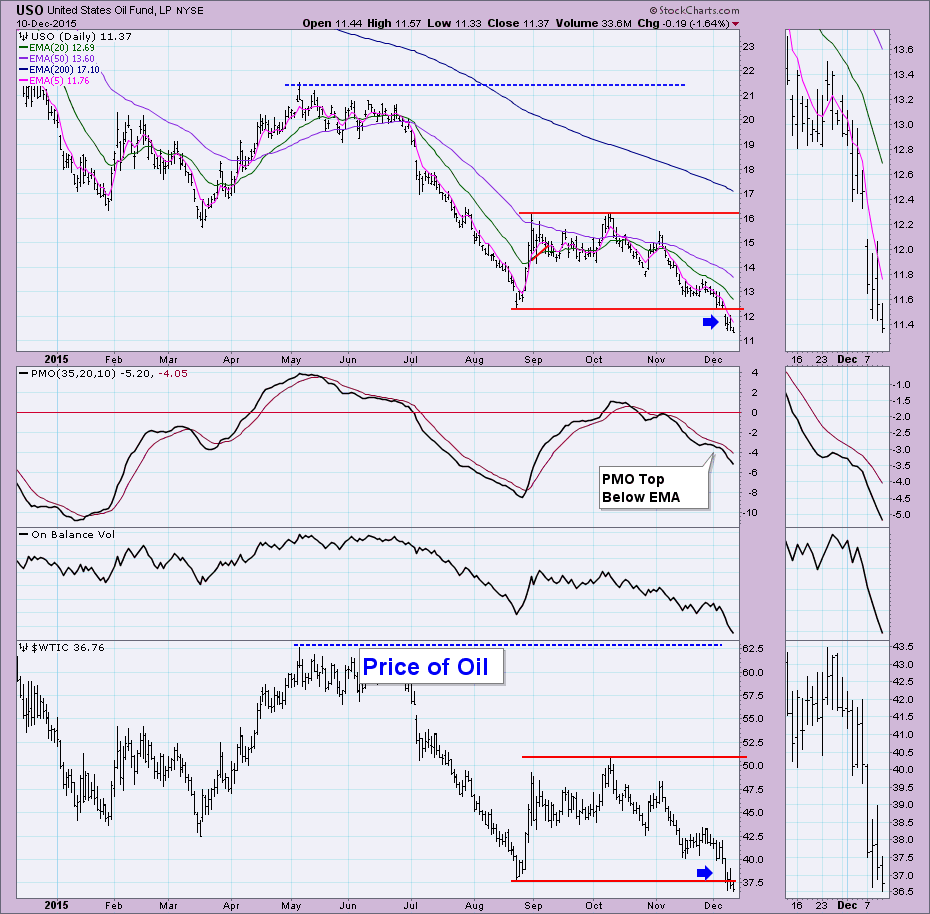
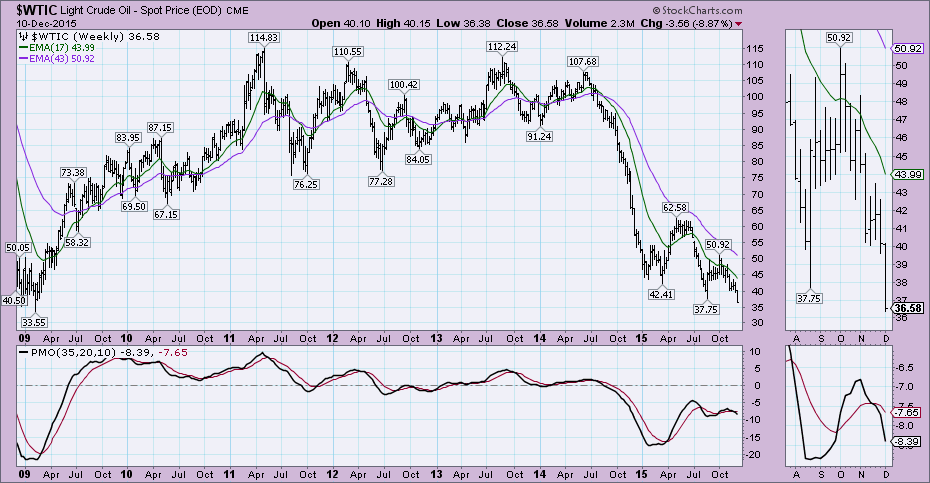
CRUDE OIL (USO): As of 7/6/2015 United States Oil Fund (USO) is on an Intermediate-Term Trend Model SELL signal. The Long-Term Trend Model, which informs our long-term outlook, is on a SELL signal as of 8/28/2014, so our long-term posture is bearish.
Could it get any worse for USO? Probably. Today the price of Oil closed and traded below the August low. If this breakdown continues, you have to look at the weekly chart to find the next area of support. which is $33.55/barrel. USO is along for the ride, logging new all-time lows as it travels alongside.
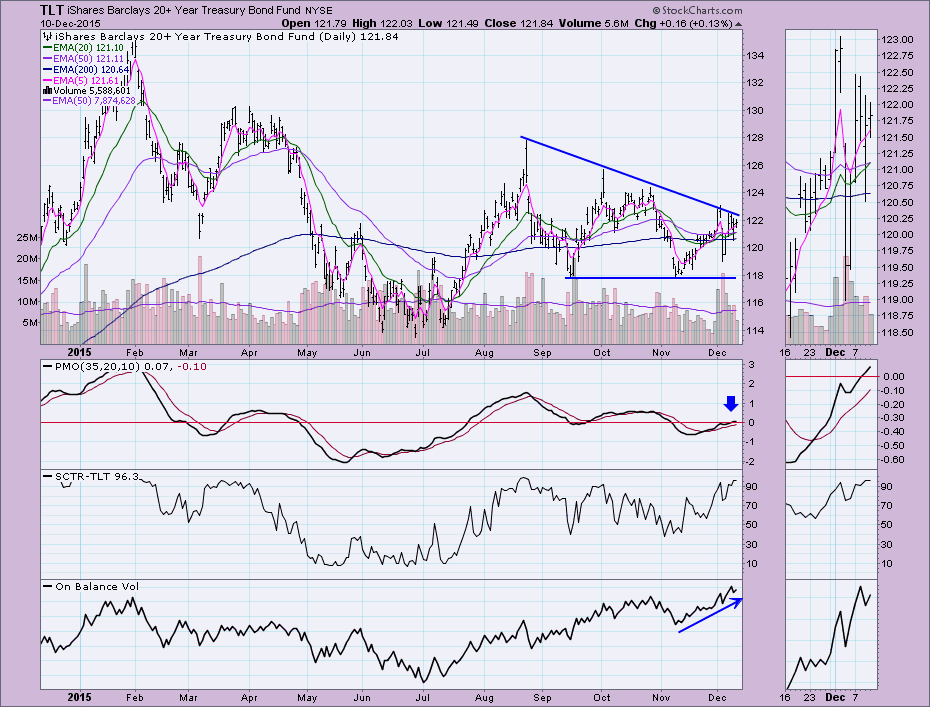
BONDS (TLT): As of 11/9/2015 The 20+ Year T-Bonds ETF (TLT) is on an Intermediate-Term Trend Model Neutral signal. The Long-Term Trend Model, which informs our long-term outlook, is on a BUY signal as of 8/14/2015, so our long-term posture is bullish.
Indicators for Bonds are very bullish, but the price pattern is not. I believe in my indicators over the bearish descending triangle pattern. We need to see a breakout above the declining tops line to confirm what the indicators are hinting at.
Technical Analysis is a windsock, not a crystal ball.
Happy Charting!
- Erin
http://stockcharts.com/articles/decisionpoint/2015/12/my-early-holiday-gift-to-you.html
• George.
Click on "In reply to", for Authors past commentaries.
Breadth Indicators - Charts
* December 10, 2015
>> Dow Jones Industrial Average vs % of DJIA Stocks Above 5-Day Moving Average Chart
http://www.indexindicators.com/charts/djia-vs-djia-stocks-above-5d-sma-params-x-x-x-x/
>> S&P 500 vs % of S&P 500 Stocks Above 5-Day Moving Average Chart
http://www.indexindicators.com/charts/sp500-vs-sp500-stocks-above-5d-sma-params-x-x-x-x/
>> Nasdaq 100 vs % Nasdaq 100 Stocks Above 5-Day Moving Average Chart
http://www.indexindicators.com/charts/nasdaq100-vs-nasdaq100-stocks-above-5d-sma-params-x-x-x-x/
• George.
|
Followers
|
38
|
Posters
|
|
|
Posts (Today)
|
0
|
Posts (Total)
|
2987
|
|
Created
|
11/04/07
|
Type
|
Free
|
| Moderators | |||
* SSO - ProShares Ultra S&P500 (the Fund), formerly Ultra S&P500 ProShares, seeks daily investment results that correspond to twice
the daily performance of the S&P 500 Index.
* UPRO - ProShares UltraPro S&P500 (the Fund), seeks daily investment results that correspond to three times the daily performance of the S&P 500 Index.
* The S&P 500 Index is a measure of large-cap United States stock market performance. It is a capitalization weighted index of 500
United States operating companies and real estate investment trusts (REITs) selected by an S&P committee through a non-
mechanical process that factors criteria, such as liquidity, price, market capitalization, financial viability and public float.
Reconstitution occurs both on a quarterly and on an ongoing basis.
* The Funds take positions in securities and/or financial instruments that, in combination, should have similar daily return
characteristics as 200% for the SSO and 300% for the UPRO of the daily return of the SPDR (SPY) Index. The Fund’s investment
advisor is ProShare Advisors LLC.
http://finviz.com/quote.ashx?t=sso
| SPY [NYSE] SSO [NYSE] UPRO [NYSE] |
| SPDR S&P 500 ETF |
| Financial - Exchange Traded Fund - USA |
All information posted on this board is not meant to suggest any specific action, but to point out the technical signs that can help our readers make their own specific decisions. Your Due Diligence is a must!
| Volume | |
| Day Range: | |
| Bid Price | |
| Ask Price | |
| Last Trade Time: |


