Register for free to join our community of investors and share your ideas. You will also get access to streaming quotes, interactive charts, trades, portfolio, live options flow and more tools.
Estimated Value of ETF Net Issuance Flows
* July 19, 2016
Washington, DC, July 19, 2016 - The estimated value of all exchange-traded fund1 (ETF) shares issued exceeded that of shares redeemed by $22.63 billion for the week ended July 13, 2016, the Investment Company Institute reported today.
Equity ETFs2 had estimated net issuance of $17.49 billion for the week, compared to estimated net issuance of $3.41 billion in the previous week. Domestic equity ETFs had estimated net issuance of $16.06 billion, and world equity ETFs had estimated net issuance of $1.44 billion.
Hybrid ETFs2—which can invest in stocks and fixed-income securities—had estimated net issuance of $28 million for the week, compared to estimated negative net issuance of $16 million in the previous week.
Bond ETFs2 had estimated net issuance of $5.38 billion for the week, compared to estimated net issuance of $6.08 billion during the previous week. Taxable bond ETFs saw estimated net issuance of $5.23 billion, and municipal bond ETFs had estimated net issuance of $145 million.
Commodity ETFs2—which are ETFs (both registered and not registered under the Investment Company Act of 1940) that invest primarily in commodities, currencies, and futures—had estimated negative net issuance of $268 million for the week, compared to estimated net issuance of $2.16 billion during the previous week.
https://www.ici.org/research/stats/flows/etf/etf_flows_07_19_16
• DiscoverGold.
Estimated Value of ETF Net Issuance Flows
* July 12, 2016
Washington, DC, July 12, 2016 - The estimated value of all exchange-traded fund1 (ETF) shares issued exceeded that of shares redeemed by $11.63 billion for the week ended July 6, 2016, the Investment Company Institute reported today.
Equity ETFs2 had estimated net issuance of $3.41 billion for the week, compared to estimated negative net issuance of $4.84 billion in the previous week. Domestic equity ETFs had estimated net issuance of $5.47 billion, and world equity ETFs had estimated negative net issuance of $2.06 billion.
Hybrid ETFs2—which can invest in stocks and fixed-income securities—had estimated negative net issuance of $16 million for the week, compared to estimated net issuance of $97 million in the previous week.
Bond ETFs2 had estimated net issuance of $6.08 billion for the week, compared to estimated net issuance of $2.33 billion during the previous week. Taxable bond ETFs saw estimated net issuance of $5.83 billion, and municipal bond ETFs had estimated net issuance of $252 million.
Commodity ETFs2—which are ETFs (both registered and not registered under the Investment Company Act of 1940) that invest primarily in commodities, currencies, and futures—had estimated net issuance of $2.16 billion for the week, compared to estimated net issuance of $2.10 billion during the previous week.
https://www.ici.org/research/stats/flows/etf/etf_flows_07_12_16
• DiscoverGold.
ETF Trends: Hedge
* July 12, 2016
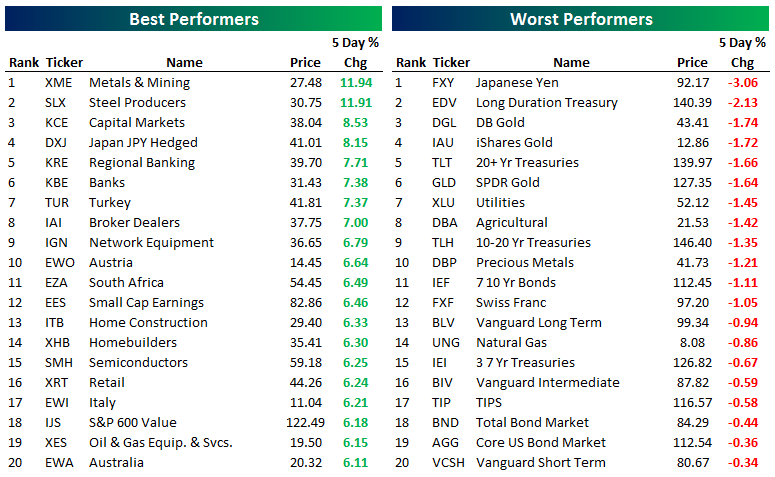
Below is our daily list of the twenty best and twenty worst performing ETFs over the last five trading days. In a reversal of fate, a number of gold exposures switched from being among the top performers to being among the worst performers. Metals & Mining, as well as Steel Producers were the top two performing ETFs. Financial exposures performed strongly, and retail and homebuilding stocks continued to gain momentum. Long term treasuries and bonds performed poorly, and the Japanese yen saw the biggest drop over the last five days for the ETF universe we track.
https://www.bespokepremium.com/etf-trends/etf-trends-hedge-71216/
• DiscoverGold.
Stocks With the Largest Short Interest
* Friday, July 08, 2016
> nyse
http://bigcharts.marketwatch.com/reports/bigmovers.asp?data=1&start=1&report=10&report_country_code=US&date=20160708
• DiscoverGold.
Click on "In reply to", to see reports from prior weeks.
Key ETFs traded on US exchanges
* July 8, 2016
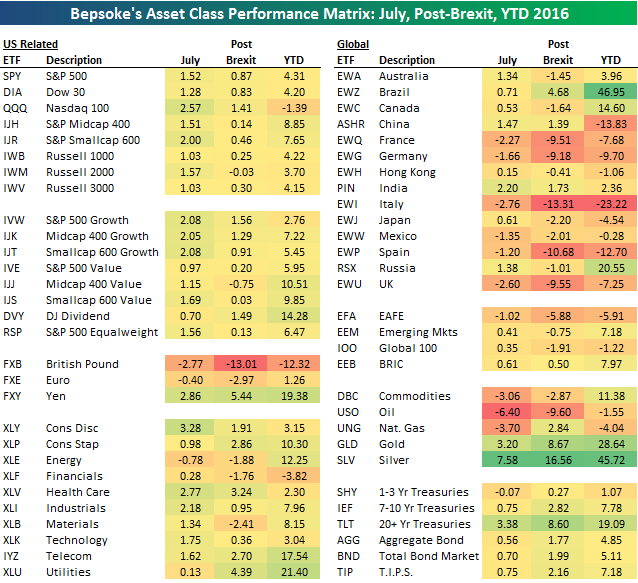
Below is an updated look at our asset class performance matrix using key ETFs traded on US exchanges. For each ETF, we highlight its percentage change so far in the month of July, its change since the close prior to the Brexit vote on June 23rd, and its year-to-date change. Silver is certainly shining in 2016!
https://www.bespokepremium.com/bespoke-report/the-bespoke-report-7816/
• DiscoverGold.
ETFs Sector Performance Friday 6/10
* June 12, 2016
>> Best Performing Technolgy ETFs Today
http://www.dogsofthedow.com/best-performing-technology-etfs-today.htm
>> Best Performing Healthcare ETFs Today
http://www.dogsofthedow.com/best-performing-healthcare-etfs-today.htm
>> Best Performing Energy ETFs Today
http://www.dogsofthedow.com/best-performing-energy-etfs-today.htm
>> Best Performing Financial ETFs Today
http://www.dogsofthedow.com/best-performing-financial-etfs-today.htm
>> Best Performing Real Estate ETFs Today
http://www.dogsofthedow.com/best-performing-real-estate-etfs-today.htm
>> Best Performing Commodity ETFs Today
http://www.dogsofthedow.com/best-performing-commodity-etfs-today.htm
• DiscoverGold.
Upgrades/Downgrades
* Updated: Jun 10, 2016 07:55 a.m. ET

Equity ratings changes direct from brokerage firms.
http://online.wsj.com/mdc/public/page/2_3024-UpgradesDowngrades.html?mod=topnav_2_3022
• DiscoverGold.
ETF Trends: Fixed Income, Currencies, and Commodities
* June 8, 2016
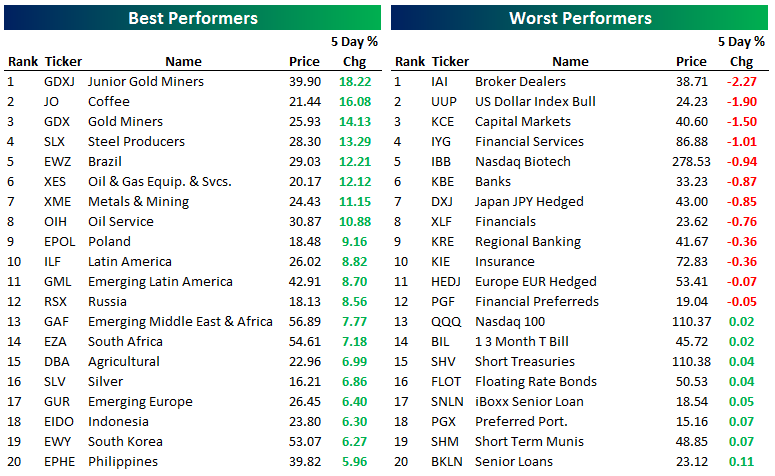
Volatile gold stocks have jumped the entire spectrum from some of the worst performers to some of the best in a few short days. Coffee and other commodity exposures have also ripped while banks lead the list of losers along with the USD and preferred shares.
https://www.bespokepremium.com/etf-trends/etf-trends-fixed-income-currencies-and-commodities-6816/
• DiscoverGold.
Estimated Weekly Value of ETF Net Issuance Flows
* June 8, 2016
Washington, DC, June 7, 2016 - The estimated value of all exchange-traded fund1 (ETF) shares issued exceeded that of shares redeemed by $6.13 billion for the week ended June 1, 2016, the Investment Company Institute reported today.
Equity ETFs2 had estimated net issuance of $5.84 billion for the week, compared to estimated net issuance of $3.15 billion in the previous week. Domestic equity ETFs had estimated net issuance of $5.30 billion, and world equity ETFs had estimated net issuance of $540 million.
Hybrid ETFs2—which can invest in stocks and fixed-income securities—had estimated net issuance of $3 million for the week, compared to estimated negative net issuance of $3 million in the previous week.
Bond ETFs2 had estimated net issuance of $313 million for the week, compared to estimated net issuance of $575 million during the previous week. Taxable bond ETFs saw estimated net issuance of $176 million, and municipal bond ETFs had estimated net issuance of $136 million.
Commodity ETFs2—which are ETFs (both registered and not registered under the Investment Company Act of 1940) that invest primarily in commodities, currencies, and futures—had estimated negative net issuance of $23 million for the week, compared to estimated net issuance of $649 million during the previous week.
https://www.ici.org/research/stats/flows/etf/etf_flows_06_07_16
• DiscoverGold.
Apple Inc. (AAPL) - Daily & 60 min Charts
* June 8, 2016
http://stockcharts.com/public/1107832/chartbook/308233758;
http://stockcharts.com/public/1107832/chartbook/308233778;
• DiscoverGold.
Apple (AAPL) - has 3.4 component's weighting in the S&P 500, Microsoft (MSFT) - has 2.4. The top stocks with highest impact on the S&P 500 trend would be:
Apple Inc. (AAPL) - 3.454514
Microsoft Corporation (MSFT) - 2.476262
Exxon Mobil Corporation (XOM) - 1.806482
General Electric Company (GE) - 1.599475
Johnson & Johnson (JNJ) - 1.595228
Wells Fargo & Company (WFC) - 1.440735
Amazon.com Inc. (AMZN) - 1.429393
Berkshire Hathaway Inc. Class B (BRK.B) - 1.395743
JPMorgan Chase & Co. (JPM) - 1.363343
Facebook Inc. (FB) - 1.333700
Alphabet Inc. (GOOG) - 1.240467
However, when you take a look at the performance of these companies, they yield greatly to the much smaller companies. See below top 10 S&P 500 performance over the past 6 months:
CONSOLIDATED ENERGY (CNX) - 99.48 %
NRG ENERGY (NRG) - 98.33 %
SOUTHWESTERN ENERGY (SWN) - 96.12 %
ONEOK (OKE) - 85.20 %
JOY GLOBAL (JOY) - 74.69 %
NEWMONT MINING (NEM) - 70.58 %
COMPUTER SCIENCES (CSC) - 69.30 %
RANGE RESOURCES (RRC) - 66.71 %
WYNN RESORTS (WYNN) - 56.80 %
CABOT OIL & GAS (COG) - 48.34 %
The best performed S&P 500 stocks in 2016 with the strongest YTD performance would be
SOUTHWESTERN ENERGY (SWN) - 113.36 %
CONSOLIDATED ENERGY (CNX) - 94.30 %
NEWMONT MINING (NEM) - 93.94 %
RANGE RESOURCES (RRC) - 87.73 %
ONEOK (OKE) - 86.24 %
JOY GLOBAL (JOY) - 77.38 %
FREEPORT-MCMORAN (FCX) - 65.98 %
COMPUTER SCIENCES (CSC) - 58.69 %
NRG ENERGY (NRG) - 51.70 %
WYNN RESORTS (WYNN) - 46.15 %
The best companies over the past month on the S&P 500 would be
COMPUTER SCIENCES (CSC) - 54.26 %
WESTERN DIGITAL (WDC) - 33.51 %
NVIDIA (NVDA) - 31.25 %
MICRON TECH (MU) - 30.63 %
SEAGATE TECH (STX) - 29.31 %
SOUTHWESTERN ENERGY (SWN) - 28.50 %
ALLERGAN (AGN) - 23.90 %
DEVON ENERGY (DVN) - 23.79 %
APPLIED MATERIALS (AMAT) - 21.64 %
MARATHON OIL (MRO) - 1.45 %
And past week best performers on the S&P 500 were
JOY GLOBAL (JOY) - 34.89 %
MICHAEL KORS HOLDINGS (KORS) - 21.46 %
TRANSOCEAN (RIG) - 16.46 %
SOUTHWESTERN ENERGY (SWN) - 15.85 %
CF INDUSTRIES HOLDINGS (CF) - 15.05 %
ENDO PHARMACEUTICALS HOLDINGS (ENDP) - 14.95 %
CHESAPEAKE ENERGY (CHK) - 14.42 %
SEAGATE TECH (STX) - 13.99 %
MOSAIC (MOS) - 13.43 %
ENSCO (ESV) - 12.96 %
Source:
http://www.marketvolume.com/stocks/winnerslosers.asp
The one may ask what it (the lists above) - may give us? Despite heavy bragging in the media, we do not see the market giants like AMZN, AAPL, GOOG, MSFT in the list of the best performed stocks. Instead we have second level of the S&P 500 companies moving up strongly. Maybe the "market giants" exhausted their potential for a while and there are not a lot of room them to run up. Maybe it is a time to look into other S&P 500 companies with higher growth potential.
SPY: Still Wary of the Advance
By Carl Swenlin
* June 5, 2016
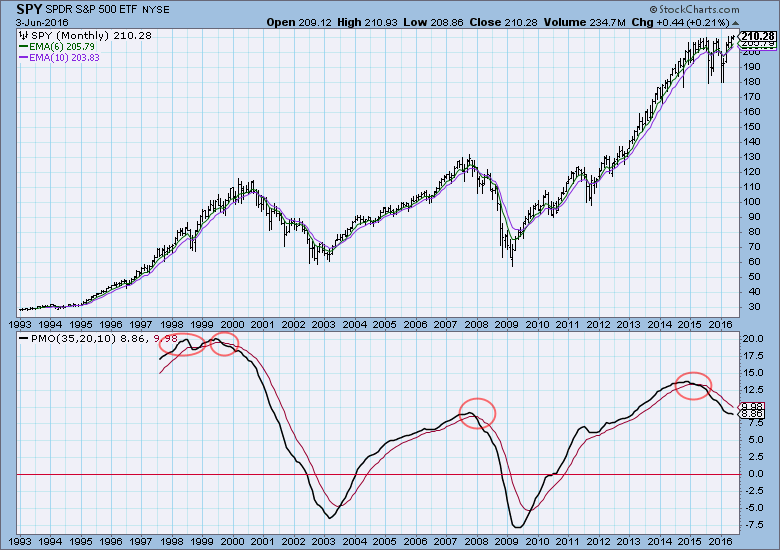
While our timing models remain bullish, and the market continues to make marginal new highs, I have been looking for a bull market top since the monthly PMO topped in late 2014 and then crossed down through its signal line in early-2015. Well, that price top has not yet materialized, but the market has not really gone anywhere either. There have been a series of price tops for about a year-and-a-half, but at the worst, only corrections have resulted, and a trading range established.
Moving to the daily chart, note that an ITTM BUY signal was generated when the 20EMA crossed up through the 50EMA. We can see the internal deterioration that preceded the April price top (negatively diverging STVO and VTO), but that only resulted in a small pullback. Now, as price is once more pushing at the top of the trading range, we again see some internal weakness: (1) the CVI has faded as price pushed higher; (2) the STVO has topped in overbought territory; and (3) the VTO in topping and has failed to confirm the recent price highs.
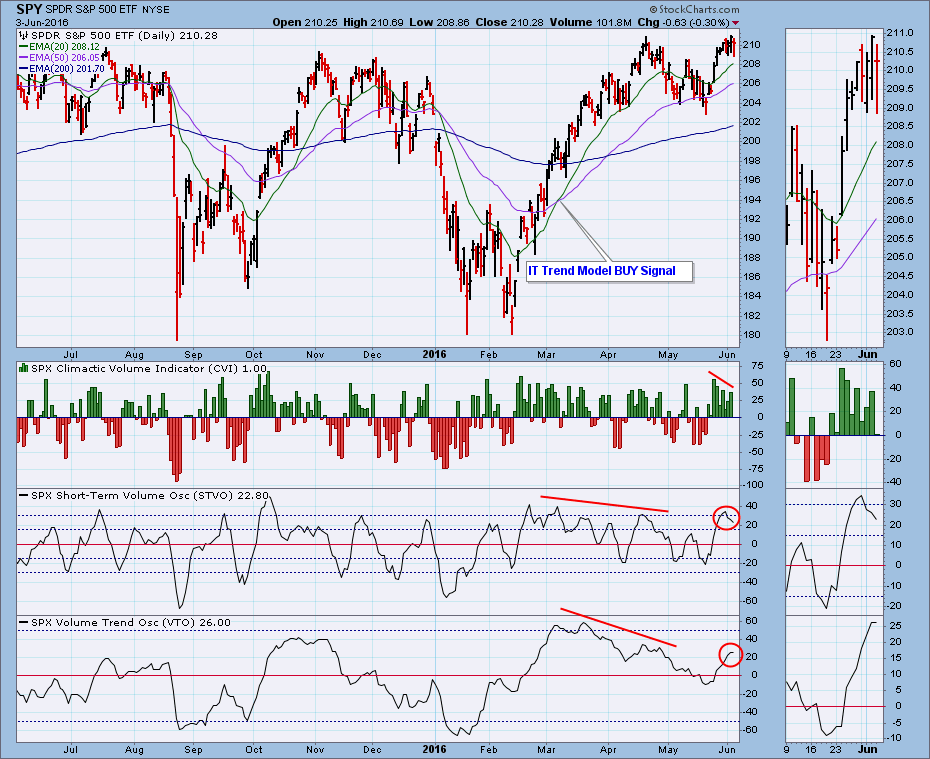
CONCLUSION: We are on an ITTM BUY signal, but I am once again looking for a correction. I know that this conflict between the mechanical signal and my analysis of the technicals can be confusing, but remember that the Trend Model is an ON/OFF switch and does not incorporate the nuance of other technical indicators. The Trend Model tells us we should be long the market, but the indicators suggest that that position may be vulnerable.
Technical analysis is a windsock, not a crystal ball.
http://stockcharts.com/articles/decisionpoint/2016/06/spy-still-wary-of-the-advance.html
• DiscoverGold.
Click on "In reply to", for Authors past commentaries.
Estimated Weekly Value of ETF Net Issuance Flows
* May 31, 2016
Washington, DC, May 31, 2016—The estimated value of all exchange-traded fund1 (ETF) shares issued exceeded that of shares redeemed by $4.37 billion for the week ended May 25, 2016, the Investment Company Institute reported today. In addition to this report, ICI will also be publishing long-term mutual fund flows and a report that combines data for ETFs and mutual funds, available on the ICI website.
Equity ETFs2 had estimated net issuance of $3.15 billion for the week, compared to estimated negative net issuance of $2.03 billion in the previous week. Domestic equity ETFs had estimated net issuance of $4.30 billion, and world equity ETFs had estimated negative net issuance of $1.15 billion.
Hybrid ETFs2—which can invest in stocks and fixed-income securities—had estimated negative net issuance of $3 million for the week, compared to estimated negative net issuance of $83 million in the previous week.
Bond ETFs2 had estimated net issuance of $575 million for the week, compared to estimated net issuance of $3.52 billion during the previous week. Taxable bond ETFs saw estimated net issuance of $455 million, and municipal bond ETFs had estimated net issuance of $120 million.
Commodity ETFs2—which are ETFs (both registered and not registered under the Investment Company Act of 1940) that invest primarily in commodities, currencies, and futures—had estimated net issuance of $649 million for the week, compared to estimated net issuance of $595 million during the previous week.
https://www.ici.org/research/stats/flows/etf/etf_flows_05_31_16
• DiscoverGold.
ETF Performance Screens
* May 30, 2016
>> Best Performing ETFs Today
http://www.dogsofthedow.com/best-performing-etfs-today.htm
>> Best Performing ETFs: 12 Months
http://www.dogsofthedow.com/best-performing-etfs-12-months.htm
>> Highest Dividend Paying ETFs Today
http://www.dogsofthedow.com/highest-dividend-paying-etfs.htm
• DiscoverGold.
Stocks With the Largest Short Interest
* Friday, May 27, 2016
> nyse
http://bigcharts.marketwatch.com/reports/bigmovers.asp?data=1&start=1&report=10&report_country_code=US&date=20160527
• DiscoverGold.
Click on "In reply to", to see reports from prior weeks.
ETF Trends: Fixed Income, Currencies, and Commodities – 5/25/16
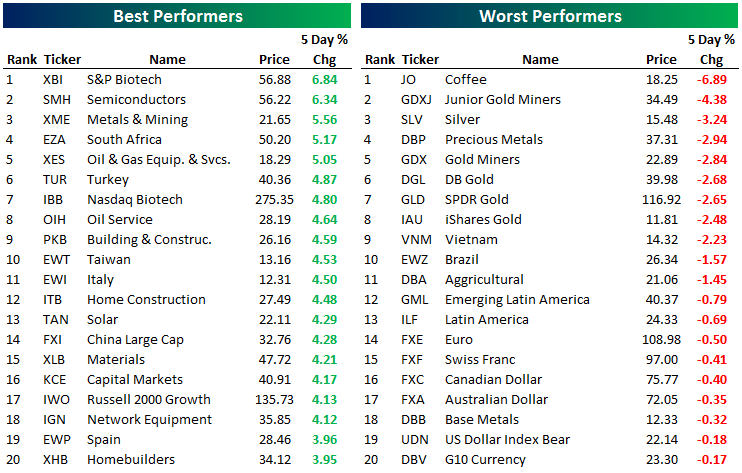
EM has staged something of a turnaround in the last couple of days with South Africa and Turkey two prominent members of the best performing ETFs list below. Italy has also done well as a deal to secure the near future of Greece’s bailout was hammered out yesterday. Homebuilders continue to rally after a strong New Home Sales print yesterday and a solid MBA mortgage applications release this morning. Precious metals are the worst performers over the last week with numerous gold funds at the top of the list. The bouncing USD has hurt that trade with a number of currency ETFs also declining on the move.
https://www.bespokepremium.com/etf-trends/etf-trends-fixed-income-currencies-and-commodities-52516/
• DiscoverGold.
Estimated Weekly Value of ETF Net Issuance Flows
* May 24, 2016
Washington, DC, May 24, 2016—The estimated value of all exchange-traded fund1 (ETF) shares issued exceeded that of shares redeemed by $2.01 billion for the week ended May 18, 2016, the Investment Company Institute reported today.
Equity ETFs2 had estimated negative net issuance of $2.03 billion for the week, compared to estimated negative net issuance of $2.98 billion in the previous week. Domestic equity ETFs had estimated negative net issuance of $666 million, and world equity ETFs had estimated negative net issuance of $1.36 billion.
Hybrid ETFs2—which can invest in stocks and fixed-income securities—had estimated negative net issuance of $83 million for the week, compared to estimated negative net issuance of $7 million in the previous week.
Bond ETFs2 had estimated net issuance of $3.52 billion for the week, compared to estimated negative net issuance of $465 million during the previous week. Taxable bond ETFs saw estimated net issuance of $3.31 billion, and municipal bond ETFs had estimated net issuance of $212 million.
Commodity ETFs2—which are ETFs (both registered and not registered under the Investment Company Act of 1940) that invest primarily in commodities, currencies, and futures—had estimated net issuance of $595 million for the week, compared to estimated net issuance of $1.06 billion during the previous week.
https://www.ici.org/research/stats/flows/etf/etf_flows_05_24_16
• DiscoverGold.
ETFs Sector Performance Friday 20
* May 22, 2016
>> Best Performing Technolgy ETFs Today
http://www.dogsofthedow.com/best-performing-technology-etfs-today.htm
>> Best Performing Healthcare ETFs Today
http://www.dogsofthedow.com/best-performing-healthcare-etfs-today.htm
>> Best Performing Energy ETFs Today
http://www.dogsofthedow.com/best-performing-energy-etfs-today.htm
>> Best Performing Financial ETFs Today
http://www.dogsofthedow.com/best-performing-financial-etfs-today.htm
>> Best Performing Real Estate ETFs Today
http://www.dogsofthedow.com/best-performing-real-estate-etfs-today.htm
>> Best Performing Commodity ETFs Today
http://www.dogsofthedow.com/best-performing-commodity-etfs-today.htm
• DiscoverGold.
Global Equities Are Hanging By A Thread
* May 20, 2016
The unintended consequences from the continued altering of the capital structure of firms, by issuing debt and retiring equity at a time when operating cash flow growth is showing signs of fatigue is disconcerting. This artificial massaging of EPS is not sustainable and if non-financial corporate credit quality has peaked for the cycle as seems likely, the equity risk/reward tradeoff remains skewed to the downside.
Bottom Line: A capital preservation mindset is still warranted. Continue to prefer global defensive over cyclical sectors.

• DiscoverGold.
Click on "In reply to", for Authors past commentaries.
ETF Trends: Fixed Income, Currencies, and Commodities
* May 19, 2016
https://www.bespokepremium.com/etf-trends/etf-trends-fixed-income-currencies-and-commodities-51816/
• DiscoverGold.
Estimated Weekly Value of ETF Net Issuance Flows
* May 17, 2016
Washington, DC, May 17, 2016—The estimated value of all exchange-traded fund1 (ETF) shares redeemed exceeded that of shares issued by $2.40 billion for the week ended May 11, 2016, the Investment Company Institute reported today.
Equity ETFs2 had estimated negative net issuance of $2.99 billion for the week, compared to estimated negative net issuance of $10.39 billion in the previous week. Domestic equity ETFs had estimated net issuance of $708 million, and world equity ETFs had estimated negative net issuance of $3.69 billion.
Hybrid ETFs2—which can invest in stocks and fixed-income securities—had estimated negative net issuance of $7 million for the week, compared to estimated net issuance of $4 million in the previous week.
Bond ETFs2 had estimated negative net issuance of $465 million, compared to estimated net issuance of $255 million during the previous week. Taxable bond ETFs saw estimated negative net issuance of $616 million, and municipal bond ETFs had estimated net issuance of $151 million.
Commodity ETFs2—which are ETFs (both registered and not registered under the Investment Company Act of 1940) that invest primarily in commodities, currencies, and futures—had estimated net issuance of $1.06 billion, compared to estimated net issuance of $1.36 billion during the previous week.
https://www.ici.org/research/stats/flows/etf/etf_flows_05_17_16
• DiscoverGold.
Dow 30 Trading Range Screen
* May 16, 2016
https://www.bespokepremium.com/think-big-blog/bespokes-dow-30-trading-range-screen/
• DiscoverGold.
ETF Screener
* Friday, May 13, 2016
Select from:
» Gold ETFs
» Oil ETFs
» REIT ETFs
» Inverse (Short) ETFs
» Double 2X ETFs
» Triple 3X ETFs
» International ETFs
» SPDR ETFs
» PowerShares
» iShares
http://www.barchart.com/etf/screener.php?menus=2-0;&filters=textinput-profile.name-contains-gold;&types=7
• DiscoverGold.
Estimated Weekly Value of ETF Net Issuance Flows
* May 10, 2016
Washington, DC, May 10, 2016—The estimated value of all exchange-traded fund1 (ETF) shares redeemed exceeded that of shares issued by $8.77 billion for the week ended May 4, 2016, the Investment Company Institute reported today.
Equity ETFs2 had estimated negative net issuance of $10.39 billion for the week, compared to estimated net issuance of $4.94 billion in the previous week. Domestic equity ETFs had estimated negative net issuance of $10.50 billion, and world equity ETFs had estimated net issuance of $110 million.
Hybrid ETFs2—which can invest in stocks and fixed-income securities—had net issuance of $4 million for the week, compared to estimated net issuance of $23 million in the previous week.
Bond ETFs2 had estimated net issuance of $255 million, compared to estimated net issuance of $1.01 billion during the previous week. Taxable bond ETFs saw estimated net issuance of $108 million, and municipal bond ETFs had estimated net issuance of $147 million.
Commodity ETFs2—which are ETFs (both registered and not registered under the Investment Company Act of 1940) that invest primarily in commodities, currencies, and futures—had estimated net issuance of $1.36 billion, compared to estimated negative net issuance of $128 million during the previous week.
https://www.ici.org/research/stats/flows/etf/etf_flows_05_10_16
• DiscoverGold.
Upgrades/Downgrades
* Updated: May 11, 2016 07:57 a.m. ET

Equity ratings changes direct from brokerage firms.
http://online.wsj.com/mdc/public/page/2_3024-UpgradesDowngrades.html?mod=topnav_2_3062
• DiscoverGold.
ETF Performance Screens
* May 10, 2016
>> Best Performing ETFs Today
http://www.dogsofthedow.com/best-performing-etfs-today.htm
>> Best Performing ETFs: 12 Months
http://www.dogsofthedow.com/best-performing-etfs-12-months.htm
>> Highest Dividend Paying ETFs Today
http://www.dogsofthedow.com/highest-dividend-paying-etfs.htm
• DiscoverGold.
Key Reversals Take Place On Friday
By Tom Bowley
* May 9, 2016
Current Outlook
Technically, it would appear that the bulls are now in charge after Friday's reversal off key moving averages and the solid closing action. The SPY, which tracks the S&P 500, printed a bullish engulfing candle on Friday exactly at its 50 day SMA and close to recent price support as well. The 50 day SMA was to be expected after the recent negative divergence coincided with mid-April price highs. Check out the chart:
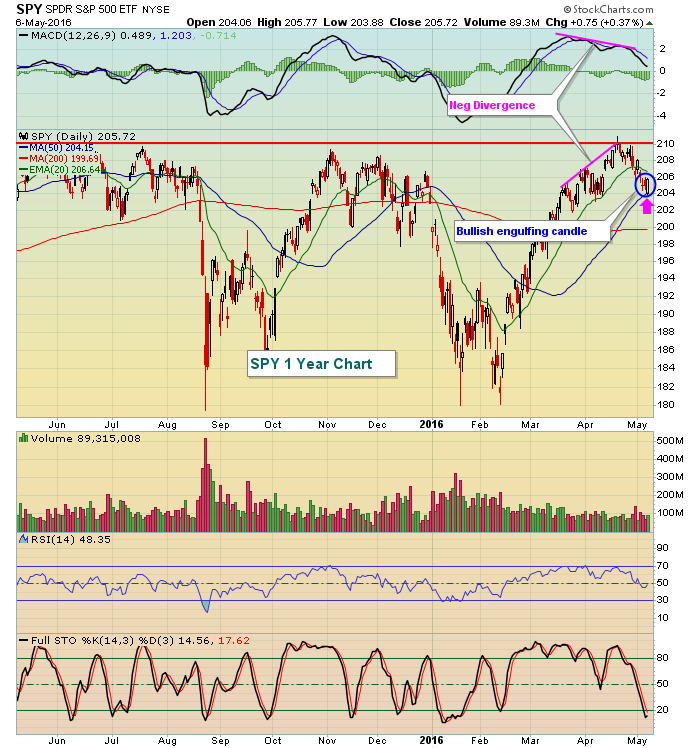
Many times, negative divergences signal short- to intermediate-term tops and we see selling down to test rising 50 day SMAs. From there, the market tells us its future plans. Holding on to support close to 204 now seems critical after printing the reversing bullish engulfing candle on Friday. We'll see.
http://stockcharts.com/articles/tradingplaces/2016/05/key-reversals-take-place-on-friday.html
• DiscoverGold.
Peek Into Future Through Futures
* May 7, 2016
The following are futures positions of non-commercials as of May 3, 2016. Change is week-over-week.
E-mini S&P 500: It took 13 sessions for the S&P 500 index to travel from the upper Bollinger Band to the lower bound, giving back 3.4 percent in the process.
This is also a spot where the bulls needed to put their foot down. The 50-day moving average approximates the lower Bollinger Band. The last time the average was tested from above was right before the collapse in stocks in late December last year. A failure to save it would be a big tell – that selling is accelerating. On Friday, it was breached intra-day, but closed above.
Outflows accelerated this week. In the week ended Wednesday, a whopping $11.2 billion left U.S.-based equity funds (courtesy of Lipper). This was the largest weekly withdrawal since the week ended January 6th ($12 billion). Since February 10th, nearly $28 billion has now been redeemed. Money is leaving, taking advantage of the rally.
Ditto with SPY, the SPDR S&P 500 ETF. In the week ended Wednesday, all five sessions witnessed outflows, totaling $6.4 billion (courtesy of ETF.com).
This is precisely not what the bulls were hoping to see. Momentum is at risk of slowing down/reversing, and if weekly indicators take over, there is plenty of unwinding left of overbought conditions.
Currently net long 10.1k, up 8.6k.

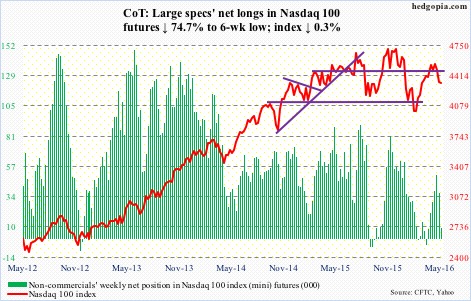
Nasdaq 100 index (mini): Apple (AAPL) is teetering on the brink of a make-or-break level. Good luck to QQQ, the PowerShares Nasdaq 100 ETF, investors if the stock breaks 92. This support goes back to June 2014, or even September 2012. AAPL makes up 11.7 percent of the ETF.
Last week, the Nasdaq 100 lost both its 50- and 200-day moving averages, and sat on crucial support at 4350. This week, it lost the latter support, although Friday saw quite an intra-day reversal.
On a daily basis, technicals are oversold. Should a rally ensue near term, 4414 is where both 50- and 200-day averages converge. That said, it is a tough road ahead should weekly indicators take over.
Particularly so if flows do not cooperate. In the week ended Wednesday, a hefty $2.5 billion came out of QQQ, following $97 million in inflows in the prior week.
Currently net long 9.3k, down 27.5k.
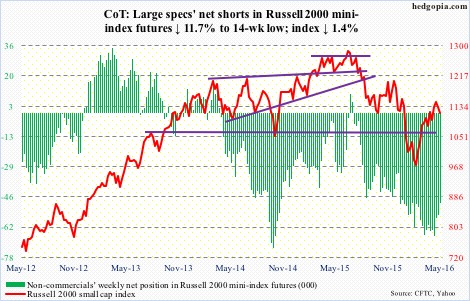
Russell 2000 mini-index: During the January collapse in U.S. stocks, the Russell 2000 fell out of a rising trend line drawn from March 2009. After a February hammer reversal, March and April were positive months, with the April high kissing the belly of that trend line but getting rejected.
In the meantime, the index this week lost dual support at 1120-ish – horizontal line going back to September 2013 as well as two-month channel. The $686 million that came out of IWM, the iShares Russell 2000 ETF, in the week ended Wednesday probably played a role in this.
Resistance working and support failing, that is not a good combo.
The index is currently trapped between 50- and 200-day moving averages, with the former about to go flat and the latter declining. There is decent support at 1080. On Friday, it dropped to 1101.57 before reversing.
Currently net short 49k, down 6.5k.
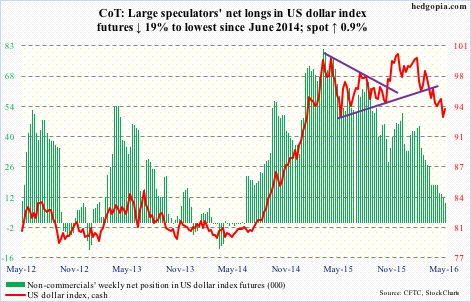
US Dollar Index: Just when it looked like the dollar index was breaking down came a weekly hammer reversal candle. The week started with Monday continuing to extend last week’s breakdown, only to see a major Tuesday reversal. With rally the next three sessions, it is back above 93.50, which was lost last week.
If this week’s action is a precursor to an imminent rally, there is a lot of repair work that needs to be done. The 50-day moving average is still dropping. Shorter-term moving averages can at least begin to go flat, unless the dollar index comes under renewed pressure.
Non-commercials continue to cut back net longs, which are now the lowest since June 2014.
Currently net long 9.2k, down 2.2k.
VIX: The good: there is a 10/20 crossover (moving average) on spot VIX, with plenty of room to run on a weekly chart. The bad: daily indicators are now overbought. And the ugly: it is struggling to stay above its 50-day moving average, with 16-16.50 acting as a ceiling. On Friday, that resistance was in play again, with the spot unable to save the 50-day.
The VIX-to-VXV ratio fell back to low 0.80s after a mid-0.80s reading last week. With this, in seven of the last eight weeks, the ratio has been in high 0.70s to low 0.80s. Compressed spring!
Currently net short 77.4k, up 1.6k.

Hedgopia Risk Reward Index
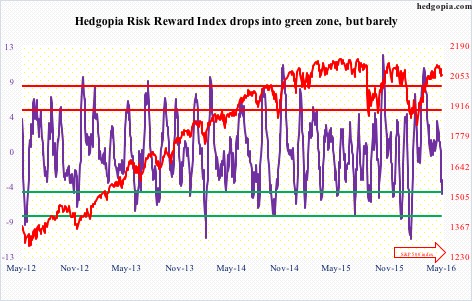
http://www.hedgopia.com/cot-peek-into-future-through-futures-42/
• DiscoverGold.
Click on "In reply to", for Authors past commentaries.
ETF Asset Class Performance
* May 6, 2016
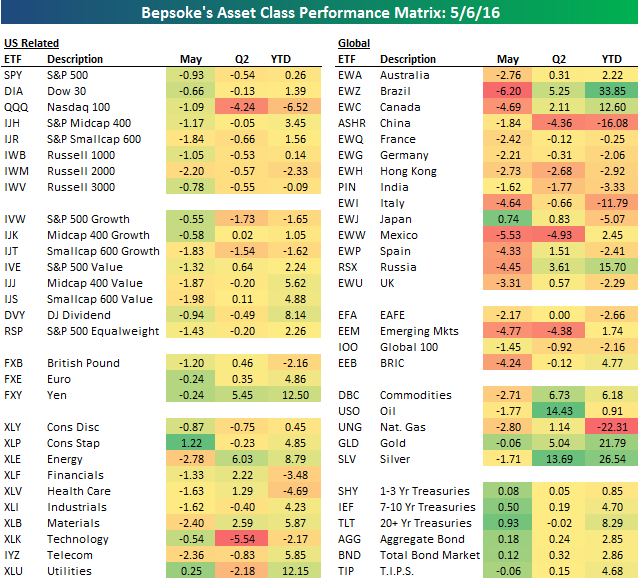
https://www.bespokepremium.com/think-big-blog/bespokes-etf-asset-class-performance-matrix-5616/
• DiscoverGold.
Estimated Value of ETF Net Issuance Flows
* May 3, 2016
Washington, DC, May 3, 2016—The estimated value of all exchange-traded fund1 (ETF) shares issued exceeded that of shares redeemed by $5.85 billion for the week ended April 27, 2016, the Investment Company Institute reported today. In addition to this report, ICI will also be publishing long-term mutual fund flows and a report that combines data for ETFs and mutual funds, available on the ICI website.
Equity ETFs2 had estimated net issuance of $4.94 billion for the week, compared to estimated negative net issuance of $213 million in the previous week. Domestic equity ETFs had estimated net issuance of $4.40 billion, and world equity ETFs had estimated net issuance of $538 million.
Hybrid ETFs2—which can invest in stocks and fixed-income securities—had estimated net issuance of $23 million for the week, compared to estimated net issuance of $4 million in the previous week.
Bond ETFs2 had estimated net issuance of $1.01 billion, compared to estimated net issuance of $1.48 billion during the previous week. Taxable bond ETFs saw estimated net issuance of $881 million, and municipal bond ETFs had estimated net issuance of $132 million.
Commodity ETFs2—which are ETFs (both registered and not registered under the Investment Company Act of 1940) that invest primarily in commodities, currencies, and futures—had estimated negative net issuance of $128 million, compared to estimated negative net issuance of $142 million during the previous week.
https://www.ici.org/research/stats/flows/etf/etf_flows_05_03_16
• DiscoverGold.
Trading Notes: Monday, May 2nd
By Brett Steenbarger, Ph.D.
* May 2, 2016
* The best model for making trading improvements comes from understanding the drivers of your most successful trades. Re-engineering your best trading makes you your own guru.
* We saw a sharp selloff on Friday, with NASDAQ shares taking out their early April lows and new monthly lows outnumbering new highs, 583 to 513. VIX hit 17 during the session before dropping on a late rally. That rally has continued modestly in overnight trading. On a short-term basis, we're oversold, with fewer than 30% of SPX shares trading above their 3- and 5-day moving averages. My intermediate measures, however, are not yet in oversold territory. My leaning is to sell bounces that cannot take out Friday's highs.
* One concern I have about the market is the change of regimes in recent sessions. The weak dollar is buoying commodities but not stocks, and it's growth stocks (SPYG) underperforming value ones (SPYV). Earnings have not been impressive and we seem to be pricing in economic weakness. It's far from clear that the move to negative interest rates has sparked either economic optimism or growth. All that being said, I am treating this as a correction within a larger upward cycle, not as the start of a bear market.
* Note how the realized volatility of VIX (implied vol) has hit low levels at relative market peaks and has peaked at relative market bottoms. We are coming off a very low vol of VIX.

http://traderfeed.blogspot.com/2016/05/trading-notes-for-week-of-may-2-2016.html
• DiscoverGold.
Click on "In reply to", for Authors past commentaries.
Stocks With the Largest Short Interest
* Friday, April 29, 2016
> nyse
http://bigcharts.marketwatch.com/reports/bigmovers.asp?data=1&start=1&report=10&report_country_code=US&date=20160429
• DiscoverGold.
Click on "In reply to", to see reports from prior weeks.
ETF Tools
* Friday, April 29, 2016
 New Highs / Lows - List of ETFs making new highs and lows
 Volatility - Chart the rolling realized volatility of up to five ETFs
 Correlation - See how the relationship between two ETFs has varied over time.
 Dividend Yield - Compare the dividend yield of two ETFs
 Total Return vs Price Return - See the impact of dividend reinvestment - chart the difference between price return and total return
http://www.etfreplay.com/tools.aspx
• DiscoverGold.
Daily Charts = SPY, $INDU, QQQ, IWM
* April 28, 2016
http://stockcharts.com/public/1107832/chartbook/308233753;
http://stockcharts.com/public/1107832/chartbook/308234274;
http://stockcharts.com/public/1107832/chartbook/308234284;
http://stockcharts.com/public/1107832/chartbook/308234291;
• DiscoverGold.
Estimated Value of ETF Net Issuance Flows
* April 27, 2016
Washington, DC, April 26, 2016 - The estimated value of all exchange-traded fund1 (ETF) shares issued exceeded that of shares redeemed by $1.13 billion for the week ended April 20, 2016, the Investment Company Institute reported today. In addition to this report, ICI will also be publishing long-term mutual fund flows and a report that combines data for ETFs and mutual funds, available on the ICI website.
Equity ETFs2 had estimated negative net issuance of $213 million for the week, compared to estimated net issuance of $1.17 billion in the previous week. Domestic equity ETFs had estimated negative net issuance of $138 million, and world equity ETFs had estimated negative net issuance of $75 million.
Hybrid ETFs2—which can invest in stocks and fixed-income securities—had estimated net issuance of $4 million for the week, compared to estimated net issuance of $23 million in the previous week.
Bond ETFs2 had estimated net issuance of $1.48 billion, compared to estimated net issuance of $605 million during the previous week. Taxable bond ETFs saw estimated net issuance of $1.34 billion, and municipal bond ETFs had estimated net issuance of $140 million.
Commodity ETFs2—which are ETFs (both registered and not registered under the Investment Company Act of 1940) that invest primarily in commodities, currencies, and futures—had estimated negative net issuance of $142 million, compared to estimated negative net issuance of $617 million during the previous week.
https://www.ici.org/research/stats/flows/etf/etf_flows_04_26_16
• DiscoverGold.
Upgrades/Downgrades
* Updated: April 25, 2016 07:16 a.m. ET

Equity ratings changes direct from brokerage firms.
http://online.wsj.com/mdc/public/page/2_3024-UpgradesDowngrades.html?mod=topnav_2_3022
• DiscoverGold.
ETFs Sector Performance Today (Friday, April 22)
* April 24, 2016
>> Best Performing Technolgy ETFs Today
http://www.dogsofthedow.com/best-performing-technology-etfs-today.htm
>> Best Performing Healthcare ETFs Today
http://www.dogsofthedow.com/best-performing-healthcare-etfs-today.htm
>> Best Performing Energy ETFs Today
http://www.dogsofthedow.com/best-performing-energy-etfs-today.htm
>> Best Performing Financial ETFs Today
http://www.dogsofthedow.com/best-performing-financial-etfs-today.htm
>> Best Performing Real Estate ETFs Today
http://www.dogsofthedow.com/best-performing-real-estate-etfs-today.htm
>> Best Performing Commodity ETFs Today
http://www.dogsofthedow.com/best-performing-commodity-etfs-today.htm
• DiscoverGold.
S&P 500 Stages Yet Another Breakout — Although Feebly — Likely Wouldn’t Hold
* April 18, 2016
In early April, the S&P 500 (2080.73) is rejected by a July 2015 declining trend line. After a subsequent slight pullback, the index reenergizes itself and goes for that resistance again. Last Thursday, it succeeds (Chart 1). But is the push strong enough to qualify for a breakout? It is a breakout alright, but ever so slightly.
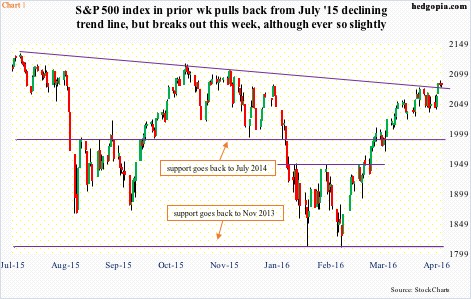
A bigger question is, can equity bulls build on it? The short answer is, maybe, maybe not. Here is why.
Ever since U.S. equities reversed course on February 11th from their January swoon, resistance has fallen like dominoes, followed by breakout retest on several. The S&P 500 broke out of 1950, the 50-day moving average, 1990, the 200-day moving average, 2040, and most recently the July 2015 trend line.
For instance, after the index broke out of 2040 in late March, buyers showed up on pullback for several sessions before pushing higher.
The fact that we are in the midst of an earnings season can cut both ways.
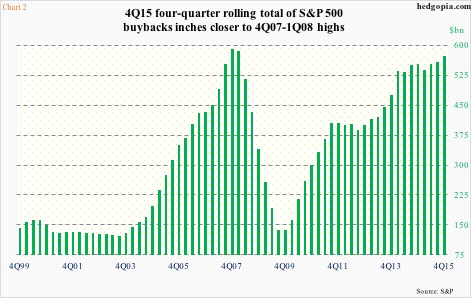
Because of blackout, buybacks are currently not a factor. They have been such a powerful force the last six years. In the midst of negative flows into U.S.-based equity funds as well as foreigners persistently selling U.S. stocks, corporate buybacks have been a steady source of buying power.
In the fourth quarter last year, a four-quarter rolling total of S&P 500 buybacks was $572 billion – the highest since $585 billion in 1Q08. The green bars in Chart 2 have persistently risen since 2009 lows.
The lack of buybacks is an equity headwind, while low-balled earnings estimates are a potential tailwind.
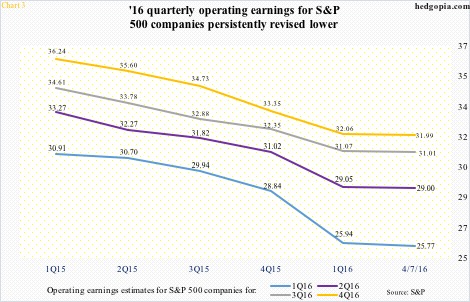
Chart 3 offers quarterly progression of operating earnings estimates for S&P 500 companies for 2016. They have been persistently revised downward, with 1Q16 going from $30.91 in 1Q15 to $25.77 now (as of April 7th). Estimates for this year have been revised all the way from $137.50 in 4Q14 to $117.78 now. This only raises the odds of companies beating or meeting estimates when they report.
We saw this unfold last week among major U.S. banks.
Post-earnings, CitiBank (C) surged 11 percent, Bank of America (BAC) 8.7 percent, JP Morgan (JPM) 7.2 percent, and Wells Fargo (WFC) 2.5 percent. Even though on a year-over-year basis, earnings fell for all four – C’s was down 27 percent, BAC’s 16 percent, JPM’s seven percent, and WFC’s five percent.
The reason for the beat? Ahead of earnings release, analysts were expecting even sharper drop. BAC’s, for example, went from $0.32 three months ago to $0.20, enabling the bank to beat by a penny.
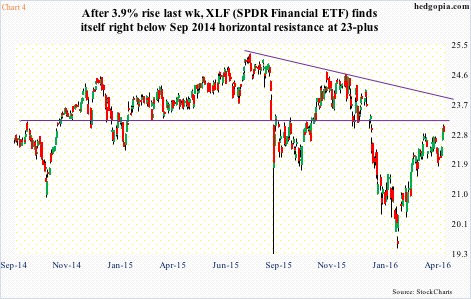
As a result, XLF, the SPDR financial ETF, had a big week last week, up 3.9 percent. A word of caution: even after this move, and the 19–percent jump since February 11th, the ETF is yet to break out of resistance at $23-plus going back to September 2014. A breakout here would be met by another resistance at just under $24 (Chart 4).
That said, there was some serious buying interest last week.
This is the yang of U.S. equities’ yin-yang equation.
The yin? Perhaps crude oil, among others.
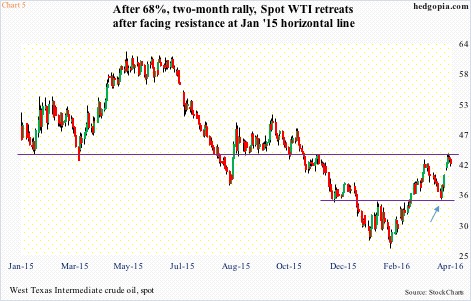
Off February 11th intra-day low, spot West Texas Intermediate crude ($41.75) rallied 68 percent in two months, in the process breaking out of $34.50-$35 on March 4th, followed by a successful retest a month later (arrow in Chart 5). A resulting slingshot move took the crude past its 200-day moving average and right into January 2015 horizontal-line resistance, also tagging the upper Bollinger Band. If there was ever a time to pause/reverse, this was it.
The WTI remains overbought on both a daily and weekly chart. And the failed Doha talks will probably be taken as an excuse to sell. Since at least February 11th, which is when stocks bottomed as well, the two have moved in tandem, give and take. Would the S&P 500 be able to break this correlation?
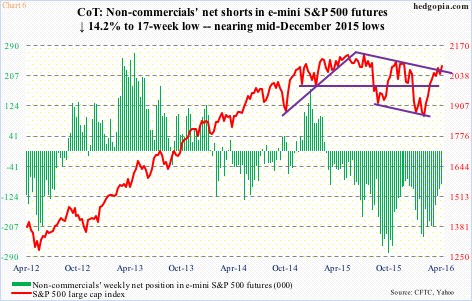
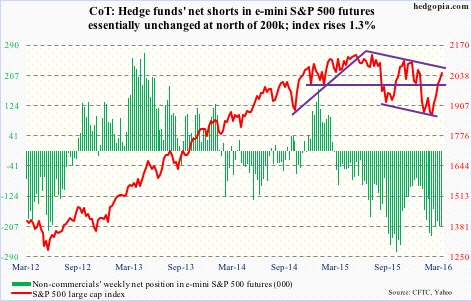
Bulls hope non-commercials continue to unwind net shorts in e-mini S&P 500 futures. As of Tuesday last week, they reduced holdings by another 14 percent to a 14-week low. The S&P 500 rallied 1.6 percent last week. Since February 9th, net shorts have declined 62 percent (Chart 6), and we know how stocks fared during the period.
With each weekly drop, the fuel for squeeze runs dry. Currently, these traders’ net shorts are 16 percent away from mid-December lows. Back then, the S&P 500 peaked before net shorts bottomed.
Also, if the dynamics between offensive versus defensive sectors are any indication, then odds of a major squeeze are low.
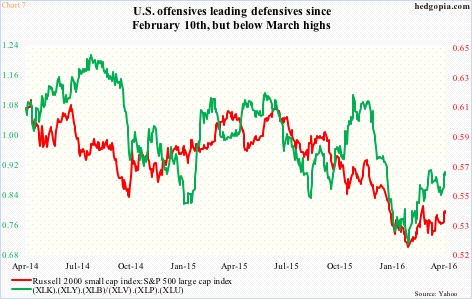
Chart 7 presents two ratios – one, the ratio of the Russell 2000 small cap index to the S&P 500 large cap index, and two, the ratio of a product of XLK (the SPDR technology ETF), XLY (the SPDR consumer discretionary ETF), and XLB (the SPDR materials ETF) to a product of XLV (the SPDR health care ETF), XLU (the SPDR utilities ETF), and XLP (the SPDR consumer staples ETF).
The numerator in both ratios signify risk-on. As could be expected, they began rising off February 10th lows, but have already peaked even as indices are near recent highs. Risk-off in progress in a very subtle way?
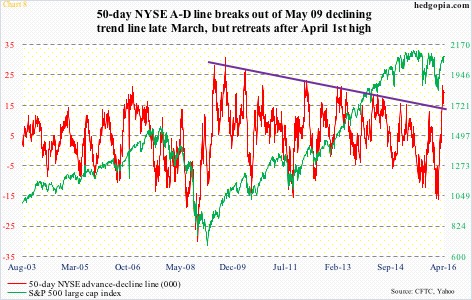
That said, things are probably not going to fall apart any time soon either. The NYSE 50-day advance-decline line just broke out of a May 2009 declining trend line (Chart 8). This is potentially a huge deal, with a caveat. After it broke out in March, it peaked on April 1st, and has more or less gone sideways since – perhaps justifying the ‘maybe, maybe not’ answer in the opening paragraphs above.
http://www.hedgopia.com/sp-500-stages-yet-another-breakout-although-feebly-likely-wouldnt-hold/
• DiscoverGold.
Click on "In reply to", for Authors past commentaries.
Breadth Indicators - Charts
* March 25, 2016
>> Dow Jones Industrial Average vs % of DJIA Stocks Above 5-Day Moving Average Chart
http://www.indexindicators.com/charts/djia-vs-djia-stocks-above-5d-sma-params-x-x-x-x/
>> S&P 500 vs % of S&P 500 Stocks Above 5-Day Moving Average Chart
http://www.indexindicators.com/charts/sp500-vs-sp500-stocks-above-5d-sma-params-x-x-x-x/
>> Nasdaq 100 vs % Nasdaq 100 Stocks Above 5-Day Moving Average Chart
http://www.indexindicators.com/charts/nasdaq100-vs-nasdaq100-stocks-above-5d-sma-params-x-x-x-x/
• George.
Put/Call - Charts
* March 25, 2016
>> S&P 500 vs Equity Put/Call
http://www.indexindicators.com/charts/sp500-vs-put-call-ratio-equity-1d-sma-params-x-x-x-x/
>> S&P 500 vs Index Put/Call
http://www.indexindicators.com/charts/sp500-vs-put-call-ratio-index-1d-sma-params-x-x-x-x/
>> S&P 500 vs Total Put/Call
http://www.indexindicators.com/charts/sp500-vs-put-call-ratio-total-1d-sma-params-x-x-x-x/
• George.
Speculative ETF traders
* March 23, 2016
Update on speculative ETF traders -- still somewhat pessimistic despite the strong rally thus far.

https://twitter.com/NDR_Research
• George.
Trading Notes: Monday, March 21st
By Brett Steenbarger, Ph.D.
* March 21, 2016
* So often, in our trading goals, it's set and forget. We set goals, but often fail to follow through. This article draws upon recent research to identify how can we become more productive--better at pursuing and reaching the goals that we define.
* Stocks closed higher overall on Friday, and we're now seeing over 90% of SPX shares trading above their 20- and 50-day moving averages. That is unusual strength off the February lows. My measure of upticks versus downticks among NYSE stocks (NYSE TICK) showed solid strength on Fed day and, as the chart below shows, has been in an uptrend on a cumulative basis, eclipsing its previous high. I believe we're pricing in a more favorable environment for equities, given QE overseas and a moderating Fed.

* Yet another way of tracking the strength and weakness of shares is to look at each stock on the NYSE and see if it has closed above or below its Bollinger Bands. (Raw data from Stock Charts). As the chart below shows, we have reversed the pattern of net weakness from 2015 and early 2016 and have been persistently above the zero line in recent days. Bottom line, I'm not seeing the kind of deterioration that would normally precede a major market reversal.

* A while back I mentioned the shares outstanding in the SPY ETF as a useful sentiment gauge and noted that it had been flashing bearish sentiment, even after the liftoff from the February lows. Sure enough, history repeated and we continued higher. Now we're seeing an expansion in shares outstanding (net bullish sentiment). In the past that has led to subnormal returns for SPY.
http://traderfeed.blogspot.com/2016/03/trading-notes-for-week-of-march-21-2016.html
• George.
Click on "In reply to", for Authors past commentaries.
Stocks With the Largest Short Interest
* Friday, March 18, 2016
> nyse
http://bigcharts.marketwatch.com/reports/bigmovers.asp?data=1&start=1&report=10&report_country_code=US&date=20160318
• George.
Click on "In reply to", to see reports from prior weeks.
Peek Into Future Through Futures
* March 19, 2016
The following are futures positions of non-commercials as of March 15, 2016. Change is week-over-week.
E-mini S&P 500: Some signs of FOMO (fear of missing out) are showing up. Buy-the-dips is persistent, and has worked so far. Most indicators are at extreme complacent readings.
The percent of S&P 500 stocks above 50-day moving average rose to over 93 percent. On January 20th, this dropped below 10, to nine. From one extreme to another! We know how that ended for the bears. And we know how this is going to end for the bulls.
In the week ended Wednesday last week, $4.6 billion moved into U.S.-based equity funds – first inflows in 10 weeks. Turns out it was just a one-hit wonder. This week, there were $2.1 billion in outflows (courtesy of Lipper). With this, since the week ended February 10th, nearly $10 billion has been withdrawn. (The S&P 500 bottomed on February 11th.)
The Lipper data also shows that $35.9 billion left money-market funds this week. This jibes with the ICI data showing a decline of nearly $40 billion in money-market funds in the same week. Not much made it into stocks, as Lipper shows.
That said, SPY, the SPDR S&P 500 ETF, has been attracting funds of late – $3.1 billion in the week ended Wednesday, and $2.4 billion since the S&P 500 broke out of 1950 on March 1st (courtesy of ETF.com).
This week, the S&P 500 took care of 200-DMA, as well as 2040. Momentum is intact, but reversal risk is very high.
Currently net short 205.9k, up 290.
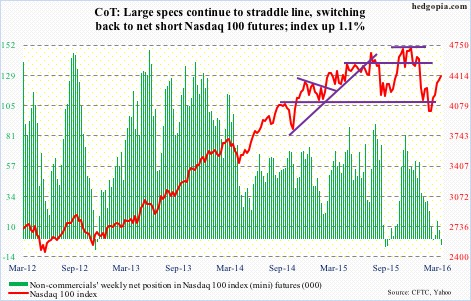
Nasdaq 100 index (mini): Broke out of 4350, but action is lethargic.
On Wednesday through Friday, the index closed right underneath 200-DMA, with a doji on Friday. The $2.3 billion that moved into QQQ, the PowerShares Nasdaq 1000 ETF, in the week ended Wednesday is probably betting that the average will be taken care of. The inflows followed defense of 50-DMA on Thursday last week. Failure to take out 200-DMA risks these inflows leave briskly.
Currently net short 4.4k, down 11.2k.
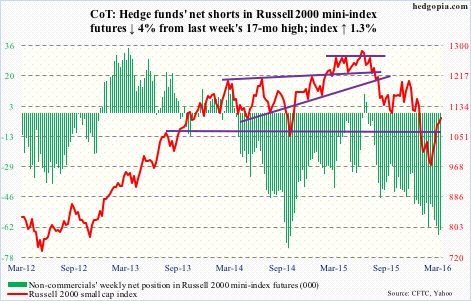
Russell 2000 mini-index: Until Friday, the Russell 2000 went sideways for two weeks. IWM, the iShares Russell 2000 ETF, attracted $1.3 billion during the period (courtesy of ETF.com). These longs are not making much money.
Friday was a saving grace, with the index feebly breaking out of the two-week congestion.
Non-commercials are not convinced this will continue. Net shorts remain very high, with last week at a 17-month high.
Currently net short 63.5k, down 2.7k.
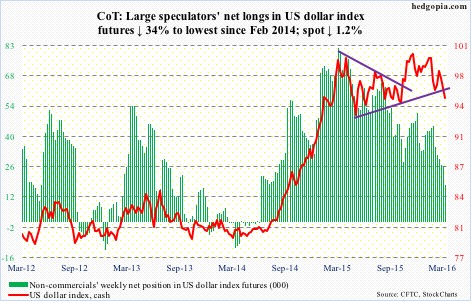
US Dollar Index: In the currency land, what the dollar index experienced on Wednesday and Thursday can be described as shellacking – down two percent.
Support at 97 is gone. In fact, on Wednesday – the FOMC decision day – the index tagged that resistance, which is where 200-DMA lies as well, and was vigorously denied.
Non-commercials continue not to show any love. They cut net longs to the lowest since February 2014.
That said, daily momentum indicators are grossly oversold.
Currently net long 17.5k, down 8.9k.
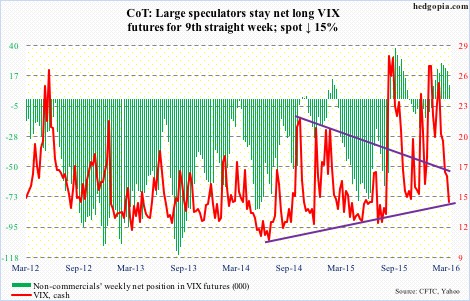
VIX: The August 2015 rising trend line, which otherwise was providing support, was broken on Wednesday, and spot VIX lost three points in a couple of sessions.
Ray of hope for volatility bulls: Friday produced a doji at the lower Bollinger Band.
As well, the VIX-to-VXV ratio closed the week at 0.78, matching the mid-March low last year. Also, this was the first time the ratio dropped into oversold zone in three months. Time to rally!
Currently net long 10.3k, down 10.8k.
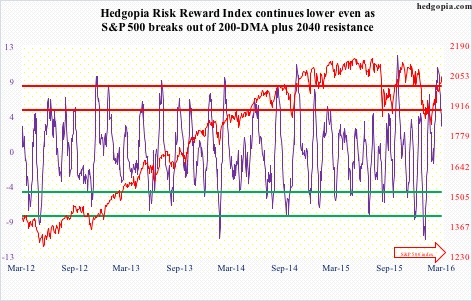
Hedgopia Risk Reward Index
http://www.hedgopia.com/cot-peek-into-future-through-futures-35/
• George.
Click on "In reply to", for Authors past commentaries.
SPY: Rising Wedge Delivers but Dissapoints
By Carl Swenlin
* March 12, 2016
One of my favorite chart patterns is the wedge -- rising or falling -- because it can usually be depended upon to resolve opposite the direction the wedge is moving. Specifically, a rising wedge will usually resolve downward and vice versa. Recently I saw some wedges developing on the SPY chart that reinforced my bearish feelings about the rally off the February lows. They have resolved as expected, but bearish expectations have not been realized. Let's watch the evolution of the evidence.
On Monday the wedge formation I had been following looked like it was sure to break downward. The wedge was squeezing price to a point where something had to give, and, as a rule, the steepest line is usually the weakest.
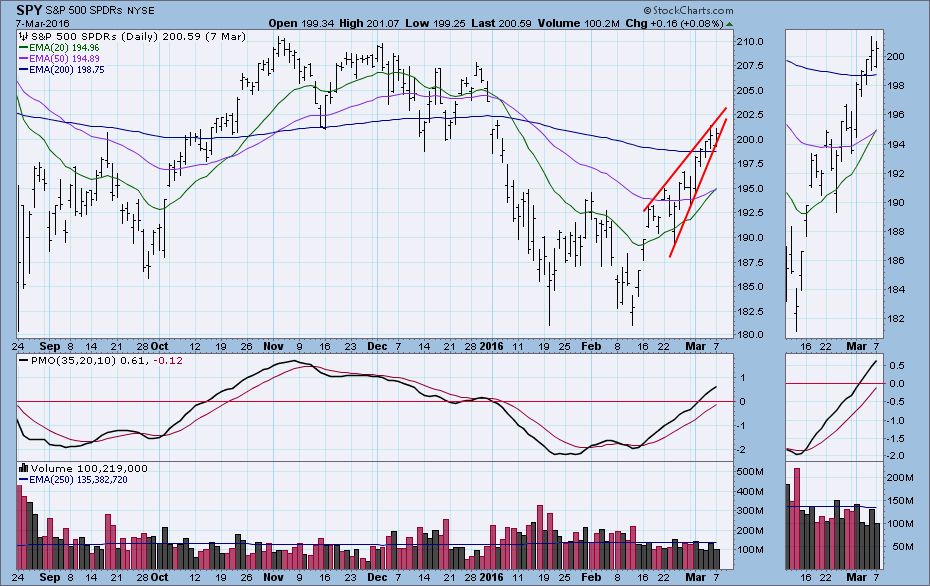
Hah! I was right . . . but not elated, because there was no follow-through the day after the breakdown.
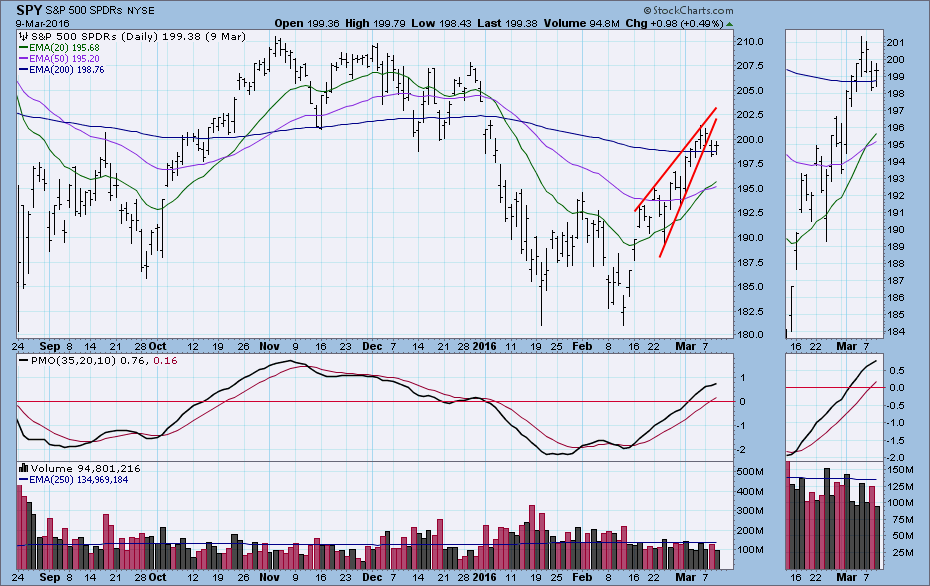
But I noticed that a larger wedge emerged when I drew the rising bottoms line from the February low. Again the wedge resolved downward and hit a low for the week, but price bounced back to the line, making the breakdown somewhat dubious.
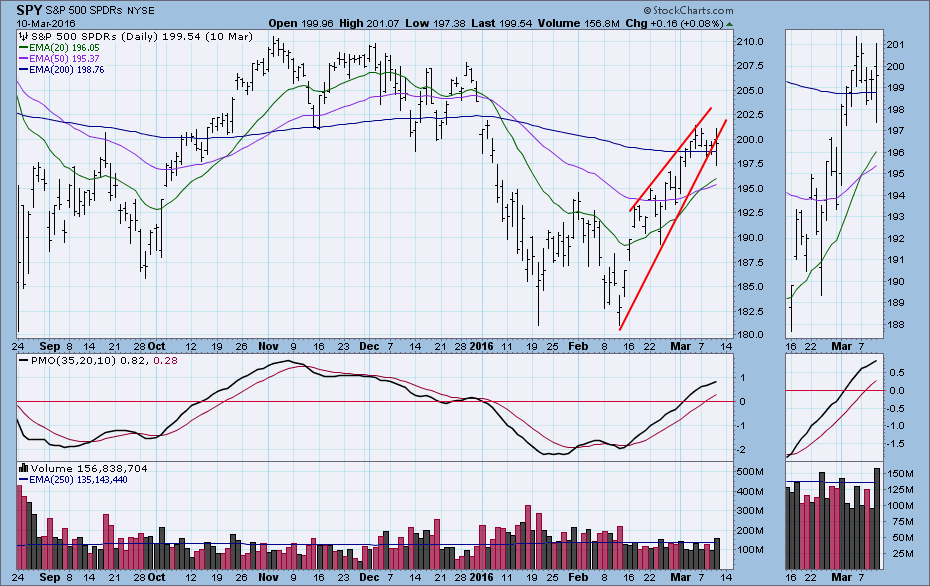
On Friday price rallied back into the wedge, making a higher high. Time to give up on the wedge. At this point I have realigned the rising bottoms line across the two most recent and prominent bottoms. Coincidentally, it is parallel with the rising tops line, and a rising trend channel has been formed.
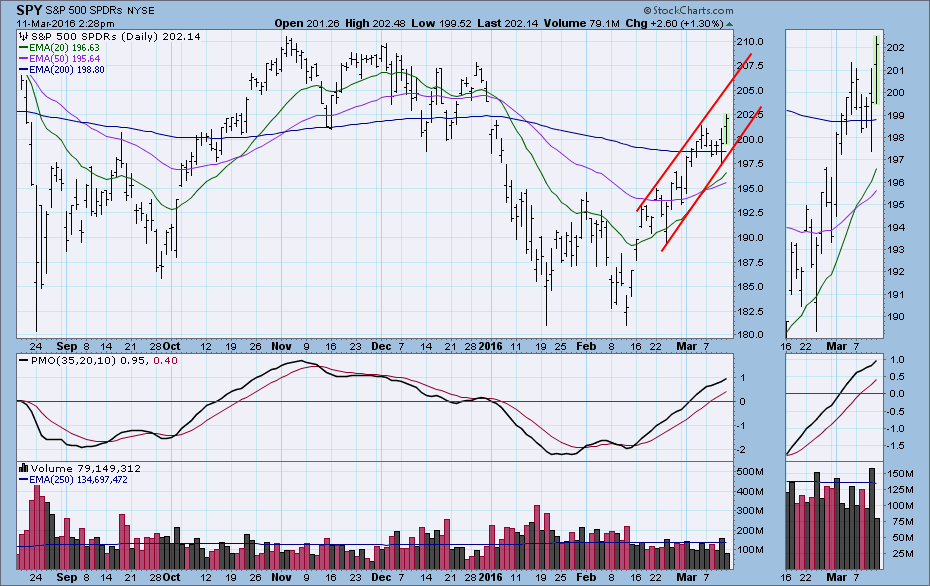
The top of the channel provides us with new technical parameters, helping us estimate how much farther price might rally before hitting technical resistance. Conversely, if price fails to reach the top of the channel before falling back to the bottom of the channel, that would be a strong sign that the rally is over.
SUMMARY: The rising wedges resolved as expected, but there was no downside follow-through to break the rally. This forced us to adjust to the new evidence and develop a new rationale befitting current market behavior.
http://stockcharts.com/articles/decisionpoint/2016/03/spy-rising-wedge-delivers-but-dissapoints.html
• George.
Click on "In reply to", for Authors past commentaries.
Asset Class Performance Using ETFs
* March 7, 2016
Below is a look at the performance of various asset classes today using our key ETF matrix. While the S&P 500 (SPY) was flat, the Nasdaq 100 (QQQ) finished down 62 basis points due to weakness in “FANG” stocks (FB, AMZN, NFLX, GOOGL). Small-caps outperformed large-caps significantly today, and the Energy and Materials sectors flew higher on the back of higher commodities prices. Oil rallied nearly 5%.
There was wide disparity in terms of international market performance. Australia, Canada, Mexico, Russia and the UK finished nicely higher on the day, while Brazil, China, Hong Kong, Italy and Japan finished deep in the red. Treasury ETFs finished slightly lower.
Along with today’s performance, we also include performance numbers for each ETF since the S&P’s low was made on February 11th, as well as year to date.
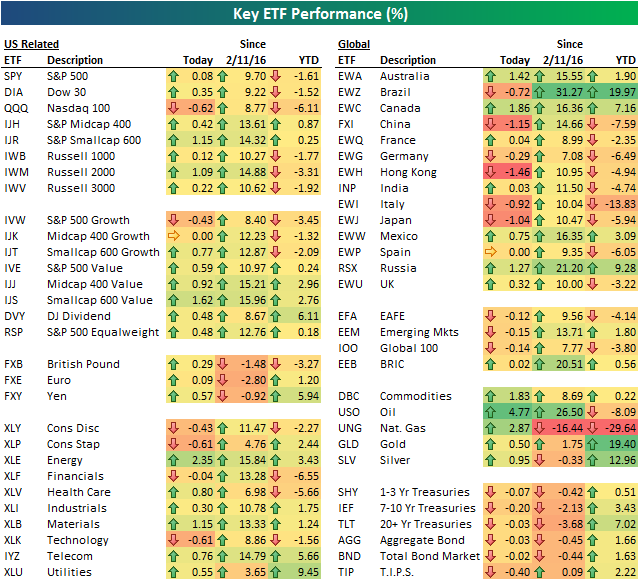
https://www.bespokepremium.com/think-big-blog/asset-class-performance-3716/
• George.
Trading Notes: Monday, March 7th
By Brett Steenbarger, Ph.D.
* March 7, 2016
* If our trading does not provide these four psychological benefits, we're apt to underperform and lose our ability to perform in the zone. We can best manage our positions if we're managing ourselves well.
* We saw some broad selling late on Friday and so far have not been able to bounce in overnight trading. Friday closed with over 80% of SPX stocks closing above their 5, 10, 20, and 50-day moving averages, but a waning percentage closing above their 3-day averages. (Data from Index Indicators). I would not be surprised to see a normal correction of the recent strength; that should terminate above the late February lows to sustain the current uptrend. I would also not be surprised to see subdued risk-taking ahead of this week's ECB meeting.
* The intermediate-term cycle measures that I track continue to be stretched to the upside. Note how we've rallied in the face of an "overbought" cycle. That momentum suggests that we're not yet at a point where we would expect the uptrend to meaningfully reverse.

* One measure I track is the volatility of market breadth. Specifically, I track the volatility of the daily readings of SPX 500 stocks making fresh new highs and lows on a 5, 20, and 100-day basis. We recently hit a meaningfully low level in that measure. Since 2010, when we've been in the lowest quartile of readings for breadth volatility (as at present), the next five days in SPX have averaged a gain of only .01%. When we've been in the highest quartile, the next five days in SPX have averaged a gain of +.44%. It's one more measure that makes me open to the possibility of some short-term correction of the recent market strength.
http://traderfeed.blogspot.com/2016/03/trading-notes-for-week-of-march-7-2016.html
• George.
Click on "In reply to", for Authors past commentaries.
|
Followers
|
38
|
Posters
|
|
|
Posts (Today)
|
0
|
Posts (Total)
|
2987
|
|
Created
|
11/04/07
|
Type
|
Free
|
| Moderators | |||
* SSO - ProShares Ultra S&P500 (the Fund), formerly Ultra S&P500 ProShares, seeks daily investment results that correspond to twice
the daily performance of the S&P 500 Index.
* UPRO - ProShares UltraPro S&P500 (the Fund), seeks daily investment results that correspond to three times the daily performance of the S&P 500 Index.
* The S&P 500 Index is a measure of large-cap United States stock market performance. It is a capitalization weighted index of 500
United States operating companies and real estate investment trusts (REITs) selected by an S&P committee through a non-
mechanical process that factors criteria, such as liquidity, price, market capitalization, financial viability and public float.
Reconstitution occurs both on a quarterly and on an ongoing basis.
* The Funds take positions in securities and/or financial instruments that, in combination, should have similar daily return
characteristics as 200% for the SSO and 300% for the UPRO of the daily return of the SPDR (SPY) Index. The Fund’s investment
advisor is ProShare Advisors LLC.
http://finviz.com/quote.ashx?t=sso
| SPY [NYSE] SSO [NYSE] UPRO [NYSE] |
| SPDR S&P 500 ETF |
| Financial - Exchange Traded Fund - USA |
All information posted on this board is not meant to suggest any specific action, but to point out the technical signs that can help our readers make their own specific decisions. Your Due Diligence is a must!
| Volume | |
| Day Range: | |
| Bid Price | |
| Ask Price | |
| Last Trade Time: |
