


| Followers | 0 |
| Posts | 148553 |
| Boards Moderated | 7 |
| Alias Born | 03/10/2004 |
Sunday, May 08, 2016 9:22:44 AM
Peek Into Future Through Futures
* May 7, 2016
The following are futures positions of non-commercials as of May 3, 2016. Change is week-over-week.
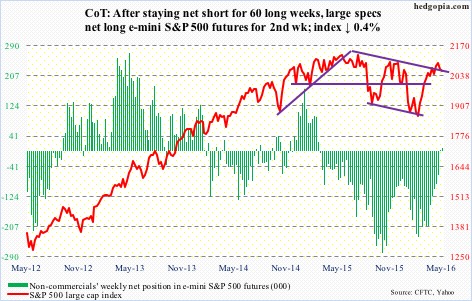
E-mini S&P 500: It took 13 sessions for the S&P 500 index to travel from the upper Bollinger Band to the lower bound, giving back 3.4 percent in the process.
This is also a spot where the bulls needed to put their foot down. The 50-day moving average approximates the lower Bollinger Band. The last time the average was tested from above was right before the collapse in stocks in late December last year. A failure to save it would be a big tell – that selling is accelerating. On Friday, it was breached intra-day, but closed above.
Outflows accelerated this week. In the week ended Wednesday, a whopping $11.2 billion left U.S.-based equity funds (courtesy of Lipper). This was the largest weekly withdrawal since the week ended January 6th ($12 billion). Since February 10th, nearly $28 billion has now been redeemed. Money is leaving, taking advantage of the rally.
Ditto with SPY, the SPDR S&P 500 ETF. In the week ended Wednesday, all five sessions witnessed outflows, totaling $6.4 billion (courtesy of ETF.com).
This is precisely not what the bulls were hoping to see. Momentum is at risk of slowing down/reversing, and if weekly indicators take over, there is plenty of unwinding left of overbought conditions.
Currently net long 10.1k, up 8.6k.
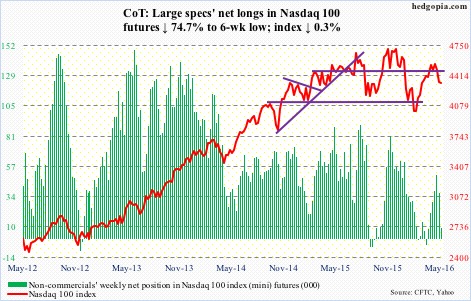
Nasdaq 100 index (mini): Apple (AAPL) is teetering on the brink of a make-or-break level. Good luck to QQQ, the PowerShares Nasdaq 100 ETF, investors if the stock breaks 92. This support goes back to June 2014, or even September 2012. AAPL makes up 11.7 percent of the ETF.
Last week, the Nasdaq 100 lost both its 50- and 200-day moving averages, and sat on crucial support at 4350. This week, it lost the latter support, although Friday saw quite an intra-day reversal.
On a daily basis, technicals are oversold. Should a rally ensue near term, 4414 is where both 50- and 200-day averages converge. That said, it is a tough road ahead should weekly indicators take over.
Particularly so if flows do not cooperate. In the week ended Wednesday, a hefty $2.5 billion came out of QQQ, following $97 million in inflows in the prior week.
Currently net long 9.3k, down 27.5k.
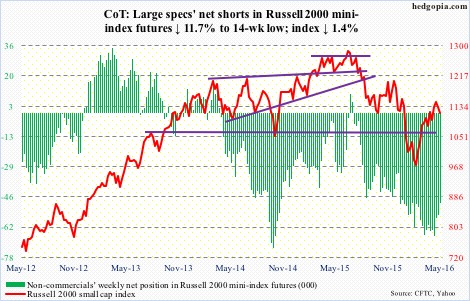
Russell 2000 mini-index: During the January collapse in U.S. stocks, the Russell 2000 fell out of a rising trend line drawn from March 2009. After a February hammer reversal, March and April were positive months, with the April high kissing the belly of that trend line but getting rejected.
In the meantime, the index this week lost dual support at 1120-ish – horizontal line going back to September 2013 as well as two-month channel. The $686 million that came out of IWM, the iShares Russell 2000 ETF, in the week ended Wednesday probably played a role in this.
Resistance working and support failing, that is not a good combo.
The index is currently trapped between 50- and 200-day moving averages, with the former about to go flat and the latter declining. There is decent support at 1080. On Friday, it dropped to 1101.57 before reversing.
Currently net short 49k, down 6.5k.
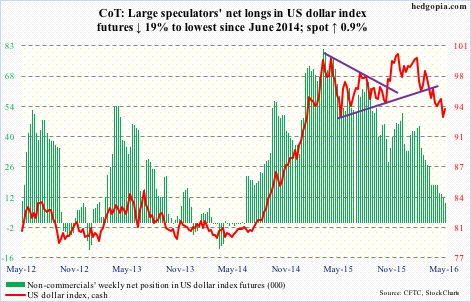
US Dollar Index: Just when it looked like the dollar index was breaking down came a weekly hammer reversal candle. The week started with Monday continuing to extend last week’s breakdown, only to see a major Tuesday reversal. With rally the next three sessions, it is back above 93.50, which was lost last week.
If this week’s action is a precursor to an imminent rally, there is a lot of repair work that needs to be done. The 50-day moving average is still dropping. Shorter-term moving averages can at least begin to go flat, unless the dollar index comes under renewed pressure.
Non-commercials continue to cut back net longs, which are now the lowest since June 2014.
Currently net long 9.2k, down 2.2k.
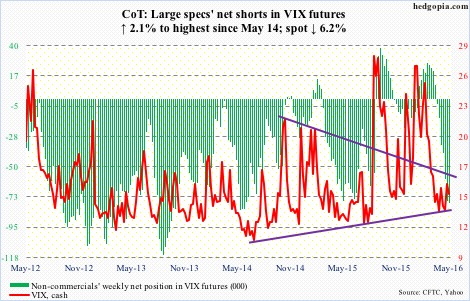
VIX: The good: there is a 10/20 crossover (moving average) on spot VIX, with plenty of room to run on a weekly chart. The bad: daily indicators are now overbought. And the ugly: it is struggling to stay above its 50-day moving average, with 16-16.50 acting as a ceiling. On Friday, that resistance was in play again, with the spot unable to save the 50-day.
The VIX-to-VXV ratio fell back to low 0.80s after a mid-0.80s reading last week. With this, in seven of the last eight weeks, the ratio has been in high 0.70s to low 0.80s. Compressed spring!
Currently net short 77.4k, up 1.6k.
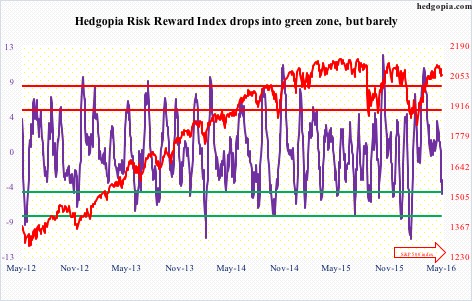
Hedgopia Risk Reward Index
http://www.hedgopia.com/cot-peek-into-future-through-futures-42/
• DiscoverGold.
Click on "In reply to", for Authors past commentaries.
* May 7, 2016
The following are futures positions of non-commercials as of May 3, 2016. Change is week-over-week.
E-mini S&P 500: It took 13 sessions for the S&P 500 index to travel from the upper Bollinger Band to the lower bound, giving back 3.4 percent in the process.
This is also a spot where the bulls needed to put their foot down. The 50-day moving average approximates the lower Bollinger Band. The last time the average was tested from above was right before the collapse in stocks in late December last year. A failure to save it would be a big tell – that selling is accelerating. On Friday, it was breached intra-day, but closed above.
Outflows accelerated this week. In the week ended Wednesday, a whopping $11.2 billion left U.S.-based equity funds (courtesy of Lipper). This was the largest weekly withdrawal since the week ended January 6th ($12 billion). Since February 10th, nearly $28 billion has now been redeemed. Money is leaving, taking advantage of the rally.
Ditto with SPY, the SPDR S&P 500 ETF. In the week ended Wednesday, all five sessions witnessed outflows, totaling $6.4 billion (courtesy of ETF.com).
This is precisely not what the bulls were hoping to see. Momentum is at risk of slowing down/reversing, and if weekly indicators take over, there is plenty of unwinding left of overbought conditions.
Currently net long 10.1k, up 8.6k.

Nasdaq 100 index (mini): Apple (AAPL) is teetering on the brink of a make-or-break level. Good luck to QQQ, the PowerShares Nasdaq 100 ETF, investors if the stock breaks 92. This support goes back to June 2014, or even September 2012. AAPL makes up 11.7 percent of the ETF.
Last week, the Nasdaq 100 lost both its 50- and 200-day moving averages, and sat on crucial support at 4350. This week, it lost the latter support, although Friday saw quite an intra-day reversal.
On a daily basis, technicals are oversold. Should a rally ensue near term, 4414 is where both 50- and 200-day averages converge. That said, it is a tough road ahead should weekly indicators take over.
Particularly so if flows do not cooperate. In the week ended Wednesday, a hefty $2.5 billion came out of QQQ, following $97 million in inflows in the prior week.
Currently net long 9.3k, down 27.5k.

Russell 2000 mini-index: During the January collapse in U.S. stocks, the Russell 2000 fell out of a rising trend line drawn from March 2009. After a February hammer reversal, March and April were positive months, with the April high kissing the belly of that trend line but getting rejected.
In the meantime, the index this week lost dual support at 1120-ish – horizontal line going back to September 2013 as well as two-month channel. The $686 million that came out of IWM, the iShares Russell 2000 ETF, in the week ended Wednesday probably played a role in this.
Resistance working and support failing, that is not a good combo.
The index is currently trapped between 50- and 200-day moving averages, with the former about to go flat and the latter declining. There is decent support at 1080. On Friday, it dropped to 1101.57 before reversing.
Currently net short 49k, down 6.5k.

US Dollar Index: Just when it looked like the dollar index was breaking down came a weekly hammer reversal candle. The week started with Monday continuing to extend last week’s breakdown, only to see a major Tuesday reversal. With rally the next three sessions, it is back above 93.50, which was lost last week.
If this week’s action is a precursor to an imminent rally, there is a lot of repair work that needs to be done. The 50-day moving average is still dropping. Shorter-term moving averages can at least begin to go flat, unless the dollar index comes under renewed pressure.
Non-commercials continue to cut back net longs, which are now the lowest since June 2014.
Currently net long 9.2k, down 2.2k.

VIX: The good: there is a 10/20 crossover (moving average) on spot VIX, with plenty of room to run on a weekly chart. The bad: daily indicators are now overbought. And the ugly: it is struggling to stay above its 50-day moving average, with 16-16.50 acting as a ceiling. On Friday, that resistance was in play again, with the spot unable to save the 50-day.
The VIX-to-VXV ratio fell back to low 0.80s after a mid-0.80s reading last week. With this, in seven of the last eight weeks, the ratio has been in high 0.70s to low 0.80s. Compressed spring!
Currently net short 77.4k, up 1.6k.

Hedgopia Risk Reward Index

http://www.hedgopia.com/cot-peek-into-future-through-futures-42/
• DiscoverGold.
Click on "In reply to", for Authors past commentaries.
Information posted to this board is not meant to suggest any specific action, but to point out the technical signs that can help our readers make their own specific decisions. Your Due Dilegence is a must!
• DiscoverGold


