 News
News  Market Data
  Discover
Support: 888-992-3836
Copyright © 2023 InvestorsHub Inc.


Register for free to join our community of investors and share your ideas. You will also get access to streaming quotes, interactive charts, trades, portfolio, live options flow and more tools.
$SPY & $IWM Millions worth of puts suddenly just hit the tape
By: Cheddar Flow | June 6, 2024
• $SPY & $IWM Millions worth of puts suddenly just hit the tape

Read Full Story »»»
 DiscoverGold
The 10 Top/Bottom S&P 500 Index percent net change performers
By: Thom Hartle | June 6, 2024
• Today (8:34 CST), the 10 top/bottom percent net change performers in the S&P 500 Index.

Read Full Story »»»
DiscoverGold
The Nasdaq closed at a record high. But there were fewer stocks on that exchange rising to 52-week highs than falling to 52-week lows
By: Jason Goepfert | June 5, 2024
• The Nasdaq closed at a record high.
But there were fewer stocks on that exchange rising to 52-week highs than falling to 52-week lows.
This has not happened many times. The handful of times it did were...well.

Read Full Story »»»
DiscoverGold
The S&P 500 is currently in a bullish overbought condition, with potential upside to the 5600 and 6150 levels
By: Isabelnet | June 6, 2024
• S&P 500
The Williams %R can provide valuable insights into market momentum. The S&P 500 is currently in a bullish overbought condition, with potential upside to the 5600 and 6150 levels.

Read Full Story »»»
DiscoverGold
The AAII Investor Sentiment
By: AAII | June 6, 2024
Bullish 39.0%
Neutral 29.0%
Bearish 32.0%
• Historical 1-Year High
Bullish: 52.9%
Neutral: 36.4%
Bearish: 50.3%
Read Full Story »»»
DiscoverGold
Money managers Reduced their exposure to the US Equity markets since last week...
DiscoverGold
NAAIM Exposure Index
June 6, 2024 
The NAAIM Number
68.65
Last Quarter Average
84.57
»»» Read More…
$SPX we remain Bullish contingent on the index holding above the colored warning levels and especially last Friday’s low!
By: Intelligent Investing | June 5, 2024
• Last Friday, May 31, we showed our premium major markets members that our preferred view was for a (green) W-4. See chart 1
On Monday, June 3, we followed up with price target projections for the W-5’s sub-waves. See chart 2
Today, June 5, the subwaves continue to fill in reasonably well and we remain Bullish contingent on the index holding above the colored warning levels and especially last Friday’s low! See chart 3


Read Full Story »»»
DiscoverGold
$SPX $SPY - Negating the 'Diamond'. Tho in a 'Sideways Range' (Shaded)
By: Sahara | June 5, 2024
• $SPX $SPY - Latest
Negating the 'Diamond'. Tho in a 'Sideways Range' (Shaded).
May want to pump to the Uppr 'Broadening' Line for a tap of the final target from early Mays 'Broadenings' B/Out.
Outlander, if it pops the 5440 Level then it could be in melt-up-mode...

Read Full Story »»»
DiscoverGold
$QQQ $3+ Million OTM Put (Highly Unusual) This order expires in 2 days so the trader is betting on quick downside
By: Cheddar Flow | June 5, 2024
• $QQQ $3M+ OTM Put (Highly Unusual)
This order expires in 2 days so the trader is betting on quick downside

Read Full Story »»»
DiscoverGold
S&P 500 Index (SPX): Summary Analysis
By: Marty Armstrong | June 5, 2024
S&P 500 Cash Index closed today at 529134 and is trading up about 10% for the year from last year's settlement of 476983. Presently, this market has been declining for going into 2024 reflecting that this has been only still a bearish reactionary trend. As we stand right now, this market has made a new high exceeding the previous year's high reaching thus far 534188 while it is still trading above last year's high of 479330.
MARKET OVERVIEW
NEAR-TERM OUTLOOK
The S&P 500 Cash Index has continued to make new historical highs over the course of the rally from 1974 moving into 2024. We have elected two Bullish Reversals to date.
This market remains in a positive position on the weekly to yearly levels of our indicating models. Pay attention to the Monthly level for any serious change in long-term trend ahead.
Focusing on our perspective using the indicating ranges on the Daily level in the S&P 500 Cash Index, this market remains moderately bullish currently with underlying support beginning at 528227 and overhead resistance forming above at 534188. The market is trading closer to the support level at this time.
On the weekly level, the last important high was established the week of May 20th at 534188, which was up 30 weeks from the low made back during the week of October 23rd. We have seen the market rally for the past week from the low of the week of May 27th, which has been a move of 2.392 percent. When we look deeply into the underlying tone of this immediate market, we see it is cautiously starting to strengthen since the previous low at 410378 made 31 weeks. Immediately, this decline from the last high established the week of May 20th has been important Before, this recent rally exceeded the previous high of 526485 made back during the week of March 25th. That high was likewise part of a bullish trend making higher highs over the week of December 25th. This immediate decline has thus far held the previous low formed at 410378 made the week of October 23rd. Only a break of that low would signal a technical reversal of fortune and of course we must watch the Bearish Reversals.
Right now, the market is above momentum on our weekly models hinting this is still bullish for now as well as trend, long-term trend. Looking at this from a wider perspective, this market has been trading up for the past 6 weeks overall.
INTERMEDIATE-TERM OUTLOOK
Interestingly, the S&P 500 Cash Index has been in a bullish phase for the past 14 months since the low established back in March 2023.
Critical support still underlies this market at 468200 and a break of that level on a monthly closing basis would warn that a sustainable decline ahead becomes possible. Immediately, the market is trading within last month's trading range in a neutral position.
DiscoverGold
While bearish engulfing patterns suggest a possible reversal in the S&P 500, the index could still have a summer rally as part of the ongoing secular bull market within the presidential cycle
By: Isabelnet | June 5, 2024
• S&P 500
While bearish engulfing patterns suggest a possible reversal in the S&P 500, the index could still have a summer rally as part of the ongoing secular bull market within the presidential cycle.

Read Full Story »»»
DiscoverGold
When you buy $10,000 of the S&P 500 $SPY here's how much of the largest stocks you're buying
By: Evan | June 5, 2024
• When you buy $10,000 of the S&P 500 $SPY here's how much of the largest stocks you're buying
$691 of Microsoft $MSFT
$639 of Nvidia $NVDA
$634 of Apple $AAPL
$424 of Google $GOOGL
$367 of Amazon $AMZN
$236 of Facebook $META
$170 of Berkshire Hathaway $BRK.B
$149 of Eli Lilly $LLY
$131 of JPMorgan $JPM
$6,559 of everything else

Read Full Story »»»
DiscoverGold
Bullish tech flow is flooding the tape this morning
By: Cheddar Flow | June 5, 2024
• Bullish tech flow is flooding the tape this morning
This picture is only filtered for > $1M orders and there isn't a bear in sight

Read Full Story »»»
DiscoverGold
Back-To-Back Hanging Man Forms On S&P 500, But Pattern Needs Confirmation
By: Hedgopia | June 4, 2024
Both Monday and last Friday, VIX failed to keep most of its gains. Amidst this, there is strong support at 11-12, and a 10- and 20-day crossover seems imminent. Concurrently, the S&P 500 formed back-to-back hanging man, which is bearish but needs confirmation.

Yet again, volatility bulls were unable to hang on to most of Monday’s gains. VIX rallied as high as 14.31 intraday but only to end the session at 13.11, up 0.19 points. This follows last Friday’s reversal with an intraday high of 14.87 and a close of 12.92; this was the second consecutive session of failure at the 200-day moving average (14.69), coming on the heels of Thursday’s intraday high of 14.88 and a close of 14.47. In the end, last week ended with a shooting star (Chart 1).
The volatility index acts like it wants lower prints.
That said, a couple of things need consideration. (1) Going back six years, volatility bulls have repeatedly defended 12. And (2) a crossover between the 10- and 20-day is in the making; should it complete, this should bode well for volatility.

This would have come at a time when equity bulls aggressively bought intraday weakness in two consecutive sessions. Monday, the S&P 500 tagged 5234 intraday and finished the session at 5283. Last Friday, the large cap index dropped all the way to 5192, with the 50-day now at 5182, before reversing higher to close at 5278. Horizontal support at 5260s were breached intraday in both sessions but not by close. As a result, a hanging man, which looks identical to a hammer, formed in both these sessions.
This candle, which shows up in an uptrend, needs confirmation. Friday’s hanging man would have been confirmed on Monday had the session ended near the lows; instead, another hanging man formed. How the index behaves for the rest of the week has now become important.
With only one session this week, a hanging man has also formed on the weekly. This follows last week’s hanging man and a long-legged doji before that. These candles appeared after the S&P 500 experienced a massive intraday reversal on May 23rd when in a bearish engulfing session it reached a new high of 5342 but reversed to close at 5268 (Chart 2).
As things stand, bulls have an opportunity to put their foot down with a breakout of short-term trendline resistance and then charge toward short-term lateral resistance at 5320s. Inability to do so would enhance the odds that the back-to-back hanging man gets confirmed in due course.
Read Full Story »»»
DiscoverGold
The 10 Top/Bottom NASDAQ 100 Index percent net change performers
By: Thom Hartle | June 5, 2024
• Today (8:33 CST), the 10 top/bottom percent net change performers in the NASDAQ 100 Index.

Read Full Story »»»
DiscoverGold
Will $SPY break above 540 by Jun 14th close? Look at that 535 call bought on May 29th, very similar to the 509 call that was bought on april 22 before last fomc. After the last fomc that 509 call went in the money by 10 points. We have fed meeting next week!
By: Tradenometry | June 4, 2024
• Will $SPY break above 540 by Jun 14th close? Look at that 535 call bought on May 29th, very similar to the 509 call that was bought on april 22 before last fomc. After the last fomc that 509 call went in the money by 10 points. We have fed meeting next week!

Read Full Story »»»
DiscoverGold
Bulls smile when the S&P 500 index has gained more than 10% after the first five months of the year, as the average return for the rest of the year has been 8.8% since 1950
By: Isabelnet | June 4, 2024
• S&P 500
Bulls smile when the S&P 500 index has gained more than 10% after the first five months of the year, as the average return for the rest of the year has been 8.8% since 1950.

Read Full Story »»»
DiscoverGold
S&P 500: The US stock market remains overbought, with a reading of 86.70, sparking concerns among some investors about a potential correction in the near future
By: Isabelnet | June 4, 2024
• S&P 500
The US stock market remains overbought, with a reading of 86.70, sparking concerns among some investors about a potential correction in the near future.

Read Full Story »»»
DiscoverGold
The 10 Top/Bottom S&P 500 Index percent net change performers
By: Thom Hartle | June 4, 2024
• Today (8:34 CST), the 10 top/bottom percent net change performers in the S&P 500 Index.

Read Full Story »»»
DiscoverGold
The 10 Top/Bottom NASDAQ 100 Index percent net change performers
By: Thom Hartle | June 4, 2024
• Today (8:34 CST), the 10 top/bottom percent net change performers in the NASDAQ 100 Index.

Read Full Story »»»
DiscoverGold
Markets Monthly Pattern »» Watchlist - Top 10
By: Marty Armstrong | June 4, 2024
• Dow Jones Industrials Index »» Under Pressure
• NASDAQ Composite Index »» Possible High Close
• NASDAQ 100 Index »» Possible High Close
• S&P 500 Index »» Possible High Close
• Russell 2000 Index »» Preparing to Rally
• US Dollar Index »» Reaction Low
• CBOE VIX Index »» WARNING PREPARING TO RALLY
• NY Gold Futures »» New Pattern Forming
• NY Silver COMEX Futures »» New Pattern Forming
• NY Crude Oil Futures »» Moving Lower Maybe Low Close
DiscoverGold
25 Best Performing S&P 500 Index (SPX) stocks to own in June, finishing the month higher eight times out of 10 over the past decade with an average 12.1% return
By: Schaeffer's Investment Research | June 3, 2024

Read Full Story »»»
DiscoverGold
$SPY Woah. Huge $4.7 Million OTM Call Order...
By: Cheddar Flow | June 3, 2024
• $SPY Woah. Huge $4.7M OTM Call Order
This whale bought 16,258 contracts and executed the transaction above the ask
There's only 3 weeks until expiration, so they are betting on a large move

Read Full Story »»»
DiscoverGold
Sentiment: The Market Greed/Fear Index, currently at 76.33, indicates optimistic investor sentiment in the US stock market, characteristic of a greedy market
By: Isabelnet | June 3, 2024
• Sentiment
The Market Greed/Fear Index, currently at 76.33, indicates optimistic investor sentiment in the US stock market, characteristic of a greedy market.

Read Full Story »»»
DiscoverGold
Despite the rising median short interest in the S&P 500, it remains relatively low, suggesting that market participants are positive or cautiously optimistic about the future performance of the stock market
By: Isabelnet | June 3, 2024
• S&P 500
Despite the rising median short interest in the S&P 500, it remains relatively low, suggesting that market participants are positive or cautiously optimistic about the future performance of the stock market.

Read Full Story »»»
DiscoverGold
Worst Stock on the S&P 500 Index (SPX) to own in June, looking back over the past 10 years
By: Schaeffer's Investment Research | June 3, 2024
• According to data from Schaeffer's Senior Quantitative Analyst Rocky White, Wynn Resorts is the third worst stock on the S&P 500 Index (SPX) to own in June, looking back over the past 10 years. The shares averaged a loss of 3.1% for the month over the last decade, and finished the month lower seven times.

Read Full Story »»»
DiscoverGold
$SPX $SPY - 'Diamond' B/Test...
By: Sahara | June 3, 2024
• $SPX $SPY - 'Diamond' B/Test...

Read Full Story »»»
DiscoverGold
Corporate Insiders are once again dumping heavily after the earnings blackout period ended
By: Barchart | June 2, 2024
• Corporate Insiders are once again dumping heavily after the earnings blackout period ended.

Read Full Story »»»
DiscoverGold
Buyers have ATTACKED $SPY when 50% or more of the index makes new 14-day lows...
By: TrendSpider | June 2, 2024
• Buyers have ATTACKED $SPY when 50% or more of the index makes new 14-day lows...
Alert is set for next time it occurs.

Read Full Story »»»
DiscoverGold
Carl Futia: June S&P E-mini futures
By: Carl Futia | June 1, 2024
• June S&P E-mini futures: Inflation is coming down and the Fed is unlikely to tighten any more. My long-standing 5400 target has nearly been reached but may well prove too conservative. The 6000 level seems a better bet by the end of the year.
QQQ: Support is now 445. Next resistance is 466.
TNX (ten year note yield): The 3.75% level is support. A swing up to 5.50% is underway.
Euro-US Dollar: The Euro is likely to drop to support at 100. Meantime resistance is 112.
Bitcoin: Support is at 56,000. Next upside target is 81,000.
West Texas Crude Oil: Upside target is 90. Support is 72.
Gold: Next upside target is 2500. Support is 2250.
Apple: Next upside target past 200 is 250. Support is 165.
Amazon: Upside target at 175 has been reached. Support now is 145 and next upside target is 205.
Google: Upside target is now 200. Support is 160.
Microsoft: Support is 375 and the next upside target is 500.
Meta: Upside target is now 725. Support now is 500.
Netflix: Upside target is 710. Support now is 450.
Nvidia: Upside target now 1450. Support is 1000.
Tesla: Downside target at 144-150 has been reached. Resistance above the market is 200.
Visa: Upside target at 285 has been reached. Support now is 250.
Read Full Story »»»
DiscoverGold
2024 Market Breadth Life Hack:
By: TrendSpider | June 2, 2024
• 2024 Market Breadth Life Hack:
~63% of $SPX above 200 day SMA = risk on
~80% of $SPX above 200 day SMA = risk off

Read Full Story »»»
DiscoverGold
For the second time in a year, the percentage of S&P 500 stocks outperforming the S&P 500 index fell to 25%
By: Dean Christians | June 1, 2024
• For the second time in a year, the percentage of S&P 500 stocks outperforming the S&P 500 index fell to 25%.
Recent precedents have occurred within the context of a dominant sector theme.
Recognizing how this influences market analysis is critical.

Read Full Story »»»
DiscoverGold
The Most Oversold Stocks this Week in the S&P 500
By: Barchart | June 1, 2024
• Salesforce $CRM is the most oversold stock in the S&P 500

Read Full Story »»»
DiscoverGold
CoT: Peek Into Future Through Futures, How Hedge Funds Are Positioned
By: Hedgopia | June 1, 2024
• Following futures positions of non-commercials are as of May 28, 2024.
E-mini S&P 500: Currently net short 2.2k, down 20.6k.

In a holiday-shortened week, equity bears prevailed in the first three sessions, while bulls came roaring back on Friday. The latter’s effort was still not enough to stem a 0.5-percent drop for the week – a first down week in six.
Nevertheless, bulls should be more than happy how the week turned out, as at Friday’s low the S&P 500 was down as much as 2.1 percent for the week; the session low of 5192 came just above the 50-day at 5181, closing the week out at 5278, thanks to a 44-point surge in the last 25 minutes Friday.
Friday’s impressive reversal helped form a potential hanging man on the weekly, which follows last week’s long-legged doji. Overall action has been tentative the last three weeks, with a new intraday high of 5342 coming in a bearish engulfing session on May 23rd (more on this here).
Bulls are holding on to the momentum ball but their grip is at risk of slipping away.
Nasdaq (mini): Currently net short 3.7k, up 8.4k.

After seven weeks of staying net long Nasdaq (mini) futures, non-commercials switched to net short this week.
The Nasdaq 100 at one point on Friday was down as much as 3.3 percent for the week but recovered to end down only 1.4 percent. This is the first negative week in six. Tech bulls showed up in that session 100 points above the 50-day (18090); horizontal support at 18300s, which goes back three months, was breached intraday but saved by close (18537).
This week’s rather wild action came after a new high of 18908 was hit on May 23rd but only to end the session with a bearish engulfing candle.
On the downside, the first line of support lies at 18300s.
Russell 2000 mini-index: Currently net short 33.8k, down 3.7k.

The Russell 2000 remains trapped between 2000 and 2100. This week, with a high of 2086 and a low of 2036, the small cap index was essentially unchanged – up 0.02 percent – at 2070.
The index has traded above 2000 since early last month, while 2100 has stood like a mountain since early March. Here is why 2100 is significant.
The Russell 2000 peaked in November 2021 at 2459, subsequently reaching 1641 in June 2022, which was successfully tested in October of both 2022 and 2023. A 61.8-percent Fibonacci retracement of that drop tallies to 2144. The index lost 2100 in January 2022 and has since struggled at that price point; 2100 also represents a measured-move price target post-breakout at 1900 last December. Before that, the index went back and forth between 1700 and 1900 going back to January 2022.
Repeated failure at 2100 suggests the path of least resistance is toward 2000 at best and 1900 at worse.
US Dollar Index: Currently net long 4.2k, up 656.

Yet again, a rising trendline from last December when the US dollar index bottomed at 100.32 drew bids, but nothing much came out of it. This week, the index finished unchanged – down 0.01 percent – to 104.63.
Tuesday’s low of 104.26 also successfully tested the 200-day (104.27), which was again visited on Friday. That said, dollar bulls’ attempt at the 50-day (104.95) was rejected both Thursday and Friday.
Horizontal support at 103-104 goes back to December 2016. A likely breach ahead of the December trendline should swing near-term odds to dollar bears’ favor.
VIX: Currently net short 42.7k, down 8.6k.

VIX added 0.99 points this week to 12.92 but failed to keep most of its gains. Thursday, the volatility index ticked 14.88, followed by Friday’s 14.87; in both those sessions, the 200-day (14.71) was reclaimed intraday but lost by close. In the end, a shooting star formed on the weekly.
Going back six years, volatility bulls have repeatedly defended 12. The streak likely continues. That said, the daily likely comes under pressure in the sessions ahead. On May 23rd, VIX reversed higher from a low of 11.52 to close at 12.77.
Read Full Story »»»
DiscoverGold
S&P 500 Index (SPX) »» Weekly Summary Analysis
By: Marty Armstrong | June 1, 2024
S&P 500 Cash Index closed today at 527751 and is trading up about 10% for the year from last year's settlement of 476983. Immediately, this market has been rising for 7 months going into June suggesting that this has been a bull market trend on the monthly time level which has been confirmed by electing all of our model's long-term Bullish Reversals from the key low.
ECONOMIC CONFIDENCE MODEL CORRELATION
Here in S&P 500 Cash Index, we do find that this particular market has correlated with our Economic Confidence Model in the past. The Last turning point on the ECM cycle low to line up with this market was 2009 and 2002. The Last turning point on the ECM cycle high to line up with this market was 2022 and 2007 and 2000.
MARKET OVERVIEW
NEAR-TERM OUTLOOK
The S&P 500 Cash Index has continued to make new historical highs over the course of the rally from 1974 moving into 2024. Clearly, we have elected two Bullish Reversals to date.
This market remains in a positive position on the weekly to yearly levels of our indicating models. Pay attention to the Monthly level for any serious change in long-term trend ahead.
Looking at the indicating ranges on the Daily level in the S&P 500 Cash Index, this market remains moderately bullish currently with underlying support beginning at 521530 and overhead resistance forming above at 529787. The market is trading closer to the resistance level at this time.
On the weekly level, the last important high was established the week of May 20th at 534188, which was up 30 weeks from the low made back during the week of October 23rd. We have seen the market drop sharply for the past week penetrating the previous week's low and it closed lower. We are still trading above the Weekly Momentum Indicators so we have not undermined critical support as of yet. When we look deeply into the underlying tone of this immediate market, we see it is cautiously starting to strengthen since the previous low at 410378 made 31 weeks. Immediately, this decline from the last high established the week of May 20th has been important Before, this recent rally exceeded the previous high of 526485 made back during the week of March 25th. That high was likewise part of a bullish trend making higher highs over the week of December 25th. This immediate decline has thus far held the previous low formed at 410378 made the week of October 23rd. Only a break of that low would signal a technical reversal of fortune and of course we must watch the Bearish Reversals.
Right now, the market is above momentum on our weekly models hinting this is still bullish for now as well as trend, long-term trend. Looking at this from a wider perspective, this market has been trading up for the past 6 weeks overall.
INTERMEDIATE-TERM OUTLOOK
YEARLY MOMENTUM MODEL INDICATOR
Our Momentum Models are rising at this time with the previous low made 2022 while the last high formed on 2023. However, this market has rallied in price with the last cyclical high formed on 2022 warning that this market remains strong at this time on a correlation perspective as it has moved higher with the Momentum Model.
Interestingly, the S&P 500 Cash Index has been in a bullish phase for the past 14 months since the low established back in March 2023.
Critical support still underlies this market at 468200 and a break of that level on a monthly closing basis would warn that a sustainable decline ahead becomes possible. Immediately, the market is trading within last month's trading range in a neutral position.
DiscoverGold
Nasdaq Composite Index (COMP) »» Weekly Summary Analysis
By: Marty Armstrong | June 1, 2024
NASDAQ Composite Index Cash closed today at 1673502 and is trading up about 11% for the year from last year's settlement of 1501135. Up to now, this market has been rising for 7 months going into June suggesting that this has been a bull market trend on the monthly time level which has been confirmed by electing all of our model's long-term Bullish Reversals from the key low.
ECONOMIC CONFIDENCE MODEL CORRELATION
Here in NASDAQ Composite Index Cash, we do find that this particular market has correlated with our Economic Confidence Model in the past. The Last turning point on the ECM cycle low to line up with this market was 2022 and 2009 and 2002. The Last turning point on the ECM cycle high to line up with this market was 2007 and 2000.
MARKET OVERVIEW
NEAR-TERM OUTLOOK
The NASDAQ Composite Index Cash has continued to make new historical highs over the course of the rally from 2009 moving into 2024. Distinctly, we have elected four Bullish Reversals to date.
This market remains in a positive position on the weekly to yearly levels of our indicating models. Pay attention to the Monthly level for any serious change in long-term trend ahead.
Looking at the indicating ranges on the Daily level in the NASDAQ Composite Index Cash, this market remains neutral with resistance standing at 1683902 and support forming below at 1671997. The market is trading closer to the support level at this time. An opening below this level in the next session will imply a decline is unfolding.
On the weekly level, the last important high was established the week of May 27th at 1703266, which was up 31 weeks from the low made back during the week of October 23rd. So far, this week is trading within last week's range of 1703266 to 1644554. Nevertheless, the market is still trading downward more toward support than resistance. A closing beneath last week's low would be a technical signal for a correction to retest support.
When we look deeply into the underlying tone of this immediate market, we see it is currently still in a semi neutral posture despite declining from the previous high at 1703266 made 0 week ago. Still, this market is within our trading envelope which spans between 1485137 and 1766233. This market has made a new historical high this past week reaching 1703266. Here the market is trading weak gravitating more toward support than resistance. We have technical support lying at 1652810 which we are still currently trading above for now.
Right now, the market is above momentum on our weekly models hinting this is still bullish for now as well as trend, long-term trend. Looking at this from a wider perspective, this market has been trading up for the past 6 weeks overall.
INTERMEDIATE-TERM OUTLOOK
YEARLY MOMENTUM MODEL INDICATOR
Our Momentum Models are rising at this time with the previous low made 2022 while the last high formed on 2023. However, this market has rallied in price with the last cyclical high formed on 2021 warning that this market remains strong at this time on a correlation perspective as it has moved higher with the Momentum Model.
Interestingly, the NASDAQ Composite Index Cash has been in a bullish phase for the past 14 months since the low established back in March 2023.
Critical support still underlies this market at 1520870 and a break of that level on a monthly closing basis would warn that a sustainable decline ahead becomes possible. Immediately, the market is trading within last month's trading range in a neutral position.
DiscoverGold
Markets Monthly Pattern »» Watchlist - Top 10
By: Marty Armstrong | June 1, 2024
• Dow Jones Industrials Index »» Temp High
• NASDAQ Composite Index »» Still Pushing Higher
• NASDAQ 100 Index »» Still Pushing Higher
• S&P 500 Index »» Turning Back UP
• Russell 2000 Index »» New Pattern Forming
• US Dollar Index »» Temp Pause
• CBOE VIX Index »» New Pattern Forming
• NY Gold Futures »» Pressing Higher in topping Patern
• NY Silver COMEX Futures »» New Pattern Forming
• NY Crude Oil Futures »» Turning BACK DOWN
DiscoverGold
$SPX Leaving you all with this chart for the weekend: was today’s low all of the green W-4 (in black circle)?!
By: Intelligent Investing | May 31, 2024
• $SPX
Leaving you all with this chart for the weekend: was today’s low all of the green W-4 (in black circle)?!

Read Full Story »»»
DiscoverGold
$SPX $SPY - 'Diamond' Targets Hit
By: Sahara | May 31, 2024
• $SPX $SPY - 'Diamond' Targets Hit.
Also another three of the targets from that Bear 'Wedge' (Red) have been hit...

Read Full Story »»»
DiscoverGold
June Better in Election Years: Average Gains Range from 0.9% DJIA to 1.9% NASDAQ
By: Almanac Trader | May 31, 2024

Over the last twenty-one years, the month of June has been a rather lackluster month for the market. DJIA, S&P 500 and Russell 1000 have all recorded average losses in the month. NASDAQ and Russell 2000 have fared better logging average gains of 0.4% and 0.8% respectively. Historically the month has opened respectably, advancing on the first and second trading days. From there the market then drifted sideways and lower near or into negative territory just ahead of mid-month. From there the market rallied to create a mid-month bump that quickly evaporated and returned to losses. The brisk, post, mid-month drop is typically followed by a month end rally led by technology and small caps.
In election years since 1950, June has followed a similar pattern to the recent 21-year period, but gains have been notably stronger, and all five indexes finish the month positive. Average June gains in election years range from 0.9% by DJIA to 1.9% by NASDAQ.
Read Full Story »»»
DiscoverGold
$SPXW $45 Million worth of put sell orders (STO)...
By: Cheddar Flow | May 31, 2024
• $SPXW $45M worth of put sell orders (STO)
These traders are capitalizing on the sudden heightened IV of puts and expect the market to stay around here or bounce
Tons of bullish prints amidst the dip so far today

Read Full Story »»»
DiscoverGold
$SPY $5 Million OTM Calls (aggressive)
By: Cheddar Flow | May 31, 2024
• $SPY $5M OTM Calls (aggressive)
A lot of call buying across the board yet most are underwater so far
Will they all be wrong or is this a dip-buying opportunity?

Read Full Story »»»
DiscoverGold
$SPX $Millions of Calls
By: Cheddar Flow | May 31, 2024
• $SPX The plunge protection team has entered the chat

Read Full Story »»»
DiscoverGold
$SPY $5+ Million ITM Puts Rolling In *Above the Ask*
By: Cheddar Flow | May 31, 2024
• $SPY $5M+ ITM Puts Rolling In
*Above the Ask*

Read Full Story »»»
DiscoverGold
The 10 Top/Bottom S&P 500 Index percent net change performers
By: Thom Hartle | May 31, 2024
• Today (8:33 CST), the 10 top/bottom percent net change performers in the S&P 500 Index.

Read Full Story »»»
DiscoverGold
The 10 Top/Bottom NASDAQ 100 Index percent net change performers
By: Thom Hartle | May 31, 2024
• Today (8:33 CST), the 10 top/bottom percent net change performers in the NASDAQ 100 Index.

Read Full Story »»»
DiscoverGold
When ~50% of stocks in the S&P 500 make new 14-day lows, its been a solid dip to buy for over a year
By: TrendSpider | May 30, 2024
• When ~50% of stocks in the S&P 500 make new 14-day lows, its been a solid dip to buy for over a year. $SPY
Will history repeat?

Read Full Story »»»
DiscoverGold
For only the 9th time since 1966, the percentage of S&P 500 equal-weighted sectors with a positive relative trend score versus the S&P 500 declined to 0%
By: Dean Christians | May 29, 2024
• For only the 9th time since 1966, the percentage of S&P 500 equal-weighted sectors with a positive relative trend score versus the S&P 500 declined to 0%.
Many believe that narrow leadership signals bearish outcomes, yet history contradicts this view.

Read Full Story »»»
DiscoverGold
One Bullish Omen for the NASDAQ Just Fired
By: Lucas Downey | May 30, 2024
Stock investing is simple.
Just hold great companies.
But it can get simpler when broad indices find a tailwind.
That’s the situation today. One bullish omen for the NASDAQ just fired.
Data has a way of cutting through the non-stop noise. As institutions buy and sell there are repeatable patterns that offer clues as to what’s ahead.
Just yesterday, we saw the most stock selling since the October lows. Risk-off was widespread.
On the surface, this new information could suggest trouble is ahead for markets.
But we don’t see it that way. Turns out, one bigger theme occurring over the past few weeks, suggests this near-term dip is about to turn into a rip… that you’ll want to buy.
Before we get into that powerful study, let’s put on our Big Money goggles and review the money flow landscape.
Institutions Dump the Most Stocks in 2024
If your portfolio is sagging lately, you’re not alone. While markets trade near all-time highs, plenty of single names are getting trimmed.
You can see this with the latest downtick in the Big Money Index (BMI). As a reminder, if the BMI’s climb is stalled, there’s distribution under-the-surface.

Why this is important is because yesterday revealed the most institutional selling since the October 27th low.
Yesterday’s modest decline actually was a decent sell day in our data. There were 135 discrete equities that were sold, the highest level in 7 months.
Below tallies the daily buy and sell signals on thousands of stocks. Notice the large red bar off to the right.
That’s clearly risk-off action:

The million-dollar question is which stocks are getting sold? It’s actually a mixed bag of healthcare, discretionary, industrial, and technology names, mostly small-caps.
The tiny amount of green, or equities getting bought, are mega-cap technology names with a high index weighting.
This is mission critical because these global heavyweights have been responsible for kickstarting the monster rally back in October.
If you recall back in early November, we told you how Technology was set to explode in 2024. After an oversold BMI, the technology sector in particular averages a gain of 27% twelve months later.
Here’s the graphic from that piece. Tech didn’t disappoint given it’s rallied 36% since our rare oversold signal hit on October 6th:

Data really is beautiful!
But here’s the great news. This rally in tech is far from over because one bullish omen for the NASDAQ just fired.
You just need a map to see the opportunity.
One Bullish Omen for the NASDAQ Just Fired
Don’t leave investing to chance. There’s a rhythm in money flows.
The last couple of months saw a rapid decline in the Big Money Index (BMI). Long-term subscribers of MAPsignals know that we get more bullish as prices fall.
The old adage of buying low and selling high is paramount if you want to be a successful investor. We happen to use our trusty BMI as our guiding light.
Just a few weeks ago our data signaled how a major ultra-bullish signal is approaching. Effectively, when the BMI is in free-fall, it spells big gains ahead.
Back then we isolated all instances when the BMI fell 40 points in a 4-month timespan, similar action to what we saw in April. Here’s a review of what that looks like in practice.
We published this exact chart on May 2nd. An epic rapid decline in the BMI historically has been a great time to buy stocks:

You can review the study by clicking the link above. However, today we’re going to add to it.
Last week we noticed how the spiral in the BMI actually did something quite remarkable. It fell for 10 consecutive days.
Over the past decade since 2014, that’s only happened 188 times. A handful of memorable occurrences were in late 2014, early 2016, late 2018, the pandemic, and the bear market of 2022.
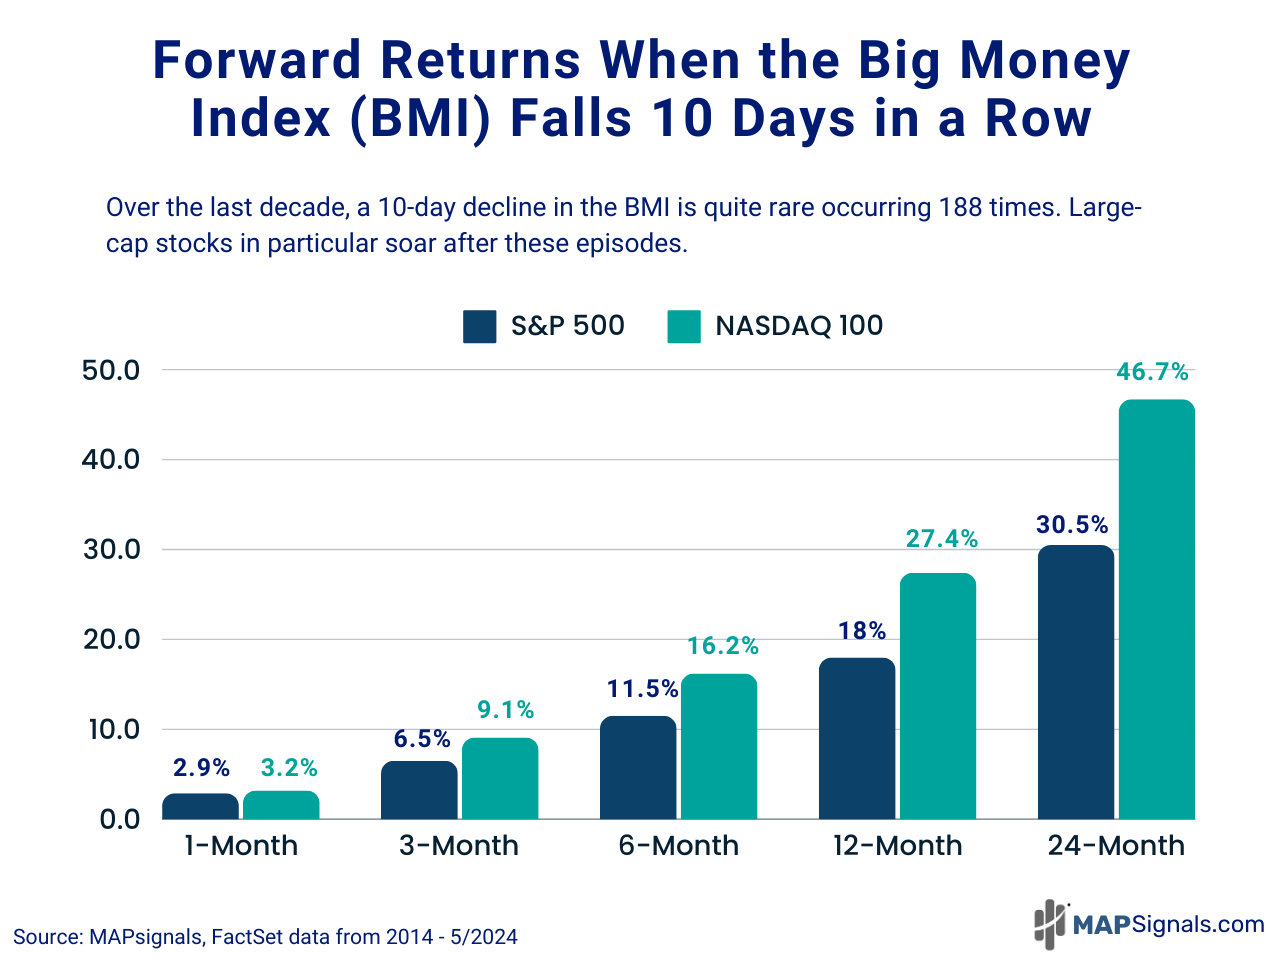
Ladies and gentlemen, these 10-day declines are some of the most bullish signals you’ll find. When I say one bullish omen for the NASDAQ just fired, you’ll agree after this chart!
When we singled out all days when the prior 10 days saw the BMI fall consecutively, large caps surged.
For comparison I included both the NASDAQ 100 and the S&P 500 forward performance post these rare events.
When the BMI falls 10 days consecutively:
• 3-months later the S&P 500 jumps 6.5% and the NASDAQ vaults 9.1%
• 12-months later SPX climbs 18% and the tech-heavy NASDAQ rips 27.4%
• Be bold and hold for 24-months and you’re staring at 30.5% gains for the S&P and a mind-numbing 46.7% catapult for the NASDAQ
Folks, this is what a tailwind looks like in data.
If history is any guide, the current rally has plenty more upside.
We took our cues to buy stocks back in October based on evidence-rich insights. We’ll be following that playbook again.
Knowing which specific equities to zero in on is paramount.
Let a map show you the path!
Here’s the bottom line: There’s notable selling in our data. In fact, yesterday saw the most stock selling since the market bottom in October.
That’s not the overwhelming signal to focus on.
The bigger story is what happened last month. The BMI fell 10 consecutive days, which has only occurred 188 times the last decade.
Turns out, it’s a long-term signal to buy large-cap stocks. Amazingly, the tech-heavy NASDAQ 100 soars 27% twelve months later.
Even more incredible, the NASDAQ rips an average of 46% twenty-four months post this signal!
Don’t miss the opportunity in front of you.
Investing in great companies is how you win over the long-run.
Investing alongside a massive tailwind makes it that much more enjoyable!
Read Full Story »»»
DiscoverGold
Money managers Remain Bullish with their exposure to the US Equity markets since last week...
DiscoverGold
NAAIM Exposure Index
May 30, 2024
The NAAIM Number
92.21
Last Quarter Average
84.57
»»» Read More…
|
Followers
|
178
|
Posters
|
|
|
Posts (Today)
|
0
|
Posts (Total)
|
67994
|
|
Created
|
06/10/03
|
Type
|
Free
|
| Moderators DiscoverGold | |||
:::::::::::: Welcome to S&P 500 & Nasdaq Analysis and Trends :::::::::::::
• The purpose of this board is to help others with Short & Long term S&P 500 & Nasdaq analysis and direction.
• This is strickly an educational board helping traders to learn market direction, swing and bottom trading.
• I ask that everyone respect opinions on the board whether you agree with them or not. We are all here to make money and avoid the
minimum loss we can.
Rules of the Board
Most of this board's WATCHERS are "lurkers" who appreciate info available without the need to sift through tons of "empty" posts.
1. Respect everyone opinions on trades.
2. No Pumping of Stocks.
3. No OTCBB or PINK STOCKS
*********************************************************************************************************
To help us evaluate our performance, please "BoardMark" the board if you find it useful.
To do so, just click on "Add to Favorites" Button at Right just above the Posts Dates.
 Presently, the Board has 178 Boardmarks, Thank you!
*Information Posted on this Board is not Meant to Suggest any Specific Action, But to Point Out the Technical Signs That Can Help Our Readers Make Their Own Specific Decisions. Your Due Deligence is a Must.
EXCHANGE TRADED FUNDS~ETFs COMPONENTS~RSI and I/V charts#msg-5495097 COMPONENTSFOR ^NDX / QQQQ ~ I/V charts #msg-9787995
Gold~ Silver~ HUI~ XAU~ US$~ €uro~ Crude #msg-29347660 (thanks,bob)
Cookies/Bandwidth/Security/Privacy #msg-9353921 PIEs/Cookies/Macromedia/Flash #msg-9412363 PerformanceTips for WinXP #msg-9854670
| Volume | |
| Day Range: | |
| Bid Price | |
| Ask Price | |
| Last Trade Time: |


