 News
News  Market Data
  Discover
Support: 888-992-3836
Copyright © 2023 InvestorsHub Inc.


Register for free to join our community of investors and share your ideas. You will also get access to streaming quotes, interactive charts, trades, portfolio, live options flow and more tools.
Nasdaq Composite Index (COMP) »» Weekly Summary Analysis
By: Marty Armstrong | June 15, 2024
NASDAQ Composite Index Cash closed today at 1768888 and is trading up about 17% for the year from last year's settlement of 1501135. Up to this moment in time, this market has been rising for 7 months going into June suggesting that this has been a bull market trend on the monthly time level which has been confirmed by electing all of our model's long-term Bullish Reversals from the key low. As we stand right now, this market has made a new high exceeding the previous month's high reaching thus far 1774180 while it has not broken last month's low so far of 1555764. Nevertheless, this market is still trading above last month's high of 1703266.
ECONOMIC CONFIDENCE MODEL CORRELATION
Here in NASDAQ Composite Index Cash, we do find that this particular market has correlated with our Economic Confidence Model in the past. The Last turning point on the ECM cycle low to line up with this market was 2022 and 2009 and 2002. The Last turning point on the ECM cycle high to line up with this market was 2007 and 2000.
MARKET OVERVIEW
NEAR-TERM OUTLOOK
The NASDAQ Composite Index Cash has continued to make new historical highs over the course of the rally from 2009 moving into 2024. Prominently, we have elected four Bullish Reversals to date.
This market remains in a positive position on the weekly to yearly levels of our indicating models. Pay attention to the Monthly level for any serious change in long-term trend ahead.
Focusing on our perspective using the indicating ranges on the Daily level in the NASDAQ Composite Index Cash, this market remains in a bullish position at this time with the underlying support beginning at 1721345.
On the weekly level, the last important high was established the week of June 10th at 1774180, which was up 33 weeks from the low made back during the week of October 23rd. So far, this week is trading within last week's range of 1774180 to 1705734. Nevertheless, the market is still trading upward more toward resistance than support. A closing beneath last week's low would be a technical signal for a correction to retest support.
When we look deeply into the underlying tone of this immediate market, we see it is currently still in a semi neutral posture despite declining from the previous high at 1774180 made 0 week ago. Still, this market is within our trading envelope which spans between 1504559 and 1789331. This market has made a new historical high this past week reaching 1774180. Here the market is trading positive gravitating more toward resistance than support. We have technical support lying at 1718366 which we are still currently trading above for now.
Right now, the market is above momentum on our weekly models hinting this is still bullish for now as well as trend, long-term trend. Looking at this from a wider perspective, this market has been trading up for the past 8 weeks overall.
INTERMEDIATE-TERM OUTLOOK
YEARLY MOMENTUM MODEL INDICATOR
Our Momentum Models are rising at this time with the previous low made 2022 while the last high formed on 2023. However, this market has rallied in price with the last cyclical high formed on 2021 warning that this market remains strong at this time on a correlation perspective as it has moved higher with the Momentum Model.
Interestingly, the NASDAQ Composite Index Cash has been in a bullish phase for the past 14 months since the low established back in March 2023.
Critical support still underlies this market at 1520870 and a break of that level on a monthly closing basis would warn that a sustainable decline ahead becomes possible. Nevertheless, the market is trading above last month's high showing some strength.
 DiscoverGold
June’s Quad Witching Options Expiration – A Volatility Haven
By: Almanac Trader | June 14, 2024

The second Quadruple Witching Week of the year brings on some volatile trading with losses frequently exceeding gains. NASDAQ has the weakest record on the first trading day of the week, down 23 times in 42 years. Quad-Witching Friday is usually better, S&P 500 has been up 12 of the last 21 years, but down 6 of the last 8.
Full-week performance is choppy as well, littered with greater than 1% moves in both directions. The week after June’s Quad-Witching Day is horrendous. This week has experienced DJIA losses in 28 of the last 34 years with an average performance of –0.83%. S&P 500 and NASDAQ have fared better during the week after over the same 34-year span. S&P 500 averaged –0.49%. NASDAQ has averaged +0.03%. Sizable gains in 2021 and 2022 during the week after improved historical average performance notably.


Read Full Story »»»
DiscoverGold
$SPY 4.8 Million Put with a 514 strike for November
By: Cheddar Flow | June 14, 2024
• There's been some CRAZY orders today
Here's another:
$SPY 4.8M Put with a 514 strike for November
This was bought to open (Vol>OI) and is most likely a bet to capitalize on volatility picking up soon
*Above the Ask*

Read Full Story »»»
DiscoverGold
$SPY Melt-Up Bet $1.6 Million worth of 740 STRIKE CALLS that expire in 1.5 years
By: Cheddar Flow | June 14, 2024
• Huge $SPY Melt-Up Bet
A whale just added $1.6M worth of 740 STRIKE CALLS that expire in 1.5 years
This is an opening order (Vol>OI) and was executed above the ask to signal urgency

Read Full Story »»»
DiscoverGold
$QQQ $5.7 Million Highly Unusual OTM Calls
By: Cheddar Flow | June 14, 2024
• $QQQ Woah. $5.7M Highly Unusual OTM Calls
These prints are aggressive and expire in just 2 weeks
*Above the Ask*

Read Full Story »»»
DiscoverGold
The % of S&P 500 stocks outperforming the S&P 500 index over a rolling 21-day period fell to 18%, the second-lowest point in history
By: Dean Christians | June 14, 2024
• The % of S&P 500 stocks outperforming the S&P 500 index over a rolling 21-day period fell to 18%, the second-lowest point in history.
In 1955, when this indicator recorded the lowest reading ever, General Motors accounted for 10% of the weighting in the S&P 500.

Read Full Story »»»
DiscoverGold
The 10 Top/Bottom S&P 500 Index percent net change performers
By: Thom Hartle | June 14, 2024
• Today (8:33 CST), the 10 top/bottom percent net change performers in the S&P 500 Index.

Read Full Story »»»
DiscoverGold
The companion Summation Index is moving down now, while prices move up, which is highly irregular and a sign of trouble
By: Tom McClellan | June 13, 2024
• The McClellan Oscillator is a very short term accelerometer for the A-D data. The companion Summation Index changes each day by the value of the Oscillator, so the Summation is moving down now, while prices move up, which is highly irregular and a sign of trouble.

Read Full Story »»»
DiscoverGold
Only 30 NDX component stocks were higher on June 13, despite the new all-time high for the index
By: Tom McClellan | June 13, 2024
• By my count today, only 30 NDX component stocks were higher on June 13, despite the new all-time high for the index. That keeps the McClellan A-D Oscillator for those stocks below zero, not the condition you want to see if you are in the bullish camp.

Read Full Story »»»
DiscoverGold
Market Breadth continued to weaken today as the % of S&P 500 $SPX stocks trading above their 100D moving average fell to a low of 45%, the lowest level since November 16
By: Barchart | June 13, 2024
• Market Breadth continued to weaken today as the % of S&P 500 $SPX stocks trading above their 100D moving average fell to a low of 45%, the lowest level since November 16.

Read Full Story »»»
DiscoverGold
Money managers Increased their exposure to the US Equity markets since last week...
DiscoverGold
NAAIM Exposure Index
June 13, 2024 
The NAAIM Number
86.30
Last Quarter Average
84.57
»»» Read More…
A Critical Moment in Markets
By: Macro Charts | June 13, 2024
The S&P has finally reached the channel resistance I’ve been tracking for months.
• In fact, it gapped through the resistance and then faded the rest of the day.
• This creates the SETUP for an exhaustion gap, IF it closes the gap within a few days — the faster this happens, the more unstable the market is at this juncture, in my view.
• I should once again emphasize that I’m not Short the S&P or NDX here, or looking to Short the main indexes. (I don’t Short uptrends, period.)
• My focus remains on the weakest areas of the market — all of which are still in downtrends and could be developing TRAP patterns — which we’ll cover in detail later in this Post.

Nearly all core Breadth signals I monitor remain weak.
• The only one with a small improvement is the High-Low Oscillator (below).
• All other Breadth indicators remain on Sell signals — indicating the majority of Stocks are no longer in uptrends (or perhaps worse).
• Even here, note the High-Low Oscillator is barely rising — ANY small decline in the market here would form another lower high in the oscillator, and confirm a continuation Sell signal.
• Remember: when a model is already vulnerable, continuation Sell signals generally lead to much worse outcomes.

Core Risk Models are a big concern at this time.
• A major spike triggered yesterday — the first of this rally since the April lows — while the model itself is now extremely overbought.
• This combination doesn’t guarantee an immediate Top, but has been seen near many important Tops throughout history.
• As always — for confirmation, I am watching to see a turn DOWN in the model.
• I’ll update subscribers if/when the signal is triggered.

Next, a number of additional signals I’m tracking, as well as individual areas of the market, which add significant concern IF their Setups are confirmed.
Read Full Story »»»
DiscoverGold
Over the past 150 sessions, the S&P 500 has returned more than 40 times the standard deviation of its daily changes.
By: Jason Goepfert | June 13, 2024
• Over the past 150 sessions, the S&P 500 has returned more than 40 times the standard deviation of its daily changes.
The only time in 25 years it reached this extreme was in January 2018.
Markets suffered through "Volmageddon" soon after that when traders piling into easy-money volatility products got smacked. There is a hint of an echo now with the proliferation of volatility-selling funds.
There is no free money in markets.

Read Full Story »»»
DiscoverGold
Despite repeated record highs in the Nasdaq, there is a persistent bug...
By: Jason Goepfert | June 12, 2024
• Despite repeated record highs in the Nasdaq, there is a persistent bug.
Most of these days have seen more stocks at 52-week lows than highs. It's happened 9 out of 10 days.
There has been only one similar cluster in ~40 years: late October through early November 2007.

Read Full Story »»»
DiscoverGold
The 10 Top/Bottom NASDAQ 100 Index percent net change performers
By: Thom Hartle | June 13, 2024
• Today (8:33 CST), the 10 top/bottom percent net change performers in the NASDAQ 100 Index.

Read Full Story »»»
DiscoverGold
The AAII Investor Sentiment
By: AAII | June 13, 2024
Bullish 44.6%
Neutral 29.7%
Bearish 25.7%
• Historical 1-Year High
Bullish: 52.9%
Neutral: 36.4%
Bearish: 50.3%
Read Full Story »»»
DiscoverGold
Rate Cut Optimism Fuels Election Year June Strength
By: Almanac Trader | June 12, 2024

We welcome today’s solid NASDAQ and Russell 2000 gains as we continue to hold associated long positions from our Seasonal MACD Buy signal last October. A better than anticipated CPI reading from the Bureau of Labor Statistics and a Fed announcement are keeping interest rate cut optimism alive and well with signs pointing to the possibility of two small cuts later this year. This optimism has also fueled above average election-year June gains.
As of today’s close, NASDAQ is up 5.22%, S&P 500 is up 2.72% and Russell 1000 is up 2.53% so far this June. Compared to historical election-year performance this is more than double. DJIA and Russell 2000 have not been as strong and are below historical average performance. Early June strength has materialized but it has not been across the board. Thus far historical softness ahead of mid-June appears to have been overcome, the next hurdle will be historical weakness later in the month, typically in the week after quadruple witching options expiration on June 21.
Read Full Story »»»
DiscoverGold
The 10 Top/Bottom S&P 500 Index percent net change performers
By: Thom Hartle | June 12, 2024
• Today (8:33 CST), the 10 top/bottom percent net change performers in the S&P 500 Index.

Read Full Story »»»
DiscoverGold
$SPX $SPY #CPI - Final target from the lrgr 'Broadening' hit
By: Sahara | June 12, 2024
• $SPX $SPY #CPI - Final target from the lrgr 'Broadening' hit.
Poking above the parapet of the lrgr Bear 'Wedge'. Can it hold to tap the extreme targets (Blue) from that smlr 'Diamond'...

Read Full Story »»»
DiscoverGold
$SPX $SPY - 'Diamond' Playing out as a Continuation?
By: Sahara | June 11, 2024
• $SPX $SPY - 'Diamond' Playing out as a Continuation?
Closing in on the final target from the lrgr 'Broadening' Plot. A B/Out of the pink band will target the Blue Arrows...

Read Full Story »»»
DiscoverGold
$QQQ Bear attempting to put a halt to the rally from today *Above the Ask*
By: Cheddar Flow | June 11, 2024
• $QQQ Bear attempting to put a halt to the rally from today
*Above the Ask*

Read Full Story »»»
DiscoverGold
$SPX $SPY - Bounced from the Daily 11/EMA
By: Sahara | June 11, 2024
• $SPX $SPY - Bounced from the Daily 11/EMA.
Divergence building and still has the Uppr-Line of Bear 'Wedge as resistance. If it can push through it will target the Dotted-Red Line...

Read Full Story »»»
DiscoverGold
$SPX $15.6 Million 6000 Call
By: Cheddar Flow | June 11, 2024
• $SPX $15.6M 6000 Call

Read Full Story »»»
DiscoverGold
The 10 Top/Bottom NASDAQ 100 Index percent net change performers
By: Thom Hartle | June 11, 2024
• Today (8:33 CST), the 10 top/bottom percent net change performers in the NASDAQ 100 Index.

Read Full Story »»»
DiscoverGold
With a 92nd percentile allocation to equities, Commodity Trading Advisors demonstrate their confidence in the potential for strong returns
By: Isabelnet | June 11, 2024
• Equities
With a 92nd percentile allocation to equities, Commodity Trading Advisors demonstrate their confidence in the potential for strong returns.

Read Full Story »»»
DiscoverGold
Despite the rising median short interest in the S&P 500, the level of 1.9% remains relatively low, suggesting that market participants are positive or cautiously optimistic about the future performance of the stock market
By: Isabelnet | June 11, 2024
• S&P 500
Despite the rising median short interest in the S&P 500, the level of 1.9% remains relatively low, suggesting that market participants are positive or cautiously optimistic about the future performance of the stock market.

Read Full Story »»»
DiscoverGold
S&P 500: With a reading of 80.98, the US stock market remains overbought, prompting concerns among some investors about a correction in the near future
By: Isabelnet | June 11, 2024
• S&P 500
With a reading of 80.98, the US stock market remains overbought, prompting concerns among some investors about a correction in the near future.

Read Full Story »»»
DiscoverGold
Markets Monthly Pattern »» Watchlist - Top 10
By: Marty Armstrong | June 11, 2024
• Dow Jones Industrials Index »» Still Bearish
• NASDAQ Composite Index »» Pressing Higher
• NASDAQ 100 Index »» Pressing Higher
• S&P 500 Index »» Pressing Higher
• Russell 2000 Index »» Preraring to Rally
• US Dollar Index »» Reaction Low
• CBOE VIX Index »» Moving Lower
• NY Gold Futures »» Turning BACK DOWN
• NY Silver COMEX Futures »» Turning BACK DOWN
• NY Crude Oil Futures »» New Lows Likely
DiscoverGold
$SPX $SPY - Another 'Diamond' As the Bear 'Wedge' goes into play. If it pops thru the top it will be a continuation plot and target 5450 to +5500...
By: Sahara | June 10, 2024
• $SPX $SPY - Another 'Diamond'
As the Bear 'Wedge' goes into play. If it pops thru the top it will be a continuation plot and target 5450 to +5500...

Read Full Story »»»
DiscoverGold
The best performing stocks in the S&P 500 over the last 5, 10, 15, and 20 years...
By: Charlie Bilello | June 10, 2024
• The best performing stocks in the S&P 500 over the last 5, 10, 15, and 20 years...

Read Full Story »»»
DiscoverGold
The 10 Top/Bottom S&P 500 Index percent net change performers
By: Thom Hartle | June 10, 2024
• Today (8:34 CST), the 10 top/bottom percent net change performers in the S&P 500 Index.

Read Full Story »»»
DiscoverGold
The 10 Top/Bottom NASDAQ 100 Index percent net change performers
By: Thom Hartle | June 10, 2024
• Today (8:34 CST), the 10 top/bottom percent net change performers in the NASDAQ 100 Index.

Read Full Story »»»
DiscoverGold
The Market Greed/Fear Index, currently at 79.17, indicates very optimistic investor sentiment in the US stock market, characteristic of a greedy market
By: Isabelnet | June 10, 2024
• Sentiment
The Market Greed/Fear Index, currently at 79.17, indicates very optimistic investor sentiment in the US stock market, characteristic of a greedy market.

Read Full Story »»»
DiscoverGold
Valuation metrics suggest that the S&P 500 is experiencing high valuations, with multiple indicators pointing to an overvaluation
By: Isabelnet | June 10, 2024
• Valuation metrics suggest that the S&P 500 is experiencing high valuations, with multiple indicators pointing to an overvaluation.

Read Full Story »»»
DiscoverGold
A-D Line Divergence Shows Bull Market Starting To Crack
By: Tom McClellan | June 7, 2024
The SP500 is up to a new all-time high, but the NYSE's Advance-Decline (A-D) Line is not confirming that. This is a sign of trouble, because it means that the concentration of buying in certain big cap stocks which drive the major averages is not being confirmed by what the rest of the market is doing.
A cumulative daily A-D Line is calculated by tabulating the number of stocks going up every day (Advances) and subtracting the ones who close down (Declines). That daily A-D difference is known as "the daily breadth". An A-D Line is a running tabulation of all prior data, and it changes each day by the value of the daily breadth number.
Most of the time, the NYSE's A-D Line will echo what prices are doing. That is the normal behavior. But I watch the NYSE's A-D Line carefully all the time, because historically a bearish divergence like what we are seeing now has been a big sign of trouble. Most price indices are dominated by the largest capitalization stocks, but every stock gets an equal vote in the A-D Line.
That can be useful because when liquidity starts to dry up, it typically affects the smaller capitalization stocks first. That poor liquidity eventually comes around to bite the big stocks. So the A-D Line functions like the canaries in the coal mines of Newcastle 200 years ago, being more sensitive to the bad gases, and providing an early warning of impending problems for the coal miners.
A-D Line studies can also be useful because it is hard to manipulate those data. While it may be possible for big traders to manipulate a single stock, or perhaps even the big stocks which move the major averages, it is functionally impossible to manipulate all of the stocks (unless you are the Fed, doing quantitative easing).
I prefer the NYSE's A-D Line because it has a much better track record of working. The Nasdaq's A-D Line, by contrast, is a horrible indicator because of its persistent bearish bias.
The listing standards for stocks are looser on the Nasdaq than on the NYSE. So a stock which is going to go from IPO to broke is more likely to be listed on the Nasdaq. And every day that its share price spends on the way from the IPO price to zero, that stock is contributing to the Declines column of the data. The Nasdaq Composite Index is currently making new all-time highs, but its A-D Line is near its all-time low readings. This is not unusual.
When doing presentations, I like to stump the audience by asking when was the last time that the Nasdaq's A-D Line made a new all-time high. This is a trick question, because it has never made a new all-time high. It started downward from the beginning of the data in 1972, and has never gotten back to that level.
There is a little bit of value in looking at the components of the Nasdaq 100 Index (NDX). Back in 1999 I figured that those A-D data might be interesting to look at, but I could not find it published anywhere. So I compiled the data to calculate those breadth statistics myself. The hardest part was tracking the component changes over time, which the Nasdaq did not completely publish as far back as I wanted to go. And now I have to keep track of component changes as they happen annually, and also sometimes in the middle of a year thanks to mergers or delistings.
Right now, we are seeing a bearish divergence from prices in the A-D Line for Nasdaq 100 stocks. This is a pretty rare event, because it almost never shows a bearish divergence. I have good A-D data back to 1993, and I think this is just the 5th time we have ever seen a bearish divergence like this. Most of the time it just does what the NDX does. The other times were in 2021, shown in the chart, plus back in 2000, 2007, and again in 2015. All were good indications of trouble coming.
Any divergence represents a "condition", and is not a "signal". Divergences are funny because they do not necessarily have to matter right away, just because we may notice them. Divergences can also sometimes get "rehabilitated". If these A-D Lines start moving up and making higher highs again, then the apparent divergences we see now go away. That is a possibility.
Divergences also will not tell us how big such problems might be, i.e. how bad any price decline might be. For now, though, these are warnings of illiquidity problems for the stock market.
Tom McClellan
Editor, The McClellan Market Report
Read Full Story »»»
DiscoverGold
CoT: Peek Into Future Through Futures, How Hedge Funds Are Positioned
By: Hedgopia | June 8, 2024
• Following futures positions of non-commercials are as of June 4, 2024.
E-mini S&P 500: Currently net short 65k, up 62.8k.

Leading up to this week, the S&P 500 developed a weekly hanging man preceded by a long-legged doji. Last week’s hanging man in particular, if confirmed this week, would have given the bears much-needed momentum – at least near term – but that was not to be.
The week began with intraday weakness on both Monday and Tuesday, but it was bought. By Friday, a new intraday high of 5375 was recorded, although the large cap index was unable to hang on to the gains, finishing the session/week at 5347, up 1.3 percent for the week.
In three sessions through Tuesday, horizontal support at 5260s was breached intraday but only for bids to show up on time to reclaim it by close. Bulls are holding on to the momentum ball and are fine until they lose 5260s.
Nasdaq (mini): Currently net long 2k, up 5.7k.

Last Friday, three-month horizontal support at 18300s was breached intraday but only to then attract massive buying interest to finish the session with a dragonfly doji. This Monday, intraday weakness was again bought just above that support. With the momentum wind at their back, tech bulls notched a new intraday high of 19114 on Friday, ending the week up 2.5 percent to 19001.
That said, the weekly RSI is making lower lows. This week, the metric ended just north of 66, versus mid-70s in February.
Investor fascination with the likes of Nvidia (NVDA), which now commands a three-trillion-dollar market cap, continues. Pre-earnings on May 22nd, the stock closed at $950; this Thursday, it tagged $1,256. In the fullness of time, such exuberance hardly ends well. It is tempting to say this time it is different. It seldom is.
Russell 2000 mini-index: Currently net short 34.4k, up 510.

Small-caps diverged with their large-cap cousins this week. The Russell 2000 was down 2.1 percent to 2027, with Friday’s intraday low of 2023 near horizontal support at 2000. The index has also been trading within a descending channel since May 15th when it tagged 2112 and headed lower; Friday’s low tested that support.
The index has traded above 2000 since early last month, while 2100 has stood like a mountain since early March.
The small cap index peaked in November 2021 at 2459, subsequently reaching 1641 in June 2022, which was successfully tested in October of both 2022 and 2023. A 61.8-percent Fibonacci retracement of that drop tallies to 2144. The index lost 2100 in January 2022 and has since struggled at that price point; 2100 also represents a measured-move price target post-breakout at 1900 last December. Before that, the index went back and forth between 1700 and 1900 going back to January 2022.
Small-cap bulls have an opportunity here to put their foot down. Inability to do so would hasten a move toward 1900.
US Dollar Index: Currently net long 4.9k, up 713.

A rising trendline from last December when the US dollar index bottomed at 100.32 was breached intraweek but was saved by the end of the week. The index closed up 0.2 percent to 104.86, forming a weekly bullish hammer.
The index has trended lower since touching 106.38 on May 1st; back then, it struggled north of 106 for four consecutive weeks before weakening.
Dollar bulls now have a decent opportunity to reverse higher. Horizontal support at 103-104 goes back to December 2016, and it is holding.
VIX: Currently net short 41.3k, down 1.5k.

Last Friday, VIX was vehemently denied at the 50- and 200-day (now 14.39 and 14.59 respectively) as it retreated from 14.87. This Friday, it tagged 12.11 intraday to close at 12.22. On May 3rd, it dropped as low as 11.52 before reversing higher; this level is a must-hold.
Going back six years, volatility bulls have repeatedly defended 12 and deserve to be given the benefit of the doubt.
Read Full Story »»»
DiscoverGold
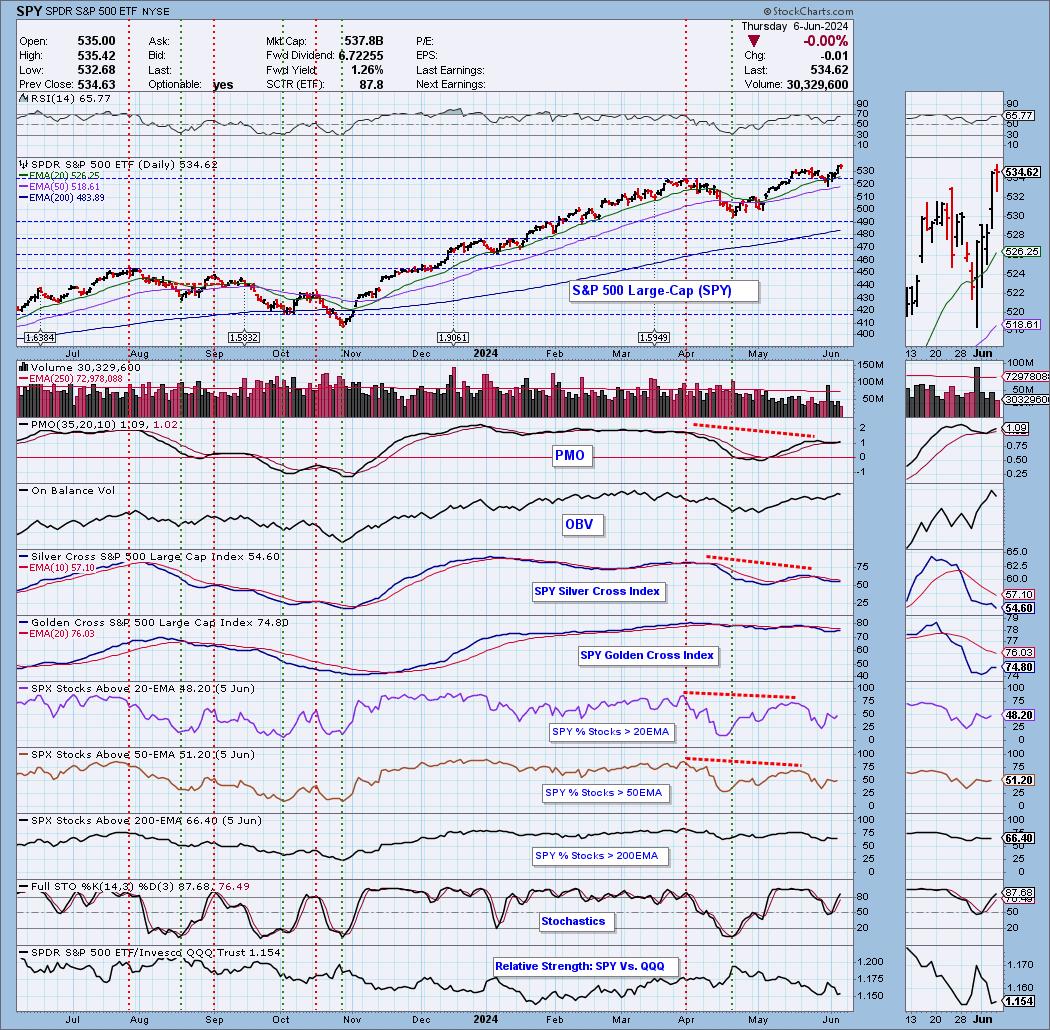
S&P 500 Index (SPX) »» Weekly Summary Analysis
By: Marty Armstrong | June 8, 2024
S&P 500 Cash Index closed today at 534699 and is trading up about 12% for the year from last year's settlement of 476983. Up to now, this market has been rising for 7 months going into June suggesting that this has been a bull market trend on the monthly time level which has been confirmed by electing all of our model's long-term Bullish Reversals from the key low. As we stand right now, this market has made a new high exceeding the previous month's high reaching thus far 537508 while it has not broken last month's low so far of 501105. Nevertheless, this market is still trading above last month's high of 534188.
ECONOMIC CONFIDENCE MODEL CORRELATION
Here in S&P 500 Cash Index, we do find that this particular market has correlated with our Economic Confidence Model in the past. The Last turning point on the ECM cycle low to line up with this market was 2009 and 2002. The Last turning point on the ECM cycle high to line up with this market was 2022 and 2007 and 2000.
MARKET OVERVIEW
NEAR-TERM OUTLOOK
The S&P 500 Cash Index has continued to make new historical highs over the course of the rally from 1974 moving into 2024. Noticeably, we have elected two Bullish Reversals to date.
This market remains in a positive position on the weekly to yearly levels of our indicating models. Pay attention to the Monthly level for any serious change in long-term trend ahead.
The perspective using the indicating ranges on the Daily level in the S&P 500 Cash Index, this market remains in a bullish position at this time with the underlying support beginning at 532549.
On the weekly level, the last important high was established the week of June 3rd at 537508, which was up 32 weeks from the low made back during the week of October 23rd. So far, this week is trading within last week's range of 537508 to 523432. Nevertheless, the market is still trading upward more toward resistance than support. A closing beneath last week's low would be a technical signal for a correction to retest support.
When we look deeply into the underlying tone of this immediate market, we see it is currently still in a semi neutral posture despite declining from the previous high at 537508 made 0 week ago. Still, this market is within our trading envelope which spans between 487203 and 552543. This market has made a new historical high this past week reaching 537508. Here the market is trading positive gravitating more toward resistance than support. We have technical support lying at 524204 which we are still currently trading above for now.
Right now, the market is above momentum on our weekly models hinting this is still bullish for now as well as trend, long-term trend. Looking at this from a wider perspective, this market has been trading up for the past 7 weeks overall.
INTERMEDIATE-TERM OUTLOOK
YEARLY MOMENTUM MODEL INDICATOR
Our Momentum Models are rising at this time with the previous low made 2022 while the last high formed on 2023. However, this market has rallied in price with the last cyclical high formed on 2022 warning that this market remains strong at this time on a correlation perspective as it has moved higher with the Momentum Model.
Interestingly, the S&P 500 Cash Index has been in a bullish phase for the past 14 months since the low established back in March 2023.
Critical support still underlies this market at 468200 and a break of that level on a monthly closing basis would warn that a sustainable decline ahead becomes possible. Nevertheless, the market is trading above last month's high showing some strength.
DiscoverGold
Nasdaq Composite Index (COMP) »» Weekly Summary Analysis
By: Marty Armstrong | June 8, 2024
NASDAQ Composite Index Cash closed today at 1713313 and is trading up about 14% for the year from last year's settlement of 1501135. Factually, this market has been rising for 7 months going into June suggesting that this has been a bull market trend on the monthly time level which has been confirmed by electing all of our model's long-term Bullish Reversals from the key low. As we stand right now, this market has made a new high exceeding the previous month's high reaching thus far 1723573 while it has not broken last month's low so far of 1555764. Nevertheless, this market is still trading above last month's high of 1703266.
ECONOMIC CONFIDENCE MODEL CORRELATION
Here in NASDAQ Composite Index Cash, we do find that this particular market has correlated with our Economic Confidence Model in the past. The Last turning point on the ECM cycle low to line up with this market was 2022 and 2009 and 2002. The Last turning point on the ECM cycle high to line up with this market was 2007 and 2000.
MARKET OVERVIEW
NEAR-TERM OUTLOOK
The NASDAQ Composite Index Cash has continued to make new historical highs over the course of the rally from 2009 moving into 2024. Clearly, we have elected four Bullish Reversals to date.
This market remains in a positive position on the weekly to yearly levels of our indicating models. Pay attention to the Monthly level for any serious change in long-term trend ahead.
Looking at the indicating ranges on the Daily level in the NASDAQ Composite Index Cash, this market remains in a bullish position at this time with the underlying support beginning at 1703266.
On the weekly level, the last important high was established the week of June 3rd at 1723573, which was up 32 weeks from the low made back during the week of October 23rd. So far, this week is trading within last week's range of 1723573 to 1664643. Nevertheless, the market is still trading upward more toward resistance than support. A closing beneath last week's low would be a technical signal for a correction to retest support.
When we look deeply into the underlying tone of this immediate market, we see it is currently still in a semi neutral posture despite declining from the previous high at 1723573 made 0 week ago. Still, this market is within our trading envelope which spans between 1492502 and 1774992. This market has made a new historical high this past week reaching 1723573. Here the market is trading positive gravitating more toward resistance than support. We have technical support lying at 1675028 which we are still currently trading above for now.
Right now, the market is above momentum on our weekly models hinting this is still bullish for now as well as trend, long-term trend. Looking at this from a wider perspective, this market has been trading up for the past 7 weeks overall.
INTERMEDIATE-TERM OUTLOOK
YEARLY MOMENTUM MODEL INDICATOR
Our Momentum Models are rising at this time with the previous low made 2022 while the last high formed on 2023. However, this market has rallied in price with the last cyclical high formed on 2021 warning that this market remains strong at this time on a correlation perspective as it has moved higher with the Momentum Model.
Interestingly, the NASDAQ Composite Index Cash has been in a bullish phase for the past 14 months since the low established back in March 2023.
Critical support still underlies this market at 1520870 and a break of that level on a monthly closing basis would warn that a sustainable decline ahead becomes possible. Nevertheless, the market is trading above last month's high showing some strength.
DiscoverGold
$SPY Looking at Seasonality data for election years only, June has been one of the best performers: 75% win rate over the last 30 years.
By: TrendSpider | June 7, 2024
• Summer run just heating up? $SPY
Looking at Seasonality data for election years only, June has been one of the best performers:
75% win rate over the last 30 years.

Read Full Story »»»
DiscoverGold
$SPY Quite the setup heading into CPI + FOMC week
By: TrendSpider | June 7, 2024
• Quite the setup heading into CPI + FOMC week. $SPY

Read Full Story »»»
DiscoverGold
Tracking the Three Signs of the Bear
By: David Keller | June 7, 2024
There is no denying that the primary trend for the S&P 500 remains bullish as we push to the end of Q2 2024. But what about the conditions "under the hood" of the major benchmarks? Today, we'll highlight three "signs of the bear" we're looking for, of which two may have already triggered, and what sort of confirmation could indicate a bearish reversal into the summer.
The first thing I've noticed about major market tops is that we tend to observe a proliferation of bearish momentum divergences. As prices push higher, we begin to see weaker momentum readings using an indicator like RSI. Let's check out how the recent upswing for the S&P 500 has looked from a momentum perspective.

Here, we can see that the S&P 500's RSI was around 70 when it first closed above 5300 in mid-May, but only around 65 on the recent push above 5350. Higher highs on weaker momentum indicates a potential exhaustion of buyers, with less emphasis on the most recent upswing.
And it's not just about the S&P 500. Check out the daily chart of Amazon.com (AMZN), for a similar example in mid-May.

We can also see the bearish momentum divergence on stocks in the industrial sector, such as Northeast Ohio's own Eaton Corp. (ETN).

While I would say next week is crucial for the S&P 500, to see if there's another push above 5350 on stronger momentum, overall, the move higher in June generally speaking has been marked with lower momentum readings.
Another sign of the bear that I'd argue is very much in play is a lack of confirmation from market breadth indicators. Here's a chart of the S&P 500 on a closing basis, along with the cumulative advance-decline lines for the New York Stock Exchange, S&P 500 large-caps, S&P 400 mid-caps, and S&P 600 small-caps.

Note that not only are all four of those advance-decline lines sloping lower over the last three weeks, but three of them finished this week below their 50-day moving averages. When a market moves higher, but breadth conditions fail to confirm those new highs, this suggests narrow leadership and potential toppy conditions.
I know what you're thinking: "But Dave, isn't that just because the Magnificent 7 stocks are dominating again?" And yes, you would be correct. And while our major benchmarks can indeed move higher driven by those mega-cap growth stocks, market history has shown that a healthy bull market phase tends to be marked by improving breadth readings. I'd feel way more optimistic about market conditions if I observed more stocks participating in the uptrend!
Now we come to the third sign of the bear, which is the breaking of "lines in the sand" for the major averages. Going back to our daily S&P 500 chart, do you see the pink trendline using the major lows since October 2023?

If you connect the October 2023 low to the mid-April low around 4950, you'll see that trendline connects almost perfectly with subsequent lows in April and May. As long as the S&P 500 remains above this trendline, then the primary bull trend would remain largely intact. But if and when the SPX fails to hold this trendline, and perhaps if it would break below price and moving average support around 5200, then I would strongly consider planning for much further downside for risk assets.
In established bull market phases, mindless investors tend to think only of potential upside, as they believe the bull market will never end. Mindful investors know that, by looking for signs of a potential rotation, you can better protect your previous gains in the event of a downside correction!
Read Full Story »»»
DiscoverGold
The S&P 500 $SPY Is Rebalancing Again...
By: Evan | June 7, 2024
• JUST IN: THE S&P 500 $SPY IS REBALANCING AGAIN
Stocks being added: CrowdStrike $CRWD, $KKR, GoDaddy $GDDY
Stocks being removed: Robert Half $RHI, Comerica $CMA, Illumina $ILMN

Read Full Story »»»
DiscoverGold
S&P 500 Still Bullish: This Is What You Should Watch For
By: StockCharts | June 7, 2024
• Stock market unfazed by today's jobs data
• Yields rise, US dollar rises, and equities close the week relatively flat
• Market breadth continues to be strong, indicating the stock market is still chugging along
It was a bit of a seesaw week in the stock market, but, overall, the market seems to think everything is looking good.
The May employment report indicated that the change in Non-Farm Payrolls (NFP) was stronger than expected. It came in at 272,000, significantly higher than the estimated 190,000. The unemployment rate climbed to 4%, and wages rose 4.1% in the past year.
The market's initial reaction? Well, treasury yields spiked after the report was released, and equity futures turned sharply lower. However, that didn't last long. At one point, the S&P 500 reached a new all-time high but closed lower. The number of added jobs weakens the probability of an interest rate cut. But isn't that what the market is expecting? Long-term, things are looking fine. Let's take a closer look.
Starting with the weekly chart of the S&P 500 ($SPX), it's clear the trend is still bullish, as is momentum (see chart below). Until this changes, there's no reason to think equities are setting up for a significant selloff.

CHART 1. WEEKLY CHART OF THE S&P 500 INDEX. The bullish trend is still intact and momentum continues to be strong.
Chart source: StockChartsACP. For educational purposes.
The weekly perspective remains strong, with the S&P 500 trading above its 21-week exponential moving average (EMA). The index bounced off its 21-week EMA (red line), and, with the exception of a reversal last week—which didn't put much of a dent in its bullish path—it continues to trend higher.
The Linear Regression Forecast (LRF) indicator (blue line) also indicates an upward trend. Since the LRF is based on the line of best fit, it can be considered a good indicator to measure the near-term trend. The last point of this indicator forecasts price direction, which, in the weekly chart, points higher.
Momentum also seems strong, with the moving average convergence/divergence trending higher and the stochastic oscillator well in overbought territory. So, from a weekly perspective, the S&P 500 looks bullish.
Does the picture change on the daily chart? Let's take a look.

CHART 2. DAILY CHART OF THE S&P 500 INDEX. It may be a little more choppy than the weekly chart, but the trend is still bullish, and the momentum is strong.
Chart source: StockChartsACP. For educational purposes.
The daily chart is a little more choppy than the weekly one, but it still suggests the S&P 500 is trending higher. The market had a bumpy ride at the end of May, but it recovered.
Watching a breadth indicator to see if it supports the trend is a good idea. There are several breadth indicators available in StockCharts.com, such as the Advance-Decline Line, McClellan Oscillator, and the Bullish Percent Index (BPI).
The chart below displays the BPI for the S&P 500. When the BPI is above 50, it indicates that bulls have the edge, with 70 representing overbought levels and 30 oversold, although you can use different thresholds.

CHART 3. S&P 500 BULLISH PERCENT INDEX. The BPI indicates the S&P 500 is still bullish.
Chart source: StockChartsACP. For educational purposes.
It's interesting to note that the S&P 500's BPI hasn't been below 30 since the end of October. This suggests that the overall market continues to be bullish.
Another confirming indicator is the Volatility Index ($VIX), which continues to be low. Investors are not showing any signs of panic.
Read Full Story »»»
DiscoverGold
Recent Tech Selling Signals Big Future Upside
By: Lucas Downey | June 7, 2024
• Many tech-focused growth stocks were dumped by Big Money investors last week.
In fact, MAPsignals data noted the most risk-off action in technology shares since the market lows in October. Using the quality-laden Technology Select Sector SPDR ETF (XLK) as a proxy, you can see the recent decline:

Tech selling of this magnitude is uncommon.
A big catalyst this time around was the earnings miss by software company Salesforce.com, Inc. (CRM), which had investors hitting the exits and driving the share price down.
The selling hit other tech firms too – 44 tech stocks were sold on May 30 (roughly 20% of our tech universe), the most since Oct. 26.
This might seem like a downer. But it’s actually good news because recent tech selling signals big future upside.
Let me show you what I mean.
Recent Tech Selling Signals Big Future Upside
Since 2013, when 44 or more stocks are sold, the XLK ETF soars afterward:

Even better, MAPsignals data can help pinpoint the downtrodden names. For example, CRM is a top-15 holding in XLK and it was slammed:

But its fundamental story is solid, especially sales and earnings growth:
• 3-year sales growth rate (+18.1%)
• 3-year EPS growth rate (+590.9%)
• Profit margin (+11.9%)
Source: FactSet
Similarly, software firm ServiceNow, Inc. (NOW), which is also an XLK top-15 holding, has been sold heavily lately:

But it too is a financial powerhouse:
• 3-year sales growth rate (+25.7%)
• 3-year EPS growth rate (+184.6%)
• Profit margin (+19.3%)
Source: FactSet
A Map to Spot Top Stocks on Sale
Understanding that, it’s clear this could be a “buy the dip” opportunity. That was a wise move in the past for tech stocks in general.
If you bought CRM when red signals showed up in 2022-23, you’d be doing well:

The same is true for NOW. Buying the red-barred dips in 2022-23 was a winning move:

The bottom line is these tech liquidations are uncommon. When they happen, jump in with both hands.
A great way to do that is by tracking institutional money flows – it reveals tomorrow’s winners. It helps to have a map to spot top stocks on sale.
Read Full Story »»»
DiscoverGold
Down April – Up May Signals Q3 Weakness
By: Almanac Trader | June 7, 2024

Today’s jobs report pushes the likelihood of a rate cut out further and lowers expectations for multiple cuts. Strong employment number yet higher unemployment rate means more hiring and more people looking for jobs. Healthy economy. Weaker Q1 GDP is understandable considering the tear economy was on last year and since Covid.
Rates have stabilized and lower highs on the 10-Year Treasury reduces need for Fed to cut. The last inflation number was better, but we need to see a few readings of consistently lower PCE. Chart Below.
Down April – Up May Signals Q3 Weakness
When the market goes against seasonality it becomes an indicator. Weakness in a historically strong top month April and strength in weak May suggest more market chop as I have been saying for some time now with the market prone to some Q3 weakness into bear killing October just ahead of the election.
There have been some recent notes from the big bank’s research departments calling for a tough Q3. Not a lot of reasons are given but they are probably just referring to their handy copy of the Stock Trader’s Almanac (wink).
NASDAQ’s Best 8 Months Ends in June

Read Full Story »»»
DiscoverGold
$SPY $6.4 Million Call Print *Above the Ask*
By: Cheddar Flow | June 7, 2024
• $SPY $6.4M Call Print
This order has an unusual amount of premium and is for the August expiration
*Above the Ask*

Read Full Story »»»
DiscoverGold
S&P 500 Update: Will the Bears Get Their Next Chance at $5400+?
By: Dr. Arnout Ter Schure | June 7, 2024
• As long as this week’s low holds, we prefer to look towards SPX 5427-53, from where a larger correction of ~10% can occur.
A Five-Wave Impulse Rally
We track the S&P 500 (SPX) using the Elliott Wave Principle (EWP) primarily and view the current rally from the May 31 $5191 low as an impulse 5th wave targeting ideally $5427-53 contingent on holding above the colored dotted horizontal lines. See Figure 1 below. These levels are warning levels for the Bulls. Blue is the Bulls’ 1st warning, grey the 2nd, etc., and if the index drops below them, it increases the odds that the upside target will not be reached. Hence, they can be used as stop (loss) levels.

Figure 1. Hourly SPX chart with detailed EWP count and technical indicators
The current rally first saw an initiation move, grey W-I to $5301, a classic 61.80% retrace of that rally to $5233 for the grey W-ii. The pattern should now be in the grey W-iii to ideally $5385-5411. Moreover, the grey W-iii is subdividing into smaller waves (the orange and blue waves).
We expect today’s low to hold, and therefore, we can allow for the orange W-3, 4 to fill in over the next few trading hours. Assuming we are correct, then we expect the index to enter a larger correction (~10%) once the green W-5 completes. However, we are cognizant of the possibility that the Bulls may have one more trick up their sleeves. See Figure 2 below.

Figure 2. Daily SPX chart with detailed EWP count and technical indicators
The Bulls Remain in Control
Namely, the rally from the April 19 $4953 low, could see one more W-4, 5 sequence. Instead of a ~10% correction from the ideal $5427-53 target zone, we could only be treated with a single-digit pullback to around $5260+/-15 for the potential green W-4, followed by a last green W-5 to ~$5550+/-25. It will require a drop below last week’s low from the ideal $5427-53 target zone to strongly suggest a deeper correction is underway.
Thus, at this stage, we prefer to look higher, ideally to $5400+, from where a potentially larger correction can occur. However, it will require at least a drop below last week’s low to tell us that will be the case. Hence, there’s no need to front-run anything until that thesis is confirmed.
Read Full Story »»»
DiscoverGold
Technology Sector Participation Is Fading
By: Carl Swenlin | June 7, 2024
The Technology Sector (XLK) continues to dominate and drive the rally, but fewer and fewer stocks within the sector are participating in the rally. We know this because our Silver Cross Index (SCI), which shows the percent of stocks in the Technology Sector with Silver Cross BUY Signals (20-day EMA is above the 50-day EMA), is only at 54.60%. Almost half of the stocks are not on BUY Signals.
Further, looking at the seven years of data we have on the SCI (chart below), we were unable to find another case where XLK was making all-time highs with a Silver Cross Index reading so low that didn't lead to price weakness. Of course, we owe this dislocation to the magic of cap-weighting. While fewer and fewer Technology stocks are participating in the rally, the mega-cap stocks are the ones making new highs, and driving up the price of every price index of which they are a component. The numerous negative divergences we can see are telling us that this probably won't continue for long.
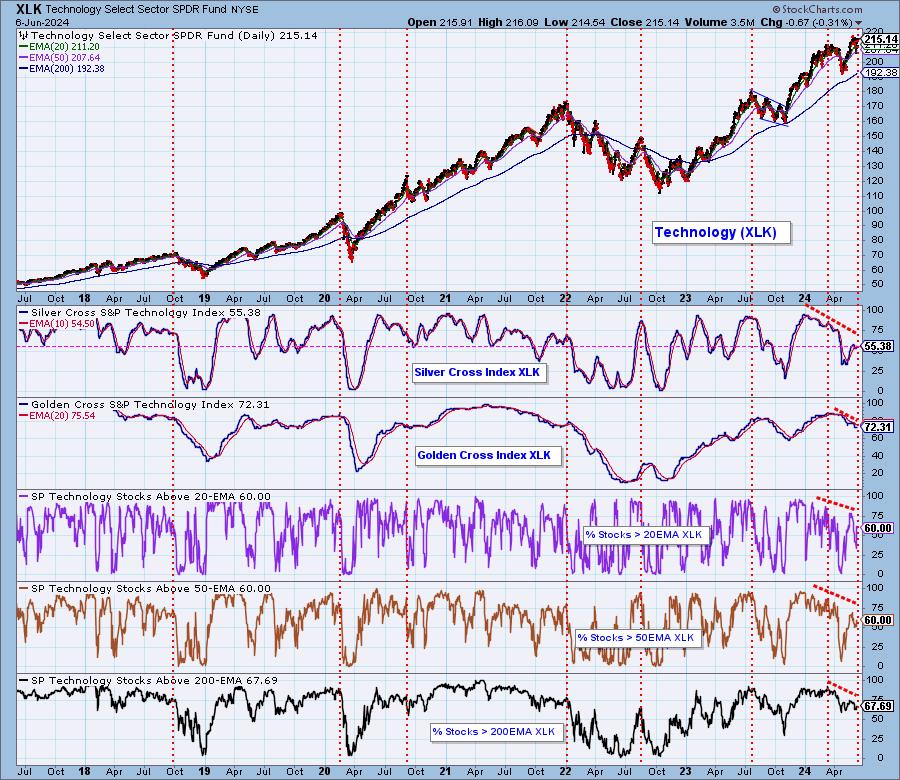
Conclusion: Participation within the Technology Sector has been fading since the beginning of the year. Mega-cap stocks are keeping prices elevated for now, but that probably won't last.
Read Full Story »»»
DiscoverGold
Markets Monthly Pattern »» Watchlist - Top 10
By: Marty Armstrong | June 7, 2024
• Dow Jones Industrials Index »» Still Bearish
• NASDAQ Composite Index »» Pressing Higher
• NASDAQ 100 Index »» Pressing Higher
• S&P 500 Index »» Pressing Higher
• Russell 2000 Index »» Preraring to Rally
• US Dollar Index »» Reaction Low
• CBOE VIX Index »» Still Bearish
• NY Gold Futures »» New Pattern Forming
• NY Silver COMEX Futures »» New Pattern Forming
• NY Crude Oil Futures »» Possible Temp Low
DiscoverGold
$SPX $SPY - B/Test or Re-entry into the 'Sideways Range; after a fake B/Out? Watch the Lwr 'Wedge' Line for clues...
By: Sahara | June 6, 2024
• $SPX $SPY - B/Test
or Re-entry into the 'Sideways Range; after a fake B/Out? Watch the Lwr 'Wedge' Line for clues...

Read Full Story »»»
DiscoverGold
|
Followers
|
178
|
Posters
|
|
|
Posts (Today)
|
0
|
Posts (Total)
|
67994
|
|
Created
|
06/10/03
|
Type
|
Free
|
| Moderators DiscoverGold | |||
:::::::::::: Welcome to S&P 500 & Nasdaq Analysis and Trends :::::::::::::
• The purpose of this board is to help others with Short & Long term S&P 500 & Nasdaq analysis and direction.
• This is strickly an educational board helping traders to learn market direction, swing and bottom trading.
• I ask that everyone respect opinions on the board whether you agree with them or not. We are all here to make money and avoid the
minimum loss we can.
Rules of the Board
Most of this board's WATCHERS are "lurkers" who appreciate info available without the need to sift through tons of "empty" posts.
1. Respect everyone opinions on trades.
2. No Pumping of Stocks.
3. No OTCBB or PINK STOCKS
*********************************************************************************************************
To help us evaluate our performance, please "BoardMark" the board if you find it useful.
To do so, just click on "Add to Favorites" Button at Right just above the Posts Dates.
 Presently, the Board has 178 Boardmarks, Thank you!
*Information Posted on this Board is not Meant to Suggest any Specific Action, But to Point Out the Technical Signs That Can Help Our Readers Make Their Own Specific Decisions. Your Due Deligence is a Must.
EXCHANGE TRADED FUNDS~ETFs COMPONENTS~RSI and I/V charts#msg-5495097 COMPONENTSFOR ^NDX / QQQQ ~ I/V charts #msg-9787995
Gold~ Silver~ HUI~ XAU~ US$~ €uro~ Crude #msg-29347660 (thanks,bob)
Cookies/Bandwidth/Security/Privacy #msg-9353921 PIEs/Cookies/Macromedia/Flash #msg-9412363 PerformanceTips for WinXP #msg-9854670
| Volume | |
| Day Range: | |
| Bid Price | |
| Ask Price | |
| Last Trade Time: |


