 News
News  Market Data
  Discover
Support: 888-992-3836
Copyright © 2023 InvestorsHub Inc.


Register for free to join our community of investors and share your ideas. You will also get access to streaming quotes, interactive charts, trades, portfolio, live options flow and more tools.
Speculators have built the largest Brent Oil short position since 2020
By: Barchart | May 30, 2024
• Speculators have built the largest Brent Oil short position since 2020.

Read Full Story »»»
 DiscoverGold
Crude Oil Drops Further into Consolidation Range
By: Bruce Powers | May 30, 2024
• Crude oil's failed breakout above 81.00 leads to bearish continuation, with key support levels and a broadening pattern in focus.
Crude oil attempted to break out of a consolidation bottom on Wednesday with a new 20-day high of 81.00, a whole number. Resistance was quickly encountered off that high leading to a weak close yesterday, and a bearish continuation today, Thursday. Tuesday triggered an upside breakout above the 200-Day MA and downtrend line. Each was a sign of strength. However, upside follow through never happened and instead sellers took back control.

Broadening Formation Continues to Form
So, there is a potential bottom or bearish continuation broadening formation that has formed. It can breakout in either direction. Purple lines mark the boundary of the pattern, and they point away from each other. It is a consolidation pattern where volatility expands over time rather than contracts. Each line was already established from prior price action, and the top line provided a short-term upside target. Therefore, the lower line is a potential target for the pullback that is just starting. The current low of the pattern is 76.60 and support represented by the lower declining boundary line is slightly lower.
Since the advance earlier in the week could not hold onto gains following an attempt to breakout above key resistance lines, the downtrend remains dominant. That would include both the near-term downtrend as well as the longer downtrend that began from the March 2022 peak. Nonetheless, a 61.8% Fibonacci retracement completes at 75.49 for the downside.
Bottom Boundary Line Support Target
For a bullish scenario, support should be seen either before 76.60, around it, or near the lower boundary line. Aggressive traders will likely look to enter off that lower line if crude falls that far. The 200-Day MA is at 80.15 and presents a benchmark level to watch on the upside. However, be aware that crude oil is more recently within a large symmetrical triangle consolidation type pattern as the price range narrows. This means the 200-Day MA trending indicator is not as reliable as it would be in a more trending environment. But, in this case it has converged with the long-term downtrend line and can be used from that perspective, as a key pivot.
Read Full Story »»»
DiscoverGold
Natural Gas Faces Possible Double Top Amid Bullish Signs
By: Bruce Powers | May 30, 2024
• Natural gas may form a double top at 2.85, with the 20-Day MA nearing a bullish crossover above the 200-Day MA, indicating potential demand strength.
Natural gas continued to pull back on Thursday, filling yesterday’s gap before hitting a low of 2.57 for the day. That led to an intraday bounce, which continues. Yesterday’s high of 2.85 looks like it may be a second top thereby setting up a possible double top pattern.
Meanwhile, the 20-Day MA continues to strengthen and is close to crossing above the 200-Day MA. Those two moving averages together provide a more solid potential support zone than either on their own, at 2.46 and 2.44, respectively. A bullish crossover of the 20-Day line above the 200-Day line will provide another sign that underlying demand for natural gas is strengthening.

Possible Double Top
The potential double top pattern is triggered by a drop below the recent swing low of 2.48. Of course, the two moving averages are close by as well. Therefore, all three levels must be busted to the downside to indicate a decisive bearish trigger for the double top that may be sustainable. Given the significance of the support zone that would be busted an accelerated decline may follow. Potential support levels below 2.48 include a price zone from 2.25 to 2.23, defined by the 50% retracement and prior swing low from December, respectively. Further down is the all important 50-Day MA at 2.05.
Weekly Bearish Candlestick Pattern
In addition, last week ended with a bearish shooting star weekly candlestick pattern. It triggered this week briefly but quickly recovered. A second decline below last week’s low of 2.49 may not be so forgiving. Of course, that level should be used along with the other price support levels noted above.
Upside Breakout Starts Above
Notice that the second top from yesterday 2.85 was lower than the first at 292 and tracked resistance around the top declining trendline with a lower high. A decisive rally above Wednesday’s high will provide a sign of strengthening and increases the chance for a retest of resistance around the trendline. Of course, that would also open the door to a possible breakout above the line. Once that occurs last week’s top is at risk of being broken to the upside. That would trigger a continuation of the developing rising trend as well.
Read Full Story »»»
DiscoverGold
OILBRENT
Brent Oil
82.255
-1.12 (-1.34%)
Volume: 1
Day Range: 82.165 - 83.575
Last Trade Time: 12:35:22 PM EDT
Crude Inventories Declined By 4.2 Million Barrels
By: Vladimir Zernov | May 30, 2024
Key Points:
• Strategic Petroleum Reserve increased from 368.8 million barrels to 369.3 million barrels.
• Domestic oil production remained unchanged at 13.1 million bpd.
• Oil markets are losing some ground as traders react to the EIA report.
On May 30, 2024, EIA released its Weekly Petroleum Status Report. The report indicated that crude inventories declined by 4.2 million barrels, compared to analyst consensus of -1.95 million barrels. At current levels, crude inventories are about 4% below the five-year average for this time of the year.
Gasoline inventories increased by 2.0 million barrels, while analysts expected that they would decline by 0.4 million barrels. Distillate fuel inventories grew by 2.5 million barrels.
Crude oil imports increased by 106,000 bpd, averaging 6.8 million bpd. The four-week average for crude oil imports is 6.8 million bpd.
Strategic Petroleum Reserve increased from 368.8 million barrels to 369.3 million barrels as U.S. continued to buy oil for reserves.
Domestic oil production remained unchanged at 13.1 million bpd. Current oil price levels are not attractive to raise production above current levels.
WTI oil is trying to settle above the $79.00 level as traders react to the EIA report. While the significant decline in crude inventories is a bullish sign, rising gasoline inventories may put some pressure on the market. At this point, WTI oil needs significant positive catalysts to settle above the nearest resistance level at $79.00 – $80.00.
Brent oil settled near the $83.00 level after the release of the EIA report. The technical picture for Brent oil remains unchanged as it needs to settle above the resistance at $83.50 – $84.50 to gain sustainable upside momentum.
Read Full Story »»»
DiscoverGold
Punching Bowl. The Energy Report
By: Phil Flynn | May 30, 2024
Take away the punch bowl just as the party is getting started! Fed Officials did not like the Memorial Day price explosion in the commodity complex and did their best to cool off expectations by threatening an interest rate hike to spoil the party. Minneapolis Fed President Neel Kashkari put it best when he said yesterday that, ”Interest-rate hikes aren’t out of the question” and added “If we get surprised by the data, then we would do what we need to do” like whatever it takes, I guess. We know that Neel and his colleagues continually get surprised by data quite often, so the markets retreated.
Even oil, after what most would say was somewhat bullish data from the American Petroleum Institute, seems to have lost the demand driven momentum that started this new week. The API seemed to make up for lost time with a whopping 6.490-million-barrel crude oil draw that was led by a long-awaited 1.706 million barrel drop from the Cushing OK delivery point. That came on the backs of reports of record demand for air travel as TSA reported an all-time high number of passengers at US checkpoints and automobile travel and farmer demand from planting over the weekend. Corn planting that was way behind caught up with 83% planted as of May 26, 2024, just ahead of the 5yr average of 82%.
Surprisingly, we saw a 2.45-million-barrel increase in distillate inventories even with all that demand. That raised some eyebrows about the overall data.
Gasoline inventories came in pretty much in line with expectations, dropping about 452,000 barrels last week.
Now today, because of the holiday, we will see the inventory numbers at 10:00a central time from the Energy Information Administration (EIA). I expect that if the EIA shows similar data. At the end of the day, the markets should shake off their concerns about what the Federal Reserve may or may not do when it comes to interest rates. The reason why I believe that is more than likely is that a large crude drawdown in supply could be the first of many in the coming weeks.
The market will also look at gasoline demand very closely to see if the momentum that we saw in last week’s report continues. Crack spreads have been relatively weak for gasoline.
Oil may also garner some support from OPEC Plus their favorite co-conspirator Russia. The word on the street is at the cartel is debating about prolonging the oil supply cuts amid rising global oil inventories. It seems like the cartel is concerned that we saw some crude builds here in the United States which was a bit of a surprise. Also, there is more talk about commitment by OPEC cheaters to offer compensation cuts for their overproduction. Saudi Arabia is leading the cartel and is continuing to curtail their oil production. JODI said that Saudi Arabia’s crude production fell by 38 kb/d in March to 8.97 mb/d while its crude exports rose by 96 kb/d to 6.41 mb/d.
Geopolitical risk factors for oil continue to simmer in the background. Another disturbing story about the possibility of escalation in the Russia Ukraine conflict is making many people cringe, raising the possibility that the US could be drawn into a more active role in the conflict. Not only did the Biden administration consider sending U.S. military advisers to train Ukrainian troops in Ukraine, not dissimilar to how we sent advisers to Viet Nam. Now there’s reports that US Secretary of State Anthony Blinken suggested that the US might allow Ukraine to use American made weapons for strikes inside of Russia. That would be a dangerous policy shift and would raise the stakes and the possibility of the war growing beyond the current battlegrounds. It also increases that the odds that the college students protesting against Israel might have to change to protesting stopping the draft because that could be next if things keep going the way they’re going with this administration.
Now don’t tell Joe Biden the fossil fuels may be with us a lot longer than people think. It might make him start screaming again. Yet in the energy space guys like Warren Buffett are really betting on long term oil which place like Occidental, and we continue to see mega deals in the energy space. The Wall Street Journal reports that, “ConocoPhillips COP -3.12%decrease; red down pointing triangle has agreed to acquire Marathon Oil MRO 8.43%increase; green up pointing triangle in an all-stock deal valued at $17.1 billion in a bid to catch up with rivals as drillers race to secure new oil and gas wells. Under the terms of the agreement, Marathon Oil stockholders will exchange each share for 0.255 shares of ConocoPhillips, representing a nearly 15% premium based on Marathon Oil’s closing share price on Tuesday. The deal allows ConocoPhillips to expand its presence in several key U.S. shale basins including in Texas and North Dakota.
For the entire oil complex, we are looking to see demand numbers start to turn up. The reason why the market is conflicted and caught in a trading range is because they are not sure that they should focus on current fundamentals or what may happen with demand if the Fed decides to increase interest rates. From my perspective I think it’s unlikely that the Federal Reserve will be able to raise interest rates especially with an election ahead. The flipping back and forth on rate expectations is keeping the oil market subdued.
If demand starts to perk up in the US, China and India, which it looks like it’s going to do, then I think that we are very close to the bottom. Reuters is reporting that, “Asia’s imports of crude oil rose to the highest in 12 months in May, with the strength being driven by India as the region’s second-biggest buyer is on track to see record arrivals. The world’s top crude importing region is expected to have arrivals of 27.81 million barrels per day (bpd), up from 26.89 million bpd in April, according to data compiled by LSEG Oil Research. That’s an increase of 920,000 bpd month-on-month, with the bulk of the gain being accounted for by India, where imports are expected to rise to an all-time high of 5.26 million bpd, up 710,000 bpd from April’s 4.55 million bpd.
The other deal with traders is keeping an eye on is Saudi Arabia’s further listing of shares to own a part of Saudi Aramco. Rumors have the listing at the value of the listing is estimated to be around $10-$11 billion.
Amena Bakr is reporting that the announcement for the Aramco listing is likely to happen today after the market closes- sources familiar with the matter are telling her.
Once again hedgers probably should use this dip to put on some longer-term positions, we really expect to see a big surge in prices at some point later in the year.
Natural gas prices pulled back after the incredible comeback. The key today will be the report that will be released on time at 9:30 central Standard Time. Reuters is reporting that US utilities added a smaller than usual 78 billion cubic feet of natural gas and this storage last week as low prices earlier this year controllers to cut output. The 78 billion cubic feet injection compares with an injection of 106 BCF during the same week a year ago and average of 104 BCF in recent weeks the market has been surprised by this number and has been a catalyst for the market to move higher if once again this number comes out on the bullish side of the equation, we would expect natural gas to make new highs for the move.
Long term the demand outlook for natural gas looks strong from the liquified natural gas front as well as power generation. In the United States we still must keep in mind that we’re heading into hurricane season and that could impact natural gas demand either positively or negatively, depending on when and if these storms hit and where they hit.
Gas output in the Lower 48 U.S. states fell to an average of 97.7 billion cubic feet per day (bcfd) so far in May, down from 98.2 bcfd in April, according to financial firm LSEG. That compares with a monthly record of 105.5 bcfd in December 2023. There were 63 total degree days (TDDs) last week compared with a 30-year normal of 63 for the period, according to data from financial firm LSEG. TDDs measure the number of degrees a day’s average temperature is above or below 65 degrees Fahrenheit (18 degrees Celsius) to estimate demand to cool or heat homes and businesses.
Food inflation has been a big issue and cattle prices are probably going to continue to break record highs. Yet cattle fell on a report that China was blocking US beef shipments from the JPS meat plant in Greeley Co. The reason why is China blocked the beef shipments because they identified traces of a feed additive called Ractopamine which has been approved for use in the United States but not in China or in the European Union for that matter.
Read Full Story »»»
DiscoverGold
Commodity Trading Advisors (CTAs) currently hold a bullish view on oil
By: Isabelnet | May 30, 2024
• Oil
Commodity Trading Advisors (CTAs) currently hold a bullish view on oil

Read Full Story »»»
DiscoverGold
Commodities Daily Market Movers (% Price Change)
By: Marty Armstrong | May 30, 2024
• Top Movers
LME Aluminum Alloy 14.05 %
Cocoa (NYCSCE) Futures 6.03 %
Oats (CBOT) Futures 1.96 %
Tokyo Silver Futures 1.9 %
Kuala Lumpor Palm Oil Crude Futures 1.87 %
• Bottom Movers
NY Natural Gas Futures 5.63 %
Cheese 2.69 %
Cotton 2.53 %
Orange Juice (NYCE) Futures 2.05 %
Sugar World (CSCE) Futures 2.03 %
*Close from the last completed Daily
DiscoverGold
Natural Gas Faced Resistance After Strong Opening Surge
By: Bruce Powers | May 29, 2024
• Natural gas continued to strengthen after testing 200-Day MA support, but bearish reactions raise uncertainty about the uptrend’s sustainability.
Natural gas continued to strengthen on Wednesday, following a successful test of support around the 200-Day MA earlier in the week. The high of the day was 2.85 and it was reached on a gap at the opening of the session. It provided a retest of resistance around recent highs. Last Thursday a trend high of 2.92 was reached before sellers took charge and a pullback began. Although today’s high shows remaining strength in demand for natural gas, resistance was seen following the high and the sellers took back control. At the time of this writing trading continues near the low of the day, which was 2.655.

Failure Following Strong Opening is Bearish Behavior
Such a bearish reaction to a strong opening is not bullish behavior. It creates further uncertainty as to whether the uptrend may have more upside to go before a deeper retracement, or if today creates a second high that leads to a bearish continuation. The 200-Day MA at 2.46, along with the recent swing low of 2.475 are the near-term price levels to watch for support. However, a retest of support around the 200-Day line could lead to a failure and a deeper retracement that targets lower price levels.
Correction Can Include a Retracement and/or Consolidation
The correction, if it does continue, could take place with a deeper retracement or consolidation. As of today, a possible consolidation range would have a high of 2.92 and a low of 2.475. But since the 200-Day line is so close to the recent swing low, they can be watched together. Notice what is happening with the purple 20-Day MA. It is rising and heading towards the 200-Day line. If natural gas further consolidates above the 200-Day line, the 20-Day line may continue to rise. It is leaning towards a possible crossing above the 200-Day line, which would be bullish overall and a sign that demand is improving. The 20-Day MA is now a match with the 38.2% Fibonacci retracement at 2.41.
20-Day MA is Current Trend Support to Watch
For the current advance the 20-Day line is the key trend support line to watch during weakness. If it remains a support boundary the chance for a continuation higher in the price of natural gas remains. Alternatively, a drop below the line increases the chance to a test of support at lower prices. The 50-Day MA at 2.03 being one of the lower price levels. That should be the maximum of a retracement, but certainly support can be seen higher.
Read Full Story »»»
DiscoverGold
$WTIC $OIL - We may see a final wave in a Bull 'Wedge' play out to the $75 level (Final Target from that 'H&S')... (Gold)
By: Sahara | May 29, 2024
• $WTIC $OIL - Popped the Dn/Trend Channel (Gold).
But still not convinced, as we may see a final wave in a Bull 'Wedge' play out to the $75 level (Final Target from that 'H&S')...

Read Full Story »»»
DiscoverGold
Can’t Keep Them Down. The Energy Report
By: Phil Flynn | May 29, 2024
Despite some of the most challenging inflationary conditions in many Americans lifetime, it seems you cannot keep that American Spirit of adventure down. Oil markets are coming back from a big uptick in US consumer confidence that surged to 102% according to the Conference Board. That was accentuated by a record amount of air travelers and a surge in gasoline demand from the USA, the world’s leader in travel. A report the from the UN World Tourism Organization that said that the US regained that title from China. OPEC Plus will at the very least reaffirm voluntary cuts with the outside of and extension and perhaps announcement of compensation cuts.
Oh, sure we saw a report from the International Monetary Fund that raised their forecast for China economic growth to 5% from 4.6% which today if offsetting concerns about Chinese oil demand. The market has been disappointed with reduced refinery runs in China for plastics production and their manufacturing, but domestic demand remains strong. The IMF suggested that that China’s economy has exceeded their expectations and now with China’s biggest cities rolling out major easing of conditions for homebuyers, that could support the economy even more not to mention more oil demand as well.
Now if we look to India there are more reports and suggestions that India’s demand for oil and natural gas are going to absolutely surge in the coming months and years. S&P global raised its outlook for India’s economy to positive from stable and this of course means that their growing appetite for oil and natural gas is going to grow. That will create a very tight global market later in the year and price might not matter.
Petroleum Economist says that even with oil surges to over $100 a barrel, it’s possible that India’s oil demand will continue to grow. The Petroleum Economist is saying that India is expected to register steady growth in crude oil consumption during 2024 given its ability to shrug off relatively high prices.
Analysts and officials believe prices would need to rise significantly and for a sustained period of time to start really hurting demand. The data so far this year backs up this assertation: there has already been solid growth in demand for crude oil and finished products during the first four months of the year despite prices being well above $80/bl.
There seems little to fear in terms of demand destruction. From January to April, India’s appetite for oil has barely been quelled. Consumption increased by 4.8% during that time compared with the same period. And it is not just oil. It is India’s demand for natural gas. Reuters is reporting India’s natural gas demand will surge 7% on stronger demand industrial demand fertilizer.
Side issues that seem to be supporting are reports that the Buzzard oil field in the North Sea is experiencing a temporary production outage that will reduce oil production maybe by as much as 60,000 barrels of oil a day.
Political risk factors are also rising and inexplicably there are reports that the Biden administration is standing up for Iran and their nuclear program. It’s almost as if like the Biden administration wants Iran to get nuclear weapons. The New York Post reports that, “The White House is begging Britain and France not to formally rebuke Iran over the theocracy’s growing nuclear program. Administration officials have been pressuring the US allies and other European nations to vote against censuring Iran at a meeting of the International Atomic Energy Agency’s (IAEA) board of governors next month, diplomats close to the discussions told the Wall Street Journal.” The US is also preparing to abstain from the IAEA vote, the diplomats added, with some suggesting censure could further destabilize Iran following the death of its president, Ebrahim Raisi, in a May 19 helicopter crash.” If I were the Biden administration, I wouldn’t worry about that. I think Iran could use a little destabilizing myself. Then they maybe they couldn’t use their increasing oil revenue that has exploded under the Biden administration to fund terror groups like Hamas, Hezbollah and the Houthi rebels who attacked more ships in international waters.
The other concern of course for oil and natural gas is going to be the weather. Hurricane season is starting and already the National Hurricane Center has its eye on the potential of the developments of storms as we start the hurricane season June 1st. Yesterday the National Hurricane Center was monitoring three tropical waves, yet they do not seem to be developing into anything yet. Weather in the Atlantic is very conducive for the possibility of an early start to the hurricane season. We’ve already seen the weather conditions cause havoc with the slew of tornadoes.
Fox Weather is reporting that powerful thunderstorms rocked the Dallas-Fort Worth Metroplex on Tuesday, leaving more than 800,000 utility customers in the dark as severe weather barreled across the region and produced baseball-sized hail, hurricane-force wind gusts and significant damage in several communities.
If your power is out, can you change your electric car? Anas Alhajji give us an electric car update by pointing out that Toyota EV sales increased in Q1 by a whopping 86% year over year!!! That 86% = 1,617 cars! Whoopee! At that rate maybe the Biden administration’s billion-dollar car charger can actually meet that type of demand.
Read Full Story »»»
DiscoverGold
Crude Oil Poised for Bullish Continuation Amid Breakouts
By: Bruce Powers | May 28, 2024
• WTI crude oil shows strength, challenging the 80.64 consolidation high, and breaking above key price levels, indicating potential upside continuation.
WTI crude oil shows signs of strength today and challenges the consolidation high of 80.64. It looks like crude oil is starting to decide how it will resolve recent uncertainty as seen over more than two weeks of consolidation. It is showing strength as it broke out above several price levels today and is on track to close strong, in the top quarter of the day’s range and above each of the price levels, including the 200-Day MA.

False Breakdown Leads to Sharp Rally
Today’s advance is the third day up after crude oil triggered a false breakdown from recent consolidation last Friday. Buyers subsequently took charge and have managed to see the price of crude advance into the third day, today. The bullish continuation today has taken crude oil above both the downtrend line and purple 20-Day MA, as well as the uptrend line.
Notice that the 20-Day MA and downtrend line mark a similar price of 79.11 around the breakout area. In other words, a significant pivot level has been busted to the upside. Today bullish price action points to likely upside continuation.
Attempting Four-Week Breakout
Again, today the high is marked as potential resistance by two price levels, the most recent swing high at 80.64 and the long-term downtrend line. It is also a weekly high. The downtrend line starts from the March 2022 peak of 130.61. A decisive rally above 80.64 will trigger a bullish continuation on both the daily and weekly chart, which will be confirmed on a daily close above that price level. Once that happens, in the short term the next higher target would be the 50-Day MA at 82.04.
Watch Long-Term Downtrend Line
The long-term downtrend line has some significance for crude oil. It was initially broken to the upside on April 1, but it subsequently failed to hold as support and a breakdown occurred on April 30. That was followed by a correction to last week’s low. A second bullish breakout of a long-term trendline is bullish. That happened today and will likely be confirmed by a daily close above the line.
Read Full Story »»»
DiscoverGold
Natural Gas Likely Test of Resistance Before Return to Key Support Levels
By: Bruce Powers | May 28, 2024
• Natural gas is expected to retrace and consolidate after a 92% advance, with key support at the 200-Day MA around 2.46.
Key support for natural gas remains around the 200-Day MA at 2.46. It has been bouncing from that price area following a pullback low of 2.475. Given the sharp 92% advance that culminated with last week’s high of 2.92, natural gas is due for a period of retracement and consolidation. It looks like it has started.
If correct, the advance off the area around 200-Day MA will eventually be met with resistance that turns the price of natural gas back down to retest support around the 200-Day line, and possibly fall below it. Certainly, given recent volatility a drop through the 200-Day MA, even if it is brief, would not be a surprise.

Bounce Into Resistance
Areas to watch for resistance during a bounce includes a price zone from 2.61 to 2.63. That zone encompasses support seen on two different days out of the previous three. Friday’s low provides the 2.63 price level. If natural gas can close above Friday’s 2.71 high, it may have a chance to test recent highs. Otherwise, the expectation is for resistance to be seen on the bounce, followed by a deeper pullback or at least a retest of the 200-Day line.
Potential Bearish Weekly Candle Remains
As noted yesterday, last week natural gas completed a bearish shooting star candlestick pattern and ended near the lows of the week’s trading range. It is matched by the 50-Week MA, currently at 2.50. Therefore, the 200-Day line on the daily chart also represents the 50-Week MA. Since they are together, this week’s low of 2.475 takes on greater significance as the breakdown below it indicates a failure of two long-term moving averages to hold as support. A daily close below 2.475 will confirm the breakdown and increase the chance for an eventual test of lower price levels.
Lower Price Levels
The first lower price area to watch is around the 20-Day MA at 2.73. That moving average is a key trend indicator for the current sharp trend. It has not yet been tested as support since a gap above it on April 26. Therefore, it is due to happen. Keep in mind that the line is rising, and the price represented by the line when approached may change. Below the 200-Day line is a prior interim swing low 2.31. But the 50% retracement at 2.25, along with a more significant swing low of 2.235 from December 2023, have identified a similar price zone.
Read Full Story »»»
DiscoverGold
$USO - It has been a while since we posted about #USO but once it came very close to our targets in early April we exited and it has been correcting since
By: Intelligent Investing | May 28, 2024
• $USO
It has been a while since we posted about #USO but once it came very close to our targets in early April we exited and it has been correcting since.
However, today, it features a nice technical breakout and we expect the blue 50d SMA and upper red dotted DT line to be reached, at least, potentially much higher if it can clear the Ichimoku Cloud! Contingent on holding above the red 200d SMA.

Read Full Story »»»
DiscoverGold
jxyzobrien good to hear from you again. I am descending into my posting career but I will continue to post as time permits. Stay focus as the market should do well until 2032. Beyond that God help us.
DiscoverGold
Off With a Bang. The Energy Report
By: Phil Flynn | May 28, 2024
The summer travel season started off with a bang. Energy markets, at least for the moment, decided to quit worrying about what the Fed may or may not do with interest rates and decided to focus on supply and demand. Oil and products are rising with increased oil and product demand expectation, rising geopolitical risk, as well as another drop the US rig count. Gasoline demand surged back of 9 million barrels a day according to EIA last week and evidence suggests that for at least the start of summer, demand might live up to lofty expectations even as bad weather put a damper on many beach plans along the Northeast over Memorial Day. AAA did predict demand for petroleum might have hit a 20 year high for this past weekend as Americans took planes, trains and automobiles.
The U.S. Transportation Security Administration (TSA) got the holiday oil buying party started after they said they screened 2.95 million airline passengers on Friday, the highest number ever on a single day. The record travel coincides with the Memorial Day weekend that marks the beginning of the U.S. summer travel season. Last week, a group representing major U.S. airlines forecast record summer travel with airlines expected to transport 271 million passengers, up 6.3% from last year. That means, more than likely, strong jet fuel demand will continue. Last week the EIA put jet fuel demand up 3.6% compared with the same four-week period last year according to Reuters.
We also have a report about oil demand in China rising by 1.3 million barrels a day in March according to JODI. While that was down year over year that is still very strong, but this may be one reason why Saudi Arabia is lowering the cost of oil to Asia for the first time in five months. The July official selling price (OSP) for flagship Arab Light crude is expected to fall by 30 to 50 cents a barrel, a Reuters survey of five refiners showed, after hitting a five-month high in June. Normally the market would take this as a negative but so far, not. It’s very possible that Saudi Arabia’s move is to regain market share, but they have given up after raising prices in the last couple of months to places like Russia.
Which leads us to the upcoming all-important June 2nd OPEC Plus meeting. As you might remember, after it was announced that the meeting went from an in-person meeting in the beautiful hotels of Vienna to an online meeting, oil traders went short on the assumption that the status quo was going to stay in place until the end of the year and there would be no surprises. So, the market expectations are that OPEC plus would do something dramatic were dampened. Now there’s growing optimism that we may get commitments from OPEC cheaters to extend their production cuts past 2025 to make up for previous cheating. Amena Bakr says that the expectation is that the 8 states that offered voluntary cuts will extend them, with a possibility of further action to support the market.
Some people were concerned about the boasts by Iraq that they planned to increase their oil production capacity to over 4 million barrels a day. That’s a negative but that is a problem for another day and not at this OPEC meeting.
The Biden administration has been a big boost for Iran’s oil production. Energy Tidbits pointed out that, “Today Iran, interim president, Mohammad Mokhber, that took over after the death of Ebrahim Raisi said that one of the greatest achievements of his predecessor was increasing Iranian oil production to 3.6 million barrels a day. He is also now bragging that Iran will hit a production level of four million barrels a day shortly.
Geopolitical risk factors for oil remain high yet the market isn’t adjusting for it because so far there’s been no major disruptions to supply. Even more attacks by the Houthi Rebels on shipping over the weekend failed to move the needle.
Over the weekend, exchange of fire between Israel and Egypt made the headlines. The Wall Street Journal reported that, “Biden is facing fresh political tension at home following an Israeli airstrike on Rafah that Palestinian authorities said killed dozens of civilians. Israel said the strike killed two top Hamas officials, but Palestinian authorities said it also led to the deaths of at least 45 Palestinian civilians and wounded others, including women and children. Israeli Prime Minister Benjamin Netanyahu called the civilian deaths a “tragic mistake” and promised to investigate.
China is calling out the United States and our support for Taiwan independence. After completing war games near Taiwan with live ammunition, China is signaling that they’re getting closer to a possible confrontation. Fox Business reported that Taiwan’s opposition-controlled legislature passed changes that favor China and reduce the power of the island’s president. The changes, pushed by the opposition Nationalist Party, give the legislature greater power to control budgets, including defense spending. The Nationalist Party, which supports unification with China, took control of the legislature with a single-seat majority after the January elections.
Bloomberg reported that, “Iran increased its stockpile of near bomb-grade uranium, a move that could flame tensions across the wider Middle East as Tehran prepares to hold presidential elections next month.
It’s the first nuclear-safeguards assessment since Iran’s president and foreign minister died in a helicopter crash just days after top officials from the United Nations’ atomic watchdog traveled to the country to secure greater cooperation in their monitoring efforts. International Atomic Energy Agency inspectors verified on Monday that Iran’s stockpile of highly enriched uranium rose 17% over the last three months, according to a nine-page, restricted report circulated among diplomats and seen by Bloomberg. That’s enough uranium to fuel several warheads should Iran make a political decision to pursue weapons.”
Bloomberg also touted over the weekend that wind and solar is going to boost US power plant capacity by 80% by the year 2035. Yet Art Berman, noted oil analyst, reacted and pointed out that we have to put that in perspective and pointed out renewables will then account for 2.2% of US energy consumption delivered. So, the death of fossil fuels consumption has been greatly exaggerated. Investment dollars that were turning away from oil and gas are starting to creep back in because reality sometimes is better than the alternative.
Natural gas is back on the rise as crazy weather over the Memorial Day weekend and the beginning of what could be a very interesting summer. Not only is the market looking ahead to near term forecasts that are calling for above normal temperatures in many parts of the country, we are also getting warnings from many private forecasters of a very active hurricane season. Suddenly, the natural gas market is starting to look a little bit better even though we still have some oversupply. Rig Zone reported that North America added two rigs week on week, according to Baker Hughes’ latest rotary rig count, which was published on May 24. Although the U.S. lost four rigs week on week, Canada added six during the same period, leading to a total North America rig count of 720, comprising 600 rigs from the U.S. and 120 rigs from Canada, the count outlined.
Of the total U.S. rig count of 600, 579 are classified as land rigs and 21 are classified as offshore rigs. The total U.S. rig count comprises 497 oil rigs, 99 gas rigs, and four miscellaneous rigs, the count showed. Horizontal rigs made up 537 of the total U.S. rig count, directional rigs made up 43, and vertical rigs made up 20, Baker Hughes revealed. Week on week, the U.S. added one offshore rig and dropped five land rigs, Baker Hughes’ count outlined. The country cut four gas rigs and eight horizontal rigs, and added two directional and two vertical rigs, week on week, the count showed.
Read Full Story »»»
DiscoverGold
Natural Gas Tests 200-Day MA Support After Strong Rally
By: Bruce Powers | May 27, 2024
• After a 92.1% rally, natural gas approaches the 200-Day MA at 2.46, indicating a potential correction phase and testing critical support levels.
Natural gas further flirts with potential support around the 200-Day MA, currently at 2.46, as the low for the day was 2.475. The 200-Day MA is an obvious area to test for support as this is the first time that it has been approached since the bullish breakout of the line on May 16. It is common for the first test of a moving average as support frequently sees signs of support. However, natural gas is correcting from a strong advance that completed a 1.40 point or 92.1% rally in 13 weeks.
That is an aggressive advance that exceeds all prior rallies since the 10.03 peak in 2022. It has been overdue for a correction and has more than likely only just begun a retracement or consolidation phase. So, the behavior of natural gas around the 200-Day line is important for the short-term as the reaction should provide clues as to what might come next.

Weekly Chart Looks Bearish
Moreover, the weekly chart needs to be considered. Last week ended with a bearish wide ranged red shooting star candlestick pattern with the closing price essentially the low of the week. That low stopped at support seen at the 50-Week MA. Currently, the 50-Week MA is at 2.50. It was broken to the downside briefly today to reach a low of 2.475 before there was a minor intraday bounce.
Since both the 200-Day MA and 50-Day MA identify a similar potential support zone from 2.50 to 2.46, it may have added significance. Nevertheless, a decisive drop through 2.46 has natural gas heading first towards the 20-Day MA at 2.37 followed by a prior interim swing low at 2.31. A more likely lower price target though looks to be around 2.25 to 2.23. That zone is derived from the 50% retracement and a previous swing low from December 13.

Correction May Just Be Getting Started
Natural gas has been tracing out a declining trend channel that is shown on the chart with dashed declining blue trendlines. Since it hit the top of the channel last week and rejecting price to the downside, the lower area of the channel becomes a potential target. Also, if the 20-Day MA fails to retain support and natural gas drops below it and stays below it, the 50-Day MA at 2.01 becomes a target. It is a match with the prior top of the symmetrical triangle bottom pattern.
Read Full Story »»»
DiscoverGold
hope all is well
everyone enjoyed your previous board
i am doing good and about to zoom
tim ord has been amazing
Crude Oil Continues to Find Support
By: Christopher Lewis | May 27, 2024
• The crude oil market continues to see a bit of support underneath, as there have been plenty of trade executed in this general area. The market will be noisy, but in the end, I think the buyers are forming a floor.
WTI Crude Oil Technical Analysis
Taking a look at the four hour crude oil chart, you can see that the West Texas Intermediate crude oil market has rallied a bit during the Monday session. But keep in mind that it’s also Memorial Day in the United States, so there’s a lot of liquidity issues. So, I don’t read too much into the candlestick of the early hours in North America, but what I look into is the fact that we have found support at an area where we needed to find it in the form of roughly $77.
At this point, I think it’s likely that the market could go looking to the $80 level above. But with that being said, I do think that we’ve got a scenario where you have to be cautious and recognize that a lot of choppiness will be the norm. This time of year, is typically very bullish for crude oil, so I’m perfectly fine buying it, but I do recognize that it’s not necessarily going to be the easiest market to deal with.
Brent Crude Oil Technical Analysis
Brent markets look very much the same. If we can break above the $83 level, then I think it brings in a rush where we try to get to $84.50. Short-term pullbacks continue to be buying opportunities as there will be a lot of demand for crude oil.
And of course, there are a lot of geopolitical concerns in the Middle East as per usual. With that being the case, I think it makes a lot of sense to be a buyer of dips and to not worry about shorting the market at all.
Read Full Story »»»
DiscoverGold
WTI Crude Oil CoT: Peek Into Future Through Futures, How Hedge Funds Are Positioned
By: Hedgopia | May 25, 2024
• Following futures positions of non-commercials are as of May 21, 2024.
WTI Crude Oil: Currently net long 255.3k, up 21.8k.

For the second consecutive week, a rising trendline from last December when West Texas Intermediate crude bottomed at $67.71 was breached intra-week but defended by the end of the week. The difference this time was that the crude ended the week right on it, with oil bulls buying Friday’s low of $76.15 to push the session up 1.1 percent to $77.72/barrel. With this, they also defended short-term horizontal support just south of $77.
The crude has faced difficulty at $80 for three weeks now. Back then, WTI fell back into a well-established range between $71-$72 and $81-$82 that persisted for 19 months before the upper end gave way a couple of months ago. Oil bulls need to at least charge toward the upper range sooner than later. Else, they risk a breach of the December trendline.
In the meantime, US crude production in the week to May 17th was unchanged for 11 consecutive weeks at 13.1 million barrels per day; 13 weeks ago, output was at a record 13.3 mb/d. Crude imports decreased 81,000 b/d to 6.7 mb/d. As did gasoline inventory, which dropped 945,000 barrels to 226.8 million barrels. Stocks of crude and distillates went the other way, up 1.8 million barrels and 379,000 barrels respectively to 458.8 million barrels and 116.7 million barrels. Refinery utilization increased 1.3 percentage points to 91.7 percent.
Read Full Story »»»
DiscoverGold
Small Speculators in Crude Oil Are Still Eager
By: Tom McClellan | May 24, 2024

Every Friday in my Daily Edition, I cover some of the interesting insights in the weekly Commitment of Traders (COT) Report, published on Fridays by the Commodity Futures Trading Commission (CFTC). That report lists the totals of trader positions in different categories for 314 different futures contracts (at last count). This week's chart looks at the net position of the "non-reportable" traders of crude oil futures.
The non-reportable category has that name because the traders in that category have positions which are so small that the CFTC figures they are not worth tracking individually. The CFTC really wants to know how many contracts Exxon and Chevron own, as well as the big hedge funds. But the small traders with a handful of contracts are not worth tracking.
Generally speaking, the non-reportable category of futures traders in all contracts are the hot money, and they are usually wrong when they get to an extreme. In crude oil, this group also tends to be affected a lot by whatever prices are doing. They pile in during rallies, and get scared away during selloffs.
One important note about the non-reportable traders of crude oil futures is that they are nearly always net long to varying degrees. Every futures contract is simultaneously 1 long position and 1 short position, held by different parties. The trader who is short is committed to make delivery at the contract expiration date, and the trader who is long is committed to take delivery. Or they can trade out of those positions before expiration (they hope). Each group in the COT Report (commercial traders, non-commercial, and non-reportable) holds some number of long positions, and some number of shorts. The difference between those is their net position.
The last time that the non-reportable traders of crude oil futures were actually net short as a group was all the way back in November 2019, which is off the left end of this chart. This bias toward the long side means that when we go to interpret their current net position, we have to account for how they are normally positioned. One should never make judgements based just on the raw number of contracts, but rather look at a chart to get context.
What is really interesting right now is that crude oil prices have been falling, but the non-reportable traders have been moving toward a bigger net long position. That is irregular, but not unprecedented. What this means is that their change in sentiment is not coming about due to the normal pressures of price movements, but rather out of pure speculation. And that is the most important type of sentiment.
When we have seen a spike up in their net position like this during price drops, it usually means that there is more to come for falling prices. Some examples are highlighted in the chart above. The message is that the amount of price decline we have seen thus far has not been long enough or hard enough to get the small speculators to abandon all hope. So it has more work to do.
At the point when these small speculators decide that they cannot stand it any more, and start aggressively bailing out of their collective net long positions, then we can say that a price bottom is probably at hand. But oil is not there yet.
Tom McClellan
Editor, The McClellan Market Report
Read Full Story »»»
DiscoverGold
NY Crude Oil Futures »» Weekly Summary Analysis
By: Marty Armstrong | May 25, 2024
Next Monday is Memorial Day, which is a holiday in the United States. NY Crude Oil Futures closed today at 7772 and is trading up about 8.47% for the year from last year's settlement of 7165. Caution is required for this market is starting to suggest it could now decline on the MONTHLY level. Up to now, this market has been rising for 4 months going into May suggesting that this has been a bull market trend on the monthly time level. As we stand right now, this market has made a new low breaking beneath the previous month's low reaching thus far 7615 while it's even trading beneath last month's low of 8070.
ECONOMIC CONFIDENCE MODEL CORRELATION
Here in NY Crude Oil Futures, we do find that this particular market has correlated with our Economic Confidence Model in the past. The Last turning point on the ECM cycle low to line up with this market was 2020 and 2009 and 2001 and 1998 and 1994. The Last turning point on the ECM cycle high to line up with this market was 2022 and 2018 and 2011 and 2000.
MARKET OVERVIEW
NEAR-TERM OUTLOOK
The historical broader tone of the NY Crude Oil Futures has been a bearish consolidation following the high established back in 2008. Since then, this market has created 2 reaction highs which have been unable to break this overall protracted bearish consolidating trend. Still, the major low was made in 2023 and the market has bounced back for the last year. The last Yearly Reversal to be elected was a Bullish at the close of 2023.
This market remains in a positive position on the weekly to yearly levels of our indicating models. Nevertheless, it closed last year on the weak side down from 2022. Pay attention to the Monthly level for any serious change in long-term trend ahead.
Focusing on our perspective using the indicating ranges on the Daily level in the NY Crude Oil Futures, this market remains moderately bearish position at this time with the overhead resistance beginning at 7775 and support forming below at 7765. The market is trading closer to the resistance level at this time. An opening above this level in the next session will imply that a bounce is unfolding.
On the weekly level, the last important high was established the week of April 8th at 8767, which was up 17 weeks from the low made back during the week of December 11th. We have seen the market drop sharply for the past week penetrating the previous week's low and it closed lower. We are trading below the Weekly Momentum Indicators warning that the decline is very significant and we need to pay attention to the timing and reversals. When we look deeply into the underlying tone of this immediate market, we see it is currently still in a weak posture. Immediately, this decline from the last high established the week of April 8th has been important closing sharply lower as well. Before, this recent rally exceeded the previous high of 7960 made back during the week of November 27th. Nonetheless, that high was actually lower than the previous high made the week of October 16th suggesting this market has really been running out of sustainable buying for right now. This immediate decline has thus far held the previous low formed at 6771 made the week of December 11th. Only a break of that low would signal a technical reversal of fortune and of course we must watch the Bearish Reversals. Right now, the market is below momentum on our weekly models casting a bearish cloud over the price action. Looking at this from a wider perspective, this market has been trading up for the past 23 weeks overall.
INTERMEDIATE-TERM OUTLOOK
YEARLY MOMENTUM MODEL INDICATOR
Our Momentum Models are declining at this time with the previous high made 2021 while the last low formed on 2023. However, this market has declined in price with the last cyclical low formed on 2023 warning that this market remains weak at this time on a correlation perspective declining in both price and Momentum.
Looking at the longer-term monthly level, we did see that the market made a high in September 2023 at 9503. After a four month rally from the previous low of 8346, it made last high in September. Since this last high, the market has corrected for four months. However, this market has held important support last month. So far here in May, this market has held above last month's low of 8070 reaching 8070.
Some caution is necessary since the last high 9503 was important given we did obtain one sell signal from that event established during September 2023. That high was still lower than the previous high established at 12368 back during June 2022. Critical support still underlies this market at 6700 and a break of that level on a monthly closing basis would warn of a further decline ahead becomes possible. Nevertheless, at this time, the market is still weak trading beneath last month's low.
DiscoverGold
Oil Market Update - back in buying territory after post-breakout correction...
By: Clive Maund | May 20, 2024
With the main fundamental drivers for a higher oil price remaining in play, namely continuing strife in the Mid-East with the ongoing risk of flare ups and the growing risk of a dollar collapse, this looks like a good point to buy oil and oil related investments after the corrective phase of the past 5 weeks or so.
On the 8-month chart for Light Crude we can see how oil ran up in late March and early April following a breakout from a Head-and-Shoulders bottom. Then we saw what looks like a normal post-breakout reaction back to test the support at the top of the pattern with an intermediate base pattern forming in this support this month within which are a couple of “bull hammers” which are long-tailed bullish candles, which are more easily seen on shorter-term charts. This correction has more than fully unwound the earlier overbought condition and has put oil in position to advance anew soon.

Turning now to oil stocks we see on the 8-month chart for the XOI oil index that they had quite a strong runup on the back of the rise in the oil price in March and April but from early April we see that this index has reacted back in what looks like a classic bull Flag / Pennant that will lead to renewed advance. We can see that the duration of this corrective pattern has allowed time for the earlier heavily overbought condition shown by the MACD indicator to fully unwind, thus restoring upside potential, and for its bullishly aligned moving averages to partially catch up, thus creating the conditions for renewed advance. This therefore is believed to be a good time to buy selected oil stocks.

A good vehicle for playing renewed advance by the energy sector is the Energy Select Sector SPDR Fund, code XLE, and on its 8-month chart we see that it has corrected back over the past 5 weeks or so in sympathy with the sector to arrive at the lower rail of a powerful uptrend cannel, which has allowed time for its earlier heavily overbought condition to fully unwound. This correction is believed to be a bull Flag that will lead soon to another strong upleg, an interpretation that is given added weight by the fact that the Accumulation line has held up very well on the correction and is even on the point of making new highs even though the price has not yet broken out of the Flag. This is very bullish and so XLE is rated a strong buy here. Whilst XLE is not viewed as especially speculative in this environment, buyers here may want to place a stop some way beneath the lower rail of the channel or to reduce the risk of being shaken out before a big rally, it’s perhaps better to place a stop beneath the support level at approximately $90 - $91.50.

Read Full Story »»»
DiscoverGold
Natural Gas Faces 200-Day MA Test at 2.46
By: Bruce Powers | May 24, 2024
• Following a significant rally, natural gas starts a retracement, with key support levels at the 200-Day and 20-Day MAs in focus.
Natural gas fell to a five-day low of 2.51 today and it continues to trade near the lows of the day at the time of this writing. It looks to be heading next towards the first test of support around the 200-Day MA since a bullish breakout of the line last Thursday. Today’s bearish continuation follows yesterday’s new trend high of 2.92 and subsequent weak close. That high completed a 92.1 % advance from the February swing low at 1.52. The RSI momentum oscillator is also showing weakness as it turned down from the most overbought reading since the peak of a long-term uptrend in 2022.

Declining Trend Channel Identifies a Price Range
Since April 26 natural gas has been trading within a declining parallel trend channel defined on the chart with two blue dashed line. Clearly price was rejected to the downside near the top line yesterday. That was the third touch for the top trendline. Given the recent sharp rally it would be normal for natural gas to spend some time in retracement or consolidation. When considering the declining channel, once the top is hit there is the potential for the bottom channel line to be tested as support. This doesn’t mean it will happen, but it does increase the possibility that a correction could take some time.
Correction to Strong Advance Could See Lower Support Levels
If the 200-Day MA is broken to the downside, the 20-Day MA becomes the next target. It is currently at 2.35 and should be considered along with the 2.31 interim swing low from January 22. A little lower is the 50% retracement at 2.25, along with the 2.23 swing low from December. That swing low is potentially more significant than the January low as it was a sustained bottom.
The 61.8% Fibonacci retracement is at 2.095, followed by the orange 50-Day MA at 1.99 currently. It is approximately 32% below yesterday’s high. Since the rally was fast, the price of natural gas reached an extreme level relative to the 50-Day line. Strong swings in one direction can frequently lead to a strong reaction in the opposite direction.
Read Full Story »»»
DiscoverGold
Crude Oil Continues to Find Buyers on Dips
By: Christopher Lewis | May 24, 2024
• The oil markets found a little bit of support on Friday, gapping higher to kick off the session. This is a market that has been weathering a bit of a storm lately, and therefore it has proven its resolve.
WTI Crude Oil Technical Analysis
This is the West Texas Intermediate crude oil market and you can see that the market has gapped higher to kick off the trading session. And it now looks like we are trying to recapture the 50% Fibonacci retracement level that had been important previously.
With that being said, I like the idea of paying close attention to whether or not we can clear the $78 level, because I think that allows the market to go looking to the $80 level. I am starting to wonder whether or not and you can look on futures charts as to whether or not the sell off here was a little bit capitulatory.
Brent Crude Oil Technical Analysis
And I’m starting to suspect that Brent looks very much the same. If we can take the $82.50 level back again, then we could go to the $84.50 level. We are in summer driving season, so it does make a lot of sense that crude oil will continue to rally. Furthermore, we have a lot of geopolitical issues out there that could continue to push this market higher.
So, I don’t have any interest in shorting anyways. I haven’t this entire time, at least not over the last couple of months. I think ultimately you have a market that does go higher and perhaps reaching as high as $90 and Brent and of course dragging the WTI grade right along with it. I have no interest in shorting oil now, not this time of year. And I believe inflation is just going to show itself in petroleum like it is everything else.
Read Full Story »»»
DiscoverGold
Ceasefired Up. The Energy Report
By: Phil Flynn | May 24, 2024
Oil prices retreated yesterday along with a big sell off in the stock market as concerns about inflation and rising interest rates put it damper on most of the markets. Today, believe it or not, the market is getting some pressure from a Reuters report that Vladimir Putin is looking for a ceasefire in Ukraine. According to a Reuters report Russian President Vladimir Putin is ready to halt the war in Ukraine with a negotiated ceasefire that recognizes the current battlefield lines.
At the same time, he is saying he is prepared to fight if Kiev in the West does not respond.
The interesting thing here is that when you look at the war in Ukraine the Biden administration has a lot invested in this War. Early in the war the Biden Administration advised Ukraine not to agree to a ceasefire deal with Russia.
President Biden seemed to welcome the “minor incursion” into Ukraine by Russia and then later backed off that statement, yet it seemed almost to welcome the conflict between Russia and Ukraine.
Now he has the military industrial complex humming with massive amounts of American Taxpayer money flowing to Ukraine. Because of that ignominious start to the war, it would be interesting to see if the Biden administration would be open to the olive branch that the Russian President is offering.
Many members of the Biden administration of course have demonized Russian President Vladimir Putin even before the Russian Ukraine war, rightly or wrongly. Many members of Biden administration helped perpetuate the myth that the Trump administration had in some way colluded with Putin and Russia to discredit the sitting president of the United States.
We know that the Russian investigation into the Trump campaign was started by the Hillary Clinton campaign with a fake dossier.
We know now that the FBI that broke the law in securing FISA warrants against American citizens.
This was a very dark time in American history where the rule of law became a joke as corrupt players in the FBI and the CIA decided to take it upon themselves to try to unseat sitting U.S. President. They spat on the constitution and bright shame on themselves and the institutions that they were supposed to serve.
I’s clear that the Biden administration has a lot invested in the war in Ukraine. Not only did his son Hunter have business dealings in Ukraine, working for the natural gas company Burisma Holdings. Then Vice President leveraged $1 billion in aid to persuade Ukraine to fire its top prosecutor, Viktor Shokin, in March 2016.” In 2012, the Ukrainian prosecutor general Viktor Pshonka began investigating Ukrainian oligarch Mykola Zlochevsky, owner of the natural gas company Burisma Holdings, over allegations of money laundering, tax evasion, and corruption during 2010–2012. In 2015, Shokin became the prosecutor general, inheriting the investigation. Then will Hunter Biden was getting paid the Vice President got Ukraine to fire Ponoka.
Biden administration is also used the war in Ukraine as an excuse for increasing inflation and rising oil and gas prices. This has been a convenient excuse, almost as convenient as being able to use US taxpayers’ dollars to influence a country to fire a prosecutor investigating the company that you’re Son is getting paid by.
From a technical point the market just doesn’t seem to have a lot downside but the negativity about demand expectations and the course of interest rates is keeping the market in a range.
AAA says that “The national average for a gallon of gasoline wobbled slightly since last Thursday before settling one cent higher at $3.61
“The lack of pump price movement is typical in the days leading up to Memorial Day. However, with AAA forecasting a record 38.4 million drivers hitting the road for the long weekend, the price needle could point a bit higher, at least temporarily. “
Yet Trilby Lundburg on the Lundberg Survey the granddaddy of all gasoline price reporting and the inventor of that industry questioning that prediction. Berg better preceded AAA’s price reporting on gasoline and even did it before the US government started to cover it.
Lundgurg writes that “AAA’s holiday car travel projections have been high versus actual gasoline demand by a factor of ten on average according to our study. The AAA forecasts are widely reported by media as gospel without anyone asking about the historic track record. This report examines 14 years of AAA forecasts versus gasoline demand and finds some shocking results. Lundberg writes that “the AAA press release states quote we haven’t seen Memorial Day weekend travel numbers like these in almost 20 years” said Paula Twidale, senior vice president of a travel. “We are projecting an additional 1,000,000 travelers this holiday weekend compared to 2019 which not only means were exceeding pre pandemic levels but also signals a very busy summer travel season ahead.”
What’s more AAA says Rd. travel will hit a new record high: “road trips are expected to set a record AAAA projects 38.4 million people will travel by car over the Memorial Day weekend the highest number for that holiday since AAA began tracking this in the year 2000.
Lundberg did an extensive study of a AAA holiday predictions over the years concluded that they have really been overestimating these travel numbers for a while.
She did a comparison to the Energy Information Administration (EIA) data and saw some differences.
She says because of that a forecast of four-point a 4.1% increase in driving this Memorial Day season is somewhat questionable. She questions why AAA would expect a big surge in gasoline demand when we have seen evidence that so far drivers have been cutting back on consumption in 2024.
Why suddenly when they jump into their cars and start spending money when they’re being impacted by high inflation.
And while the Energy Information Administration did report a big surge in gasoline demand from the week before we have seen some very erratic data as far as gasoline from week to week as far as demand numbers are concerned.
Yet regardless of who’s right and who’s wrong the main thing to do is stop and take some time this holiday weekend to remember those that gave all for America and our freedoms. so many good men and women sacrificed so much so that we could have a country and they deserve our gratitude and prayers. God Bless them and God Bless their Families and God please bless America.
Scott DiSavino at Reuters wrote that Financial firm LSEG said gas output in the Lower 48 U.S. states fell to an average of 97.5 billion cubic feet per day (bcfd) so far in May, down from 98.2 bcfd in April. That compares with a monthly record of 105.5 bcfd in December 2023.
On a daily basis, however, output was up about 1.5 bcfd since hitting a 15-week low of 96.2 bcfd on May 1. Energy traders said that increase was a sign that the 63% gain in futures prices over the past three weeks prompted some drillers to start producing more gas.
Read Full Story »»»
DiscoverGold
Crude Oil Faces Increased Selling Pressure
By: Bruce Powers | May 23, 2024
• WTI crude oil's lowest close since February 26 indicates weakening, with potential bearish continuation on a drop below 76.83.
WTI crude oil tested the bottom range of a two plus week tight consolidation zone with today’s low of 76.90. That is a six-day low and crude oil is on track to close at its lowest daily closing price since February 26, not to mention the lowest daily close of the current consolidation phase. This is a sign of weakening, although within consolidation.
Nonetheless, it indicates increasing selling pressure and follows multiple tests of resistance at the convergence of a downtrend line, 200-Day MA, and 20-Day MA. Further, the area around the uptrend line has been attempting to hold as support. Today’s bearish price action decreases the chance that the uptrend line will remain a price support area and increases the possibility of it representing resistance.

Chance for Bearish Continuation is Increasing
The chance for a continuation of the bear trend is increasing. Recent failed attempts to breakout above the 200-Day MA, the more significant trend indicator, have failed and we’re now seeing increasing signs of weakness. The week ends tomorrow and unless the bulls take back control crude oil is set to end the week with a bearish candlestick pattern.
A bear trend continuation signal will be given on a drop below last week’s low of 76.83. Last month’s low of 76.86 was already busted once earlier this month. A drop below that low will provide a second monthly bearish signal. The next lower target zone includes the 61.8% Fibonacci retracement at 75.49, along with the bottom trend channel line. Further down is the 78.6% retracement at 72.11.
Rallies Will Again Deal with Solid Resistance Zone
On the upside, a rally above today’s high of 79.14 sets up another test of trendlines and moving average as resistance. One thing to consider is that when multiple lines identify a similar price zone, it becomes more significant. For crude oil, that significance may be experienced as strong resistance leading to a bearish continuation, or a key pivot where an upside breakout may trigger strong momentum.
Read Full Story »»»
DiscoverGold
Natural Gas Rally Stalls at 2.92, Reversal Signals Loom
By: Bruce Powers | May 23, 2024
• After hitting 2.92, natural gas faced resistance and reversed, suggesting a potential top and increasing chances of a market correction.
Natural gas advances to a high of 2.92 on Thursday before encountering resistance and turning over. At the time of this writing natural gas has reversed intraday to below the halfway point of the day’s trading range. This indicates a possible weak close following a new trend high and a possible top for now. Today’s high was a little shy of testing the top declining trendline (blue dashed).

Large Measured Move Completed
However, an 87.2% measured move that matches the percentage advance from the rally starting from the April 23 swing low completed at 2.85. That advance covered the full rising trend channel that ended at 3.64 in October 2023. The current advance started from the 1.52 February swing low. It reflects a degree of price symmetry between the two swings. Once there is a match the chance of encountering resistance that could lead to a reversal increases.
Either way, a key pivot level is identified. Judging by today’s initial continuation into new trend highs, followed by a clear intraday reversal and a likely weak closing price, it seems like the market may have taken notice. Further, the relative strength index (RSI) has turned down from being overbought, the most overbought since the 2022 peak.
Watching for Further Weakness
Nonetheless, there is no daily reversal signal yet and natural gas could still advance. But the next higher target is not much higher at 2.98/2.99. Certainly, the uptrend is extended and due for a retracement. Even if slightly higher prices are seen before a further dip, the chance for a correction has increased.
A drop below Wednesday’s low of 2.61 on the daily chart will be bearish. Key price areas to watch for possible support start with the 200-Day MA at 2.64. That level is followed by the 20-Day MA and prior interim swing low at 2.21. A little lower is the 50% retracement of the current advance at 2.25 and prior swing low at 2.23. Further down is the 50-Day MA at 1.98.
Weekly Chart May End Bearish
Also, be aware of the weekly chart and how natural gas ends the week. As of today, the weekly chart is shaping up as a bearish shooting star. If the week completes in a similar fashion, it will set up a potential sell signal below this week’s low of 2.61.
Read Full Story »»»
DiscoverGold
$WTIC $OIL - Failed to exit the Dn/Trend Channel (Gold)
By: Sahara | May 23, 2024
• $WTIC $OIL - Failed to exit the Dn/Trend Channel (Gold).
And exiting the 'Bowl'. Unless it recovers to leave a tail outside the Bowl for the Week. Otherwise it will seek out that final Target from that 'H&S' Plot (Red).
A failure to hold there will target the full Wave-(E)...

Read Full Story »»»
DiscoverGold
Bull Signal Flashing for Oil & Gas Stock Chevron (CVX)
By: Schaeffer's Investment Research | May 23, 2024
• Chevron stock pulled back to a historically bullish trendline
• The stock could bounce back towards seven-month highs
The shares of oil and gas stock Chevron Corp (NYSE:CVX) still sport a fractional year-over-year lead, despite pulling back over the last two weeks. In fact, going back to May 13, CVX's only win was a 1% gain on May 17. While the security is pacing for its second consecutive weekly loss, investors may have a potential "buy on the dip" situation on their hands.
That's because this recent pullback has Chevron stock trading within one standard deviation of its 260-day moving average, a trendline with historically bullish implications. Per Schaeffer's Senior Quantitative Analyst Rocky White, the security saw four similar signals over the past three years, after which it was higher one month later 75% of the time, averaging a 7.6% gain. A move of similar magnitude would put CVX nearly $170, or its highest level since October 2023.

An unwinding of pessimism amongst options traders could provide the shares with tailwinds. This is per CVX's Schaeffer's put/call open interest ratio (SOIR) of 0.97 that stands higher than 90% of readings from the past 12 months.
Options are reasonably priced at the moment too, for those that wish to speculate on Chevron stock's next move. This is per the security's Schaeffer's Volatility Index (SVI) of 17%, which sits in the low 15th percentile of its annual range. This means options traders are pricing in low volatility expectations at the moment.
Read Full Story »»»
DiscoverGold
Willing But Able? The Energy Report
By: Phil Flynn | May 23, 2024
The Fed Minutes were a buzz kill for smoking hot commodities after it said that some Fed officials might be willing to raise interest, if need be, but the question is whether or not they are able. Raising rates in an election year is fraught with political fallout so even if inflation stays red hot, I can’t imagine that a rate increase would be possible this year, unless of course Donald Trump becomes President.
Regardless, the Fed minutes broke oil, but as bad as it looked, the support was not broken. The Energy Information Administration (EIA) Petroleum Status report showed a decent snap back in gasoline to 9.315 million barrels a day(mbpd) and diesel demand up to 3.883 mbd. That improved the lagging four-week average on demand to 8.9 mbd, now just 1.8% below year ago levels. Distillate improved to 3.7 mbd, down 6.1%.
Global oil demand expectations rose after the India flash PMI climbed to 61.7 in May from 61.5 in April. That was the third fastest pace upturn in oil hungry India output since Jul-2010 and was partially fueled by Russian oil imports. How is that price cap thing working? The report said that services drove the growth amid acceleration in business activity. Now Jodi is reporting that India’s total product demand was nearly at the same level month over month at 5.6 mb/d but was 3.4% above the previous year’s level.
The oil market is preparing for the June OPEC online meeting. The oil market should comment that OPEC decided to hold the meeting online, but they may have a surprise already baked into the online meeting.
The key issue that currently moves oil prices is whether or not OPEC will extend production cuts into 2025. While that is unlikely, in an online meeting there’s no doubt about the commitment by OPEC plus to continue along the path that they are on.
Amena Bakr points out that, “commitment among the OPEC+ alliance to the cuts is strong, and countries that have been overproducing their quotas are compensating for the increased volumes.” So, OPEC plus may do whatever it takes to keep the oil market tight and if demand surges, the supply deficit will occur.
US oil inventories are still higher than most thought they would be at this point as supply at the Cushing, Oklahoma delivery point hit 36.3 million barrels, the highest level since July. Yet stagnant US oil output, at least according to EIA data, suggests that as the refining season kicks in that could change very quickly. The EIA says that US production has been stuck at 13.1-million-barrel day. Is that a sign that we are seeing a peak in production? Or is it a sign that the EIA just gave up on updating weekly production numbers?
Regardless, the EIA’s snapshot of supply puts U.S. commercial crude oil inventories (excluding those in the Strategic Petroleum Reserve) with an increase by 1.8 million barrels from the previous week. At 458.8 million barrels, U.S. crude oil inventories are about 3% below the five-year average for this time of year. Total motor gasoline inventories decreased by 0.9 million barrels from last week and are about 2% below the five-year average for this time of year. So, both demand and supply are below year ago levels. Distillate fuel inventories increased by 0.4 million barrels last week and are about 7% below the five-year average for this time of year.
The EIA is also putting out an alert about the upcoming hurricane season. The EIA said, “Meteorologists are forecasting a particularly intense Atlantic hurricane season this year; they expect 20–25 named storms with a possibility of 30 or more, according to reports from AccuWeather in April. Colorado State University similarly forecasts an estimated 23 named storms this year. The potential for a stronger hurricane season suggests heightened risk for weather-related production outages in the U.S. oil and natural gas industry. With this type of a forecast coming from the Energy Information Administration, it’s probably critical that you get your Fox Weather app downloaded on your phone.
Oil prices look like they are still in the process of bottoming here even with the weakness thrown at it. It’s probably a perfect time to start getting back in and building a position slowly.
Gold prices did take a hit after the Federal Reserve minutes but also there are concerns that high prices might cure high prices in India’s red hot economy. Reuters reported that, “India’s gold imports in 2024 could fall by nearly a fifth from the previous year, as record high prices spur retail consumers to exchange old jewelry for new items, the head of an industry body told Reuters. Lower imports by India, the world’s second biggest consumer of the precious metal, could cap a rally that carried global prices to a record this week.
Natural gas prices sizzled after early weakness yesterday. Increase in the demand for LNG potential for weather related demand is causing the resurgence in natural gas prices with the best run in 2 years. EBW Analytics warns that, “While the immediate term outlook may feature a retreat into Memorial Day weekend as CDDs peak and June final settlement awaits, the medium-to-long term outlook may find support amid robust power burns across Texas and the Southeast and glimmers of upside potential for LNG feedgas demand.” If you believe the global natural gas crisis is over, you better think again. Energy Intelligence reported that European natural gas prices jumped to their highest levels in over four months on Wednesday after Austria’s OMV warned that its supply may be cut off by Russia’s Gazprom.
Read Full Story »»»
DiscoverGold
EIA Natural Gas Storage Build Of +78 Bcf Misses Estimates
By: Vladimir Zernov | May 23, 2024
Key Points:
• Natural gas in storage increased by 78 Bcf from the previous week.
• Stocks are 402 Bcf higher than last year.
• Traders continue to prepare for summer, which could bring extreme heat.
On May 23, 2024, EIA released its Weekly Natural Gas Storage Report. The report indicated that natural gas in storage increased by 78 Bcf from the previous week, compared to analyst consensus of +84 Bcf.
At current levels, stocks are 402 Bcf higher than last year at this time and 606 Bcf above the five-year average of 2,105 Bcf. High storage levels serve as a bearish catalyst for natural gas prices, although traders have focused on other drivers in recent weeks.
Current demand for natural gas is moderate, but traders continue to prepare for the upcoming cooling season, which would boost demand for energy.
It should be noted that natural gas prices in Europe have also gained solid upside momentum in recent weeks as traders prepared for warm summer.
According to recent reports, the North Atlantic sea surface temperature is at 40-year highs, which indicates that summer would be hot. Extreme heat is bullish for natural gas.
Interestingly, natural gas prices moved lower after the release of the EIA report. The storage build missed analyst estimates, which could have provided support to the market. However, it looks that traders have decided to “sell the news” and took some profits off the table after the strong rally from May lows.

Read Full Story »»»
DiscoverGold
Natural Gas Rallies to New Highs After Early Session Dip
By: Bruce Powers | May 22, 2024
• Following an early dip, natural gas rallied to 2.85, suggesting continued strength with key resistance ahead.
Natural gas stays strong to reach a new trend high of 2.85 on Wednesday. Earlier in the session the price of natural gas broke below the lows of the past couple days before buyers took control to rally into new trend highs. An outside day is the result.
Trading remains active near the highs of the day and will likely end today’s session with a new daily closing high for the current rally. A daily close above the prior trend high of 2.80 will be a slightly stronger indication of strength than a close below it.

False Breakdown Followed by Sharp Intraday Advance
Given the failure of the breakdown earlier in today’s session and the following strong recovery, it looks like natural gas wants to go higher. The next higher identified target zone is close by from around 2.86 to 2.88. Also, keep an eye on the top declining blue dashed trend channel line as resistance can be seen around that line. Further, if a daily close occurs above the line, it will be a sign of strength. Highter up is the 78.6% Fibonacci retracement at 2.99.
Price is Extended Yet Continues to Rise
Certainly, natural gas is getting extended as well. The relative strength index (RSI) is the most overbought since the 2022 peak. Considering the size of the current advance, this rally has exceeded all prior sharp advances since the first trend bottom in 2023 on a percentage basis. That is when starting the measurement from the most recent swing low (C). In this case, from (C) the current rally was up by as much as 80.1% at today’s high.
However, the full advance from the second trend bottom in April 2023 to the October 2023 peak was 87.2%. That performance will be matched in the current rally at 2.96 thereby providing another measured move target (purple arrows). It is interesting that this target is very close to the 2.99 Fibonacci retracement level. It is also close to several measured moves that occurred in natural gas during the uptrend that began from the 2020 bottoms.
Read Full Story »»»
DiscoverGold
Crude Inventories Rise By 1.8 Million Barrels, Exceeding Analyst Expectations
By: Vladimir Zernov | May 22, 2024
Key Points:
• Strategic Petroleum Reserve increased from 367.8 million barrels to 368.8 million barrels.
• Domestic oil production remained unchanged at 13.1 million barrels.
• Oil markets rebound from session lows as traders react to the EIA report.
On May 22, 2024, EIA released its Weekly Petroleum Status report. The report indicated that crude inventories increased by 1.8 million barrels from the previous week, compared to analyst consensus of -2.5 million barrels. At current levels, crude inventories are about 3% below the five-year average for this time of the year.
Total motor gasoline inventories declined by 0.9 million barrels, compared to analyst forecast of -1.2 million barrels. Distillate fuel inventories increased by 0.4 million barrels.
U.S. crude oil imports declined by 81,000 bpd, averaging 6.7 million bpd. Over the past four weeks, crude oil imports averaged 6.8 million bpd.
Strategic Petroleum Reserve increased from 367.8 million barrels to 368.8 million barrels as U.S. continued to buy oil for strategic reserves.
Domestic oil production remained unchanged at 13.1 million bpd. Current oil price levels are not attractive enough to boost production.
WTI oil settled near the $78.00 level as traders reacted to the EIA report. The report was rather bearish, but it looks that rising crude inventories have been already priced in by the market. From a big picture point of view, WTI oil remains range-bound since early May.
Brent oil is trading near the $82.00 level after an unsuccessful attempt to settle below $81.50. It looks that traders have already started to prepare for the driving season, which should provide additional support to oil markets.
Read Full Story »»»
DiscoverGold
Empty The Tank. The Energy Report
By: Phil Flynn | May 22, 2024
Empty Ideas just empty the tank. The Biden Administration wants to try to convince Americans that despite being the most anti-fossil fuel administration in history they still want to see low gas prices even as their policies say otherwise. The latest move by the Biden Administrations to sell that point to voters is a move to empty the gas tank by releasing 1 million barrels of gasoline from the Northeast gasoline reserve.
The press release on the previously authorized sale of this unused reserve that was created after Hurricane Sandy joyfully exclaimed that “The Biden-Harris Administration is laser focused on lowering prices at the pump for American families, especially as drivers hit the road for summer driving season,” said U.S. Secretary of Energy Jennifer M. Granholm. “By strategically releasing this reserve in between Memorial Day and July 4th, we are ensuring sufficient supply flows to the tri-state and northeast at a time hardworking Americans need it the most.”
Yes! Let them eat cake and burn hydrocarbons. Of course, the amount of gasoline that is to be sold is only about 11 percent of daily demand and the sales will be allocated in quantities of 100,000 barrels more than likely it will be consumed before most of us have breakfast.
And while very gallon might help lower prices, I think it’s rather desperate of the Biden Administration feeling the need to take a victory lap on this gasoline release. Gas prices average about $3.60 per gallon nationwide as of Tuesday, up 6 cents from a year ago, according to AAA.
The administration that has accused be U.S. oil and gas industry of price gouging and war profiteering has shown unusual vitriol against this industry. This is an administration that abused the mission of the strategic petroleum reserve by releasing supplies to try to lower gasoline prices ahead of an election. The continuing intervention by the Biden administration into the global oil markets has not been helpful to the type of investment that this country is going to need to meet our needs and global demand in the future. The timing of the announcement ahead of the Memorial Day holiday weekend with an effort to try to lower prices ahead of the summer driving season or at least trying to give the appearance of doing so.
We know that US consumers are angry about inflation and the Biden administration is concerned because they know that many Americans hold them responsible.
If you look at gasoline demand, there are signs that consumers must cut back because of inflation pressures. And you know that when Americans cut back on driving that is a cut back on their feeling of freedom and their prosperity.
The Biden Administration consistent metaling in the market along with regulations that create uncertainty has hampered the ingenuity and creativity of the US oil and gas industry. Biden significantly drained the Strategic Petroleum Reserve in 2022 following Russia’s invasion of Ukraine, dropping the stockpile to its lowest level since the 1980s.
Instead of working with one of the most dynamic industries in this country they chose to have an adversarial relationship with this industry. The Biden administration’s policies have been very inflationary. Their foreign policies failures like not avoiding war between Russia and Ukraine as well as the weakening of sanctions on Iran that helped fund Hamas Hezbollah and the Houthi rebels which have conspired to increase the cost of energy and just about every other commodity the planet.
Yet they continue to disparage the US oil and gas industry.
White House Press Secretary Jean-Pierre said, “While congressional Republicans fight to preserve tax breaks for Big Oil at the expense of hardworking families, President Biden is advancing a more secure, affordable, and clean energy future to lower utility bills while record American energy production helps meet our immediate needs.”
The White House press secretary obviously has no experience understanding about the US oil and gas industry.
The so-called tax breaks that the press secretary is talking about is away for U.S. oil and gas industry to produce more product and keep prices cheaper for the American people. When the Biden administration puts more burden on the US oil and gas industry that’s going to show up directly at the pump.
So while they keep telling us that they are trying to do wonderful things for hard working Americans the reality is the opposite and if you don’t believe it just go fill up at the pump.
And at the same time policies of this administration has allowed revenue in places like Iran to hit a five-year high. The Administration nd has failed to enforce sanctions on Russian oil. We should also point out that the oil on our SPR went to other countries that included our adversary, China. And while there’s no doubt that commodities have been at the beginning of a major super cycle and may have a long way to go, it’s clear that if the government continues to try to intervene in the free markets and try to pick winners and losers in this energy transition it’s only going to lead to even more inflation and higher prices in the future.
Today the petroleum markets are under pressure after the American Petroleum Institute (API) reported increases in crude and gasoline supply and hawkish Fed talk. Raising the inventories is raising concerns about a slowdown in demand and the possibility of stagflation as other commodities like grains and metals rise.
The API reported that crude stocks increased 2.48 million barrels while gasoline inventories increased by 2.1 million barrels. Distillates fell by 320,000 barrels as Farmers made a lot of progress in the fields. Farm Progress reported that USDA’s latest crop progress report, on Monday showed corn plantings still a bit behind the prior five-year average but has mostly caught up as more farmers have been able to jump back into spring fieldwork over the past several days. Soybean plantings passed the halfway mark, meantime, and are still modestly ahead of the prior five-year average. Winter wheat quality ratings unexpectedly shifted a point lower. Increasing inventories are raising concerns about slowing global demand. And that could be a sign of stagflation. Fed Speakers had to be hawkish as inflation continues to be a problem.
Barrons reported that Fed Governor Waller said he needs to see “several more” months of good inflation figures to begin interest rate cuts. Atlanta Fed President Bostic reiterated his view that inflation will continue to decline slowly and that the Fed can likely begin cutting interest rates in the fourth quarter.
Today could be a turning point for oil after all the negativities. If the market can get a more bullish report from the Energy Information Administration (EIA) today, we could be close to the bottom technically.
Keep an eye on demand to band for gasoline and products. It’s been subpar we do expect a bounce and we do expect to see a low coming into the prices very shortly. We don’t think the upside risk has gone away and we think there’s more upside than downside at these price levels.
Natural gas is incredible moves seems to be taking a pause after the market has had one of the best upward moves in 2 years. The recovery has been led by increased demand for one of the cheapest hydrocarbons on the planet. LNG exports resumed and the science of production was leveling out storage levels are still at historically high level. We are going to pull back here at a little bit to see if the air conditioning demand starts to increase demand. Power outages and demand destructions and part of the country due to storms has also hurt demand.
Naureen S. Malik at Bloomberg wrote that “Windows are still falling from skyscrapers in downtown Houston after a historic windstorm whipped through the city last week. And days after the disaster, more than 140,000 customers in the area remained without power. Most of those homes and businesses are served by CenterPoint Energy Inc. The utility operates the most stressed local power grid in the country. Malik says that “What happened in Houston is emblematic of widespread issues across the country. As the US grid is tested by extreme weather and increasing demand, aging infrastructure is giving way to higher counts of grid faults.
The problem is one of poor power- quality, or when the flow of electricity powering lights and appliances is being delivered at an uneven or unpredictable pace, which can lead to dangerous surges, sags, brownouts and outages.” Maybe they could put that is an electric car ad.
Read Full Story »»»
DiscoverGold
Natural Gas Rallies to 2.80, Will It Hold?
By: Bruce Powers | May 21, 2024
• Natural gas hit a high of 2.80, completing a significant 76.8% rally from the April low of 1.58.
Natural gas hit a new trend high of 2.80 on Tuesday, thereby completing a 1.21 point or 76.8% rally from the April 25 low at 1.58. The new high has some significance as it is the completion of a 250% extension of a rising ABCD pattern. It shows the CD leg of the pattern up by 2.5x the price appreciation seen in the AB leg of the advance. Judging by the bearish intraday reaction once 2.80 was reached, it seems the market is aware of the relationship between the swings.

Next Moves Provide Clues
Follow through will be key. There remain higher target areas starting from 2.86 to 2.88. That zone includes an extended rising ABCD pattern at 2.86, which is calculated using 2.618x the advance seen in the AB leg instead of 2.5x. It sits with the June 2023 swing high at 2.88. Then, higher up from there is the 78.6% Fibonacci retracement at 2.99. Those higher targets may yet be reached but given an initial bearish reaction to reaching the 2.80 target, maybe not until there is some degree of a pullback and/or consolidation.
Caution Warranted by the Bulls
There are several additional reasons for caution following today’s high. The relative strength index (RSI) is the most overbought since the peak in in the price of natural gas in April 2022. Also, there is a concern about time symmetry. The current advance has been developing for 18 trading days. Two of the previous four rallies that followed the February 2023 trend high have lasted 18 days. Moreover, the current advance of 76.8% significantly improved on the 53.9% rally from the February 2023 trend low. That 53.9% rally had the strongest performance of subsequent rallies until the current.
Resistance and Support
A decisive advance above today’s high of 2.80 would provide the next bullish signal and give natural gas a chance to reach the 2.86 target zone. Also, a drop through today’s low of 2.64 provides a short-term bearish signal that may lead to a deeper pullback. Key support is around the 200-Day MA at 2.46. Below there is a 2.40 to 2.38 price zone. The 20-Day MA is down at 2.21.
Read Full Story »»»
DiscoverGold
Crude Oil Tests Resistance, Awaits Bullish Breakout
By: Bruce Powers | May 21, 2024
• A decisive advance above Monday's high of $80.64 would trigger a bullish breakout for crude oil above key moving averages and a downtrend line.
Crude oil has been sitting in an interesting position recently as it has been consolidating up against resistance around the 200-Day MA for two weeks. The significance of the 200-Day line was increased today as the purple 20-Day MA has fallen to converge with the 200-Day line. Together, the two lines represent a formidable near-term resistance zone with a new high of the consolidation range marked yesterday at 80.64. Both the 200-Day MA and 20-Day MAs are at 80.24 and 80.28, respectively. In addition, a downtrend line was also successfully tested as resistance at Monday’s high.

Rise Above 80.64 Triggers Bullish Breakout
A decisive advance above Monday’s high would be needed for a bullish signal. Such an advance would trigger a breakout above both moving averages plus the downtrend line. If it triggers after this week is complete, a weekly breakout is also indicated. Subsequently, a breakout should be followed by a test of support around the moving averages showing that prior resistance has become support. Once an upside breakout confirms with a daily close above 80.64, crude oil should be ready to advance. The first upside target would be the orange 50-Day MA and 50% Fibonacci retracement at 82.23 to 82.36, respectively.
Bottom of Range is 76.83
On the support side of the equation, the low of the range is at 76.83. It was successfully tested as support last Wednesday. Price was quickly rejected leading to a sharp intraday bullish reversal with crude oil ending in the green. Notice that it was followed by three higher daily highs into a new high for the small trading range.
Support has been seen recently around the uptrend line and 50% retracement. Most of the daily closing prices have either been above or near the trendline. Also, notice how buyers stepped up during attempts to drop crude oil below the consolidation range. Each of the three attempts, including today, were met with buyers who were able to push price higher to end the day in the top half or quarter of the day’s trading range thereby leaving clear bottoming tails.
On a weekly basis, a bullish reversal was triggered yesterday as crude oil moved above last week’s high of 80.24. A daily close above that price level will confirm the breakout, and further still if this week ends above it.
Read Full Story »»»
DiscoverGold
Fast Enough. The Energy Report
By: Phil Flynn | May 21, 2024
Ladies and Gentlemen, Start your engines! Let’s get the summer driving season underway. Summer can’t come fast enough as demand concerns linger. Even signs of OPEC Plus compliance to production cuts as well as signs of demand green shoots in both India and China are not helping the early morning oil market mood.
The market is also showing concerns about the direction or no direction on interest rate is fed officials yesterday came off hawkish and caused the oil market to sell off. MarketWatch reported that Cleveland Fed President Loretta Mester on Monday suggested she was thinking about backing away from her prior expectation that the U.S. central bank will cut interest rates three times this year. In an interview with Bloomberg , Atlanta Federal Reserve Bank President Raphael Bostic said that it is going to take a while before they are certain that inflation is going back down to 2%.
Petroleum markets also is worried about this week’s oil inventories as the “whisper number” on petroleum inventories is suggesting that we might get a surprise increase in crude oil supplies even as there are signs that refiners are starting to kick it into high gear. US gasoline demand has been a concern as there are fears that inflation is forcing changes in America’s driving behavior. Consumers are experiencing inflation unlike many have seen in their lifetimes and it seems to be taking its toll. Groceries or gasoline that’s the question that many the Americans sadly must ask. And because we’ve only had one crew draw in the last few months it’s raising questions as to whether crude supplies in the US are ever going to fall.
Gasoline and diesel crack spreads that were improving fell back as well as Brent time spreads that dropped significantly. That is raising conerns about global demand or at the very least an unwinding of global oil risk premium. Concern about the war in Gaza and its impact on oil supplies seems to have gone away. Iranian President Ebrahim Raisi’s death in a helicopter crash most likely will not change Iran’s oil production or export plans. Reuters reported that – Iranian President Ebrahim Raisi’s death in a helicopter crash upsets the plans of hardliners who wanted him to succeed Supreme Leader Ayatollah Ali Khamenei and will stir rivalries in their camp over who will take over the Islamic Republic when he dies.
Reports of another Ukrainian drone attack on a small independent refinery in Krasnodar Russia seems to not be a big concern because Russia seems committed to reducing productions and exports anyway.
Vladimir Putin touted that January through April oil production Russian oil production came in at 195.7 million tons which was down 1.8% from the same a year ago. Russia continues to play hard to get about a commitment to extend of oil production cuts into 2025. Russia is widely expected to go along with the rubber stamping of the voluntary and involuntary production cuts going into the end of 2024 at the virtual June OPEC meeting.
Saudi Arabia also is also showing signs of compliance and tightening oil inventories. Saudi Arabia crude oil inventories were 139.285 million barrels of merge that was down from 145.092 million barrels in February. Saudi crude oil production fell to just 8.97 million barrels a day. India’s oil demand continues to rise another 179.000 barrels a day from last month. OPEC projects that India’s oil demand will grow by 4% to 5.8 mbd in 2025. And a lot of that demand is y going to be fed by Russian oil. India is a country that has not fallen into line with sanctions on Russian oil and have seen their imports Russian increase by 40% since last year.
Metals are rocking t copper wire and now aluminum is moving as the world rushes to secure metals to meet the growing demand for artificial intelligence and electronic vehicles as well as the expansion of the power grid.
Rio Tinto Group has declared force majeure on alumina cargoes from its refineries in Queensland, Australia, due to shortages of gas to power its operations. This story seemed to give aluminum a bounce.
The California public employee’s retirement system is saying they’re going to vote against all 12 board members nominated by Exxon at the company’s annual meeting as a protest. Barons’ reports that EXXON is playing hardball with two small environmentally conscious shareholders saying in a lawsuit filed in January that the funds are abusing the process of submitting resolutions at its annual meeting now that stance is being challenged by the country’s which is pension fund. Exxon mobile basically is saying that these people have no economic interest but they’re just trying to make Exxon Mobil reduce their oil and gas production. New laws are going into place in California to raise gasoline prices not only in California but the neighboring states.
The early weakness seems to be a rocky road for petroleum, but we believe that this is an opportunity if you can get through the next couple of days depending on inventories today and tomorrow we think we will bottom out and start to have higher as we end the week but in the meantime get ready to ride the volatility. Natural gas continues to see its recovery from the depths of despair. Those long-term options that we recommended are starting to look nice.
Read Full Story »»»
DiscoverGold
Crude Oil Continues to See Support
By: Christopher Lewis | May 21, 2024
• The crude oil market continues to see a lot of support, despite the fact that there is a ton of momentum at this point. This market continues to question whether or not there is a surge coming due to summer.
WTI Crude Oil Technical Analysis
Take a look at the crude oil market on the four hour chart. You can see that the West Texas Intermediate Market did fall down toward the 50% Fibonacci retracement level from the bigger move. But it does appear that it’s trying to bounce from here. We have been in a consolidation range for a while, with the $77 area being support, while the $80 level above acts as resistance.
It is worth noting that the $80 level, of course, is a large, round, psychologically significant finger that a lot of people will pay attention to and therefore, I think it might be a little bit difficult to get above. That being said, I suspect it is probably only a matter of time before we do break above that $80 level and go looking to the $82.50 level after that.
Brent Crude Oil Technical Analysis
The Brent market looks very much the same, bouncing from the $82 area, an area that has been important more than once. The $84.50 level, of course, is an area that a lot of people will pay close attention to, as it has been previous support and resistance. And I think that might be your target for any type of recovery.
Whether or not that happens easily remains to be seen, but I do suspect that’s probably the more likely of outcomes. If we do break down in the crude oil market, we could see a $2 drop in both grades rather quickly. But at this point in time, we have a lot of concerns about geopolitics and perhaps even supply in what is the busiest time of year that could cause this market to really shoot straight up in the air.
Read Full Story »»»
DiscoverGold
Natural Gas Surges to New High, Eyes $3.00
By: Bruce Powers | May 20, 2024
• Natural gas surged to a new high of 2.75, breaking resistance and setting sights on the 2.99-3.00 target zone.
Natural gas further advances to a new trend high of 2.75 on Monday, as it busts through a potential resistance zone ending at 2.69. Today’s high put the price of natural gas up by 73.5% from the most recent swing low at 1.58 (C). It looks like it will close strong today, in the top quarter of the day’s range and above 2.69. That puts it in a good position to continue its ascent towards the 78.6% Fibonacci retracement target at 2.99.
Also, the area around the top declining blue dash channel line can be watched for signs of resistance. For those familiar with Gann’s square of nine calculator, a 270 degree rise from the 1.58 low completes at 3.00. That is a match with the 78.6% price target and tells us to keep a close eye on the approach towards the 2.99/3.00 price zone.

Interim Higher Price Targets from ABCD Pattern
Nevertheless, there is no assurance the higher targets will be reached. Interim price targets include 2.80 and 2.86. They are derived from the 2.5% and 261.8% extensions of the rising ABCD pattern, respectively. Another price level of 2.88 is marked from the June 2023 swing high. Although all previous potential targets from the rising ABCD pattern have been exceeded during the current rally, a top in natural gas will be found at some point, and it may match with an ABCD target.
The ABCD pattern looks to identify price symmetry between the second CD leg of the advance and the initial AB leg. Symmetry first occurs when the price appreciation in each advance matches. Subsequently, Fibonacci ratios are used to identify extended targets for the CD leg. For example, for the 261.8% target, the price distance of the AB leg is multiplied by the Fibonacci ratio to derive a target of 2.86.
Relative Strength of Current Rally
The current rally of 73.5% is well above the prior two greatest advances since the first bottom of the downtrend in February 2023. There were four prior larger rallies from 34.7% to 53.9%. The current advance of 73.5% clearly exceeds the previous rallies. This points to a likely change in character as natural gas further shows strength and provides signs of a transition from a downtrend to an uptrend, in which case the 3.00 price zone becomes more likely to be reached.
Read Full Story »»»
DiscoverGold
Death of a Hardliner. The Energy Report
By: Phil Flynn | May 20, 2024
Iran confirms the death of President Ebrahim Raisi and Foreign Minister Hossein Amirabdollahian. They died in a helicopter crash. President Raisi legacy was one that did little to foster peace in the world nor did he seem to do anything to improve the economic conditions of the Iranian people. And the oil market at this point seems unmoved.
The oil market also seems to be unmoved and reports that Saudi Prince bin Salman had to cancel his trip to Japan because of the concerns about the health of his father the king. Reports say that Saudi Arabia’s King Salman, 88, was diagnosed with a lung infection and will undergo treatment with antibiotics, according to state media.
The oil market seems to be the commodity that has drawn the short straw as metals continue to shine. Copper prices surged above 11,000 a ton, a record high as supply shortages is finally being recognized by the futures market.
The hedge funds have pulled a lot of money out of oil and put it into other commodities. It seems that many do not look at oil as an inflation hedge. Strength in the precious and industrial metal suggests that oil will not have too far to fall. Oil is bottoming and while the bounce out of this range has been less than impressive, it also suggests that there is limited downside as well. We like oil because we believe that the increase in demand by refiners will start to result in substantial crude oil supply draws here in the United states. We like oil because we believe that the demand from India and China is going to rise significantly over the coming months especially with China trying to boost its economy and its real estate sector that is also a reason why copper is doing well.
The reason why, according to Reuters, that gasoline export fell to the lowest level since 2015 is because of recovering domestic Chinese gasoline demand. Gasoline demand in the United States on the other hand is still relatively weak, coming in below 9 million barrels a day for three consecutive weeks. The big question we have going forward is will Americans get back behind the wheel and top off the tank. AAA’s gasoline prices are at 359 a gallon which is roughly a nickel higher than they were a year ago on this day.
The other question people have is why the Energy Information Administration has adjusted the US oil production number in almost a month. Sone voice concerns that US shale production may be topping out in part because of the fear of stricter regulations by the Biden administration causing a pullback in oil and the investment in the industry.
The other concern is that the government is now going after Scott Sheffield, founder and longtime CEO of Pioneer Natural Resources, of attempted collision with OPEC over alleged price fixing. Yet the governments attack on Scott Sheffield, who obviously was trying to coordinate oil production with OPEC to keep fuel producers from going out of business, might be another reason why all the hostile environment in the United States oil and gas may make it less attractive to investors.
Regardless we believe that we will start to see crude oil supplies draw here in the United States. This week we are looking for crude oil inventories to fall by 4 million barrels we expect gasoline inventories will also fall by 3,000,000 barrels. Distillate inventories will fall by 2.2 million barrels. We expect gasoline inventories to show a 1.0 increase in refinery runs.
Natural gas is continuing its recovery. EBW Analytics reports that the natural gas rally extended to the highest level since mid-January as a hot forecast shift added 20 CDDs and back-to-back bullish EIA storage surprises provided support for the ongoing rally higher. Technical presage another 5-10% of incremental upside ahead. Still EBW says that NYMEX futures are nearing fundamental fair value as higher prices incentivize producers to return supply and higher prices catalyze power sector gas-to-coal switching. Nonetheless, momentum can carry futures above long-term fair value in the short-to-medium term.
Read Full Story »»»
DiscoverGold
$XLE This setup is looking electric
By: TrendSpider | May 18, 2024
• This setup is looking electric. $XLE

Read Full Story »»»
DiscoverGold
WTI Crude Oil CoT: Peek Into Future Through Futures, How Hedge Funds Are Positioned
By: Hedgopia | May 19, 2024
• Following futures positions of non-commercials are as of May 14, 2024.
WTI Crude Oil: Currently net long 233.5k, up 19.5k.

Yet again, a rising trendline from last December when West Texas Intermediate crude bottomed at $67.71 was breached intra-week but defended by the end of the week. This week’s low of $76.70 undercut last week’s $76.89 but only to attract bids and close the week up 1.7 percent to $79.58, for a weekly hammer. Last week produced a weekly doji. Earlier, the crude came under pressure after ticking $87.67 on April 12th.
Odds favor a move higher, on condition that this week’s low is not decisively breached. A couple of weeks ago, WTI fell back into a well-established range between $71-$72 and $81-$82 that persisted for 19 months before the upper end gave way seven weeks ago.
Immediately ahead, the upper end likely acts as a magnet. The 50- and 200-day lie at $81.76 and $80.01.
In the meantime, US crude production in the week to May 10th was unchanged for 10 consecutive weeks at 13.1 million barrels per day; 12 weeks ago, output was at a record 13.3 mb/d. Crude imports decreased 225,000 b/d to 6.7 mb/d. As did stocks of crude, gasoline, and distillates, which respectively dropped 2.5 million barrels, 235,000 barrels and 45,000 barrels to 457 million barrels, 227.8 million barrels and 116.4 million barrels. Refinery utilization increased 1.9 percentage points to 90.4 percent.
Read Full Story »»»
DiscoverGold
NY Crude Oil Futures »» Weekly Summary Analysis
By: Marty Armstrong | May 18, 2024
The NY Crude Oil Futures has been in an uptrend for the past 2 days closing above the previous session's high. Currently, the market is trading in a neutral position on our indicators but it is trading strongly higher up some 2.45% from the previous session low. Our projected target for closing resistance for the next session stands at 8114, we need to close above that target to imply a further advance. Failure to even exceed this intraday warns that the upward momentum is starting to decline. Nevertheless, this session closed below our ideal projection for closing resistance warning that the market which stood at 8190 is forming a high. A break of this session's low of 7858 will warn that we have a potential temporary high in place. Our Stochastics are all pointing upward while our internal momentum models have also remained in a bullish posture.
ECONOMIC CONFIDENCE MODEL CORRELATION
Here in NY Crude Oil Futures, we do find that this particular market has correlated with our Economic Confidence Model in the past. The Last turning point on the ECM cycle low to line up with this market was 2020 and 2009 and 2001 and 1998 and 1994. The Last turning point on the ECM cycle high to line up with this market was 2022 and 2018 and 2011 and 2000.
MARKET OVERVIEW
NEAR-TERM OUTLOOK
The historical broader tone of the NY Crude Oil Futures has been a bearish consolidation following the high established back in 2008. Since then, this market has created 2 reaction highs which have been unable to break this overall protracted bearish consolidating trend. Still, the major low was made in 2023 and the market has bounced back for the last year. The last Yearly Reversal to be elected was a Bullish at the close of 2023.
This market remains in a positive position on the weekly to yearly levels of our indicating models. Nevertheless, it closed last year on the weak side down from 2022. Pay attention to the Monthly level for any serious change in long-term trend ahead.
Focusing on our perspective using the indicating ranges on the Daily level in the NY Crude Oil Futures, this market remains neutral with resistance standing at 7980 and support forming below at 7938. The market is trading closer to the support level at this time.
On the weekly level, the last important high was established the week of April 8th at 8767, which was up 17 weeks from the low made back during the week of December 11th. We have seen the market drop sharply for the past week penetrating the previous week's low and yet it recovered to close above the previous week's close of 7826. We are trading below the Weekly Momentum Indicators warning that the decline is very significant and we need to pay attention to the timing and reversals. When we look deeply into the underlying tone of this immediate market, we see it is currently still in a weak posture. Immediately, this decline from the last high established the week of April 8th has been important closing sharply lower as well. Before, this recent rally exceeded the previous high of 7960 made back during the week of November 27th. Nonetheless, that high was actually lower than the previous high made the week of October 16th suggesting this market has really been running out of sustainable buying for right now. This immediate decline has thus far held the previous low formed at 6771 made the week of December 11th. Only a break of that low would signal a technical reversal of fortune and of course we must watch the Bearish Reversals. Right now, the market is below momentum on our weekly models casting a bearish cloud over the price action. Looking at this from a wider perspective, this market has been trading up for the past 22 weeks overall.
INTERMEDIATE-TERM OUTLOOK
YEARLY MOMENTUM MODEL INDICATOR
Our Momentum Models are declining at this time with the previous high made 2021 while the last low formed on 2023. However, this market has declined in price with the last cyclical low formed on 2023 warning that this market remains weak at this time on a correlation perspective declining in both price and Momentum.
Looking at the longer-term monthly level, we did see that the market made a high in September 2023 at 9503. After a four month rally from the previous low of 8346, it made last high in September. Since this last high, the market has corrected for four months. However, this market has held important support last month. So far here in May, this market has held above last month's low of 8070 reaching 8070.
Some caution is necessary since the last high 9503 was important given we did obtain one sell signal from that event established during September 2023. That high was still lower than the previous high established at 12368 back during June 2022. Critical support still underlies this market at 6700 and a break of that level on a monthly closing basis would warn of a further decline ahead becomes possible. Nevertheless, at this time, the market is still weak trading beneath last month's low.
DiscoverGold
Natural Gas Price Forecast: Bull Trend Continues Towards 2.68
By: Bruce Powers | May 17, 2024
• With a 65.4% rise from the April low, natural gas targets 2.68-2.70, backed by strong bullish momentum and key breakout signals.
Natural gas surged to a new trend high of 2.64 on Friday and it continues to trade near the highs of the day, at the time of this writing. That put it up by 65.4% from the April 25 swing low (C). A bullish trend continuation signal was triggered on a rally above Thursday’s high of 2.575.
The advance also signaled a breakout from the 2.56 price target for a rising ABCD pattern extended by 200%. Resistance was seen yesterday near that price level. It reflects price symmetry between the two swings in the pattern. The CD leg of the advance is two times the initial AB leg. Therefore, it looks like natural gas is going to the next target zone as shown on the chart.

Fibonacci Confluence on the Radar
Next, watch the approaching Fibonacci confluence zone from 2.68 to 2.70. The price of natural gas may get there quickly as it is on track to end the week near the highs of the week, and bullish momentum has accelerated as seen in Friday’s wide price range and strong green candle. Further up is the top line of a declining blue dashed trend channel, as well as the 78.6% Fibonacci retracement at 3.00.
Caution Warranted as Natural Gas Further Extends
This looks like a swing back rally in response to the sharp decline from the January 12 swing high of 3.38. Natural gas fell by 1.86 or 54.9% in 25 days, finding a bottom at 1.52. Since the subsequent swing low at 1.58 (C) the price of natural gas has risen by as much as 65.3% as of today’s high. The relative strength index momentum oscillator (RSI) continued to rise today and reached a height not seen since the peak in April 2022.
That peak was followed by a quick 21% decline to the 38.2% Fibonacci retracement. If a similar scenario were to unfold with the current rally, natural gas would complete a 38.2% retracement at 2.23. That is assuming that 2.64 turns out to be a swing high. On the other hand, if the retracement began from the top of the upcoming resistance zone at 2.70, a 38.2% retracement would put natural gas around 2.28.
Read Full Story »»»
DiscoverGold
Crude Oil Continues to Consolidate
By: Christopher Lewis | May 17, 2024
• Crude oil markets have consolidated a bit during the course of the trading week, but it does look like we have plenty of support underneath. Because of this, I think we are trying to build some type of base to get moving, but right now we just don’t have any follow-through.
WTI Crude Oil Weekly Technical Analysis
The West Texas Intermediate crude oil market has initially fallen during the week, only to turn around and show signs of life. At this point, it is worth noting that we have bounced from the 50% Fibonacci retracement level.
And of course, we are looking at the 50 week EMA just above, which on the daily chart is also the 200 day EMA. And then, of course, we’re paying attention to the $80 level. In general, if we can break above the $80 level, then I think the market can go higher, perhaps reaching the $85 level over the longer term.
Psychologically speaking, this is travel season, so therefore most of the time oil does fairly well. That being said, it doesn’t necessarily mean that it’s going to be an easy grind higher. But I do think that it’s easier for the market to rise than fall for a significant move.
Brent Crude Oil Weekly Technical Analysis
Looking at the Brent market, it’s very much the same situation bouncing from the 50% Fibonacci retracement level facing the 50 week EMA and the $84.50 level is a major barrier. If we can break above there, then it’s likely that we could go looking to the $90 level. On the other hand, if we were to break down below the bottom of the hammer on either grade, that probably drags oil on the whole down within the 61.8% Fibonacci retracement level would be an area that a lot of people would be paying attention to.
So do keep that in the back of your mind. That could be the next support level. Either way, this is a market that I think is going to continue to be very choppy on short term charts, but there are a lot of geopolitical concerns out there that could flare up and send oil straight up in there. So, keep that in mind.
Read Full Story »»»
DiscoverGold
Fire And Rain. The Energy Report
By: Phil Flynn | May 17, 2024
I’ve seen fire and rain and both of those could impact oil prices today. Massive rains in Houston have caused flooding and could impact oil production and potentially refining activity. While at the same time Canadian wildfires could threaten 2.1 million barrels of Canadian oil production a day in the worst-case scenario according to a report by Rystad Energy.
Fox Weather reported that the Houston metro area was rocked by severe storms that left 4 dead and over 1 million without power. They say that a storm system spawned severe thunderstorms in Houston Thursday, causing at least four fatalities and leaving more than 1.0 million customers without power across southeastern Texas. The oil market is going to watch very carefully as to what potential disruptions these storms might cause. Power outages reduce demand for electricity but at the same time it could impact refining operations and while we have no direct reports, we’re going to be watching the wire to see if there’s any that are reported.
We did see a big jump back up in the beleaguered gasoline crack spread yesterday in a signal to refiners they need to ramp up production of gasoline ahead of the Memorial Day holiday. In recent weeks gasoline demand has been disappointing to say the least but the bounce in the crack spread suggests that we could see a rebound soon.
This comes as we head into a weekend where the market is expecting the Fed to have some leeway to cut interest rates after we saw initial jobless claims yesterday come in stronger than expected and saw weakness in the Philly fed manufacturing number. Also a weakness and housing starts and building permits and while import prices came in a little bit hotter than expected, the market doesn’t believe that there is an increased chance of perhaps more than one interest rate cut before the end of the year.
Reports that China is making moves to stimulate its housing market is supportive to oil and gas. The People’s Bank of China effectively scrapped the nationwide minimum mortgage interest rate while cutting the minimum down-payment ratio to 15% for first-time buyers and 25% for second homes, according to a statement on Friday. The previous ratios stood at 20% and 30%, respectively according to Bloomberg News.
Reuters is also reporting that China’s industrial output grew by 6.7% year on year in April as recovery in its manufacturing sector gathered pace, accelerating from the 4.5% in March and pointing to possibly stronger demand for oil to come.
All this signals that the recent correction in oil as well as the crack spreads should be nearing the end. We know that gasoline demand is being impacted by the consumers being hit with inflation pressures. There are signs that we could be turning the corner with weakness in manufacturing data that has helped ease some of the tightness in the diesel product market. And if the damage in Houston to refineries is small, we would expect to see big draws in crude oil inventories in the next few weeks. While the correction may try to retest if we get bad economic news from these levels, we feel that the risk on the downside is a lot less than the potential risk on the upside.
We are also seeing stronger demand for natural gas because, gosh darn it, low prices sometimes start to cure low prices. Gas prices are up over 43% with renewed hopes that liquefied natural gas exports will pick up and production will level off. While we did see some signs of production leveling off, it did bounce back. Yesterday the Energy Information Administration reported demand for natural gas for electricity generation hit an all-time high in January. The United States power generation from natural gas has risen over the last 2 years and most likely will again this year. And we’re starting to see some hope in the storage numbers, we may be whittling down the massive inventory as the EIA reported a smaller than expected increase in storage. They said that, “Working gas in storage was 2,633 Bcf as of Friday, May 10, 2024, according to EIA estimates. This represents a net increase of 70 Bcf from the previous week. Stocks were 421 Bcf higher than last year at this time and 620 Bcf above the five-year average of 2,013 Bcf. At 2,633 Bcf, total working gas is above the five-year historical range.
Read Full Story »»»
DiscoverGold
Natural Gas Bullish Momentum Continues but Overdue for a Correction
By: Bruce Powers | May 16, 2024
• The recent surge in natural gas prices has been remarkable, with the commodity hitting a new high and breaking through key resistance levels.
Natural gas blasted through potential resistance at the 200-Day MA on Thursday to hit a new trend high of 2.575. Resistance then kicked in leading to an intraday pullback. That high completed a rising ABCD pattern where the CD leg was 200% of the advance in the AB leg of the pattern. The 200-Day MA is at 2.46 and natural gas continues to trade above that price level at the time of this writing. A daily close above the 200-Day line indicates that the uptrend may have more to go.
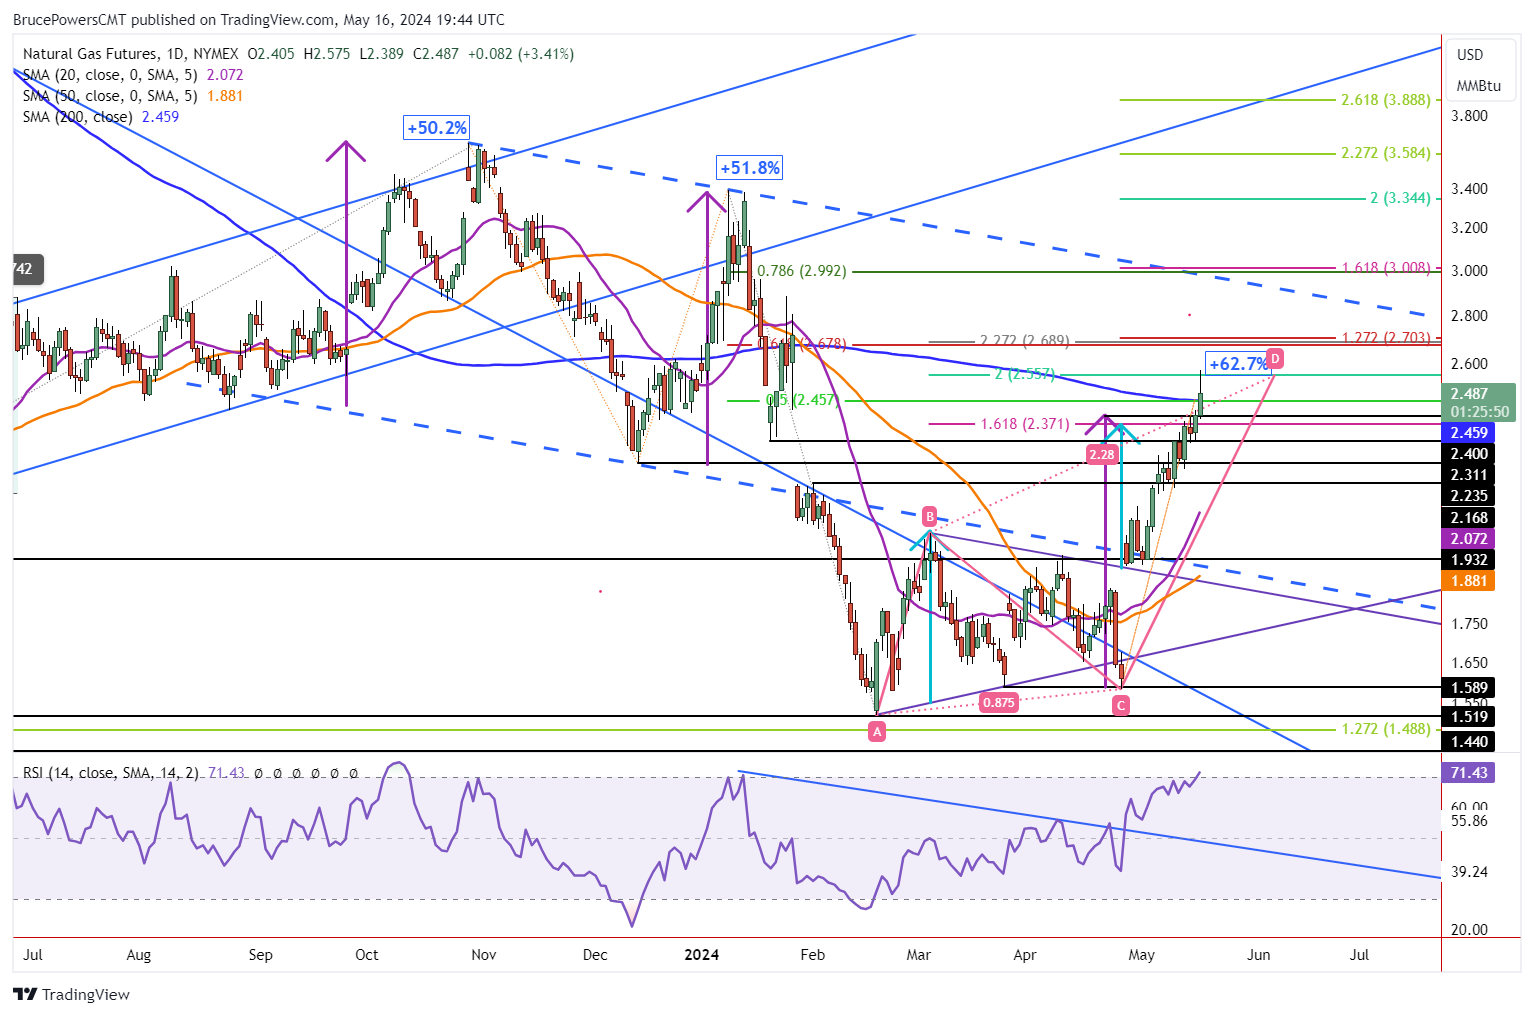
Can Strength Continue?
Certainly, today’s bullish price action is a sign of strength as natural gas recently busted through three price zones that could have seen resistance, especially the 200-Day line. However, can demand remain strong enough to take out today’s high and keep rising? That remains to be seen.
Rally Extended
The current rally is extended and closer to a top than it has been. As of today’s high, natural gas is up by 62.7% from the April 25 swing low at 1.58. That makes the current rally the largest on a percentage basis since the initial trend low from February 2023. Nevertheless, if the 200-Day MA can continue to act as support, the price of natural gas has a chance of continuing its rise. The next higher target zone is at 2.68 to 2.70. Those price levels are the 61.8% Fibonacci retracement and a 127.2% extension of a 51.8% measured move (purple arrows) that matches the rally beginning in August 2023, respectively. The high target is the top blue dashed falling channel line.
Drop Below 2.39 Should Lead to Deeper Pullback
A decisive drop below the 200-Day MA may provide an initial indication that a retracement may be coming. But a drop below today’s low of 2.39 will provide a clearer short-term bearish signal. Potential support from the 20-Day MA is down at 2.07. Higher price levels to watch on the way down are marked on the chart in black right extended lines from prior swing highs and lows. They include 2.31, 2.23, and 2.17. Fibonacci levels will be added on the chart if a retracement begins.
Read Full Story »»»
DiscoverGold
The energy sector $XLE is starting to look enticing again
By: TrendSpider | May 16, 2024
• The energy sector is starting to look enticing again. $XLE
Top holdings: $XOM. $CVX, $COP, $EOG, $SLB, $MPC

Read Full Story »»»
DiscoverGold
Crude Oil Continues to Find Value Hunters
By: Christopher Lewis | May 16, 2024
• The crude oil markets have bounced back after selling off again, as the oil markets enter what is typically a very bullish time of year for the markets.
WTI Crude Oil Technical Analysis
The West Texas Intermediate Crude Oil Market initially pulled back a little bit during the trading session on Thursday, but then turned around to show signs of life again. This is an area that I think will continue to be consolidated and it’s probably worth noting that the market is paying close attention to the 200-day EMA and the $80 level above. If we can break through all of that, then I think the WTI crude oil market continues to rally for a bigger move. It might be worth noting that the 50% Fibonacci retracement level is just below as well, and that of course brings in technical traders also. In other words, I’m somewhat bullish, but cautious, I’m not willing to throw a ton of money into the market.
Brent Crude Oil Technical Analysis
Brent looks exactly the same to me. 200 day EMA and the $84.50 level above offering resistance, but it certainly looks as if the 50% Fibonacci retracement level is coming into the picture to keep oil somewhat afloat.
There is a cyclical argument to be made for crude oil this time of year, and then of course there’s a lot out there that could have influence due to geopolitics. So really at this point, I have no interest whatsoever in shorting the market. I think this is an area of value that people will eventually take advantage of in trying to send oil much higher as they typically do during the summer anyway.
Read Full Story »»»
DiscoverGold
|
Followers
|
100
|
Posters
|
|
|
Posts (Today)
|
0
|
Posts (Total)
|
10984
|
|
Created
|
04/21/06
|
Type
|
Free
|
| Moderators DiscoverGold | |||
Welcome to: Oil & Natural Gas - Energy - Commodities - Resources
Under Contruction:
OIL & GAS STOCK NEWS.COM
TICKER SPY.COM for DD & research
PLEASE READ - This is concern for all , market maker signal for shares.
100-I need shares
200-I need shares badly,but do not take it down
300-take the price down to get shares
400-trade it sideways based on supply and demand
500-gap one way or another,to the direction of the 500 trade.
ADDING THIS 4/22/06: In my experiences I Noticed When In Sub Penny Add a Zero!! - Mick
***DISCLAIMER***
- The Board Monitor and The Board Assistants herewith, are not licensed brokers and assume NO responsibility for the actions, investment decisions, and or messages posted on this forum.
- We do NOT recommend that anyone buy or sell any securities posted herewith. Any trade entered into risks the possibility of losing the funds invested.
- There are no guarantees when buying or selling any security.
PLEASE MARK BOARD & MODS -- PLUS SIGN UP FOR OUR EMAIL LIST!
| Volume | |
| Day Range: | |
| Bid Price | |
| Ask Price | |
| Last Trade Time: |


