 News
News  Market Data
  Discover
Support: 888-992-3836
Copyright © 2023 InvestorsHub Inc.


Register for free to join our community of investors and share your ideas. You will also get access to streaming quotes, interactive charts, trades, portfolio, live options flow and more tools.
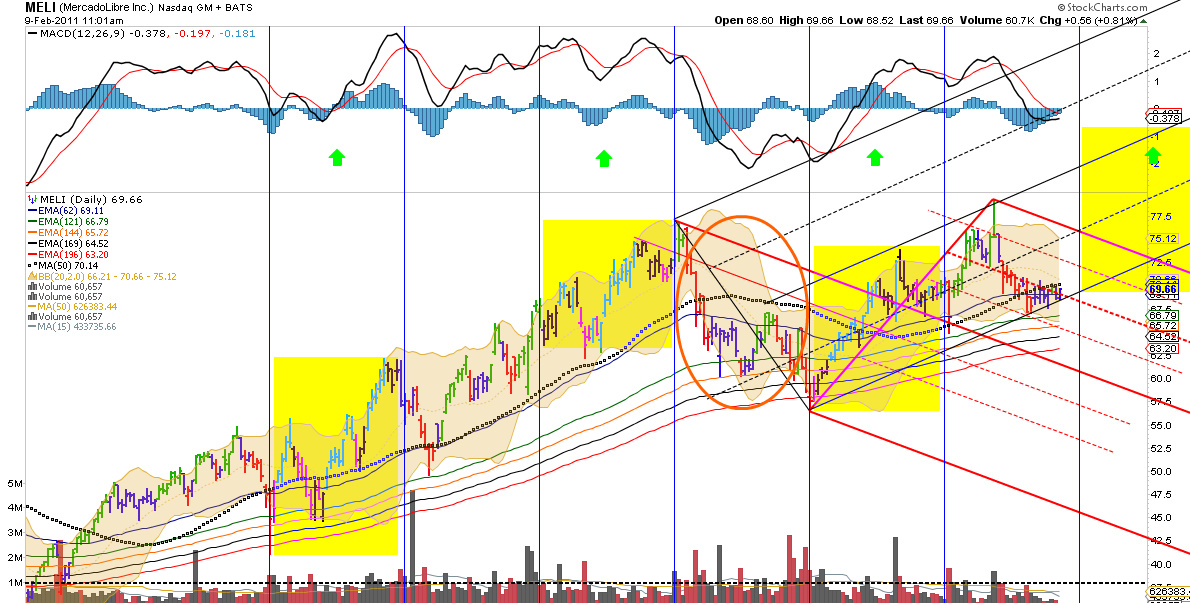
~MELI~ is absolutely beautiful at this point...finally we got a close above the 50dma...all indicators have cooled off and are now most are pinching...I expect momo to kick in when the big boys see this...volume should increase, and we most likely will get a decent run into earnings (feb 22nd)...my price target is at least $80...
...its sit back and watch time now...congrats if you joined me a little early...our chances are now much greater...while nothing is ever guaranteed, the technicals are in our favor...good luck everyone...
...you may have made the right move...
...I dont think its really safe until it closes above its 50dma (70.25)...I love to get in before the big guys pile in...they wont take this seriously until it crosses that 50dma...once that happens, I can sit back and watch the chart take care of itself...I really believe that ~MELI~ is going to break all time highs this run...
...I was hoping that some would join in, but Ive been gone awhile...maybe people feel like Ive lost my touch or something...lol... ...this play will turn some into believers...my T/A is for real...
I was debating to buy some calls yesterday but decided to enter wait and see mode until sometime in March. Its looking like it will be a good play though.
...a close above 70.25 would be perfect...=(50 dma)... also would form an Engulfing Bullish Candle...
...I cant believe noones with me on this one...~MELI~ = BEAST... ...(but lets get a close above the 50 first)...lol...
...you can lead a horse to water...but you cant force it to drink... ...price/risk ratio is phenomenal here folks...
...wow...Ebay owns over 8 million shares...
...guess thats a good way for them to penetrate the Latin Markets...strong vote of confidence indeed...

Link: http://www.dailyfinance.com/company/mercadolibre-inc/meli/nas/institutional-ownership
~MELI~ positives/negatives
protective stop @ 67.00
...there are many positive aspects of this chart...the one negative that I have seen is identified on this chart...50 dma resistance...if we break through that, its blue skies...
...Excellent observations tothe...thanks for the help...I have to study your chart closer now...
...Watching the LATIN AM. Sector via ETF's...
...this chart contains two Latin American ETF's which can help us keep our pulse on the sector/region as a whole...
MELI ~ ILF charts
MELI chart: OBV shows one of the larger shareholders sold shares in November. Share structure started stabilizing righi away even through the correction last month. As retail sold in profit taking last month, OBV continued to rise: whoever is buying is shrinking the trading float. ChiOsc is showing that for whole month of February that MM's were buying into the run, confirmed by CMF(5). MFI(66) is showing no long term money out while CMF(60) has crossed into positive territory.
What I see here is a slow growth stock where you have intermediate traders in the play as indicated by the sawtooth AccumDist and in & out of money shown in the CMF(5&20).
The up-slope in OBV means someone other than a trader is buying, volume money flow is positive. If there is a good 10-k in the cards next month the momentum/trend indicators will start turning up and some of them sharply.
What is a float lock-down????
Institutional ownership..shows 110% ownership...whaaaaa???
http://www.dailyfinance.com/company/mercadolibre-inc/meli/nas/institutional-ownership
Quick fundies
http://finviz.com/quote.ashx?t=meli&ty=c&ta=1&p=d
Filings
http://www.sec.gov/cgi-bin/browse-edgar?CIK=0001065088&action=getcompany
TOTHE's charting compilation
I use the three indicators below to track the sentiment of the different sectors of investors in a stock, their actions on the chart coincide with the actions within these three different sectors of investors/traders:
First... On Balance Volume is the one that tracks insider and registered shareholder money going in and out of the stock, the OBV indicator will go down when different SEC forms are filed showing dilution by insiders.
Second ... Accumulation/Distribution tracks the individual retail shareholder. many times Accum/Dist will go up while the PPS of a stock is going lower and lower; also while the PPS is going lower, investors on the message board for the stock, will be talking about buying, and how many shares they hold.
Thirdly... Chaikin Oscillator controls the PPS more than the other two.... the PPS will tank when this indicator goes down, even if OBV and Accum/Dist are going up, this fact alone makes know this indicator tracks "the shares" that rule the stock (MMs in other words). OBV, and Accum/Dist can be going up, but until ChiOsc goes up the PPS will stay lower, or continue going down..... Chiosc can go up before the PPS goes up, indicating that MMs are accumulating before a run. Now that the shorting rule has changed to allow shorting on the way down, they can cover on the way down, this also makes it easier for them to short a stock into the ground.
Note on BB's that I have found after much observation:
The bottom bollinger Band isn't used to detect shorting, it is a percentage indicator of the PPS movement. The bottom bollinger will go down fast when a stock has a low beta (CCME is .59), and makes a significant move. MMs will usually keep the "close of the day" in a tight range to bring the Bottom B Band up to the PPS area before taking the PPS up. A good book to read for Bollinger Bands is "Bollinger on Bollinger Bands" by Bollinger.
Summery
OBV = Insiders, big share holder investors(institutional, etc) and Registered shareholders (that is; individual shareholders with more than 5% holdings in the company).
Accum/Dist = over the counter individual Retail shareholders with less than 5% of the company stock.
ChiOsc = those who control the stock PPS and chart actions, that being MMs.
These three technical indicators have explanations on StockCharts.com and other places, that tell what they do technically, but they also work to track the buy/sell sentiment of the different sectors of shareholders.
Breakout indications you would watch for OBV, CHiOsc, MFI and Accum/Dist all turning up together... with less weight to Accum/Dist. & more weight to ChiOsc & MFI turning up together.
CharbiesLarby's single trigger charting compilation
When I look for a bottom on the charts I often like to play the FullSTO, a great indicator of a bottom. I will not enter a stock until the STO performs an up-cross and breaks the 20 on a positive trend. I will generally sell when the STO forms a top above 80. The beauty of playing this pattern is you don't need to hold until the top, a buy when the STO is bottomed out is almost guaranteed to go green-ALMOST.
annotated example
http://investorshub.advfn.com/boards/read_msg.aspx?message_id=59464157
His board
http://investorshub.advfn.com/boards/board.aspx?board_id=18191
kgoodrich's Trigger list compilation
#1. AROON- 8 you watch as the Aroon down crosses the 75 down and the aroon up comes up from zero. Most important. (\0/)
#2. WILLIAMS%R- 9 You watch the line cross the 50.
#3. CMF- 15 You will usually only see growth when the CMF is in the negative.
#4. ADX/DMI-5 You watch as the D+ line either crosses the D-, or crosses above the 20.
#5. MACD histogram- 5,15,10 You watch the negative bars register -50% smaller then the bar before it, or -50% smaller then the largest in the grouping.
#6. Full Stoch- 5, 5 You watch the fast line cross the slow line while the aroon down(8) crosses the 87.50. Crossing the 20 would be best, when the williams agrees.
#7. Bollinger Band 20,2 You watch for the Magic Box to occur when the negative close touches above the lower bolly and the next day’s close to it is positive growth in a white candle.
#8. RSI 5 you watch as the indicator crosses above the 50 for a quick pop.
Links to kgoodrich or Chartinator on chart application toward buying stock for the compound
http://investorshub.advfn.com/boards/read_msg.aspx?message_id=37119243
Lowtrade charting compilation
Momentum
TRIX - rate-of-change of smoothed moving average
momo
StochRSI - overbought and oversold levels in RSI
momo
ROC - percent change
momo
Stochastic - over bought / over sold
momo
RSI - Average Gain / Average Loss
momo
WM%R - price close vs. range top /bottom
momo
----------------------------------------------------------
Trend
Aroon - close high /low
trend
DMI - price direction / ADX strength
trend
ATR - gap /small move - up down reversal
trend
Macd - +/- moving averages - direction & strength
trend
PPO - increasing / decreasing price
trend
-----------------------------------------------------------------
Volume
PVO - increasing / decreasing volume
volume
OBV - close above vs below totals
volume
Acc/Dist - ave close totals
volume
CMF - A/D strength divided by volume = pressure
volume
MFI - RSI volume-weighted
volume
TRIX & Aroon are trend indicators, not momo. As they are not oscilators but do present a stocks trend indication.
momentum/ trend indicators
RSI, & MFI; are oscillators. Good for support of trend.
MFI over bought over sold; 0 to 100, 50 is zero
RSI over bought over sold; o to 100, 50 is zero
The Money Flow Index (MFI) is a momentum indicator that is similar to the Relative Strength Index (RSI) in both interpretation and calculation. However, MFI is a more rigid indicator in that it is volume-weighted, and is therefore a good measure of the strength of money flowing in and out of a security
Volume indicators
OBV & CMF are volume indications good for pressure expected when a move starts.CMF shows pressure. 0 is zero + positive, - negative
Accumulation Distribution shows pressure, bottom is zero shows increasing and decreasing. Not +/-
OBV being less useful then AccumDist, AccumDist which is in turn less useful the CMF. Because AccumDist was an improvement to OBV and CMF an improvement to AccumDist. We should always put more weight on CMF.
Being in or being out vs.get in or get out: RSI and MFI
Like StochRSI, MFI shows 2 indications. Strength & overbought/oversold, because it graphs like an oscilator. It mainly relies on RSI for it's basis.
MFI uses volume with RSI to determine if more money is coming into a stock, then going out. And because the consensus is, price follows volume. You can judge entry/exit with the RSI position on the graph. MFI above 80 signals entry and below 20 exit.
While StochRSI signals Be In the stock or Be Out of the stock. MFI signals get In or Out.
It has a different focus then OBV, Acc/Dist, or CMF. While being in the volume group, because it uses volume in it's formula. It is mainly used for decision making, rather then support.
Like the Aroon, I disagree with where the books place this indicator. I would put it in the momo group, where you find other decision making indicators. They have the aroon in the momo group for decisions and I would place that in the trend group.
RECAP, MFI determines entry exit, or positive negative momentum. It's name and placement in the volume group is misleading. IMO
Summery
Choose 3 indicators, one trend, one momentum & one volume. Your watching for trend entry, will retail support your decision and how strong to expect any move you enter, will be. My choices to fulfill these are DMI, StochRSI and CMF.
sources
http://investorshub.advfn.com/boards/read_msg.aspx?message_id=45219382&txt2find=mfi
http://investorshub.advfn.com/boards/read_msg.aspx?message_id=45336616&txt2find=mfi
http://investorshub.advfn.com/boards/read_msg.aspx?message_id=45337703&txt2find=mfi
http://investorshub.advfn.com/boards/read_msg.aspx?message_id=48320279&txt2find=mfi
http://investorshub.advfn.com/boards/read_msg.aspx?message_id
Be careful guys if your trading this...~MELI~ is holding on strong, but I see sector weakness through the ~ILF~...Its very hard for a stock to move against its sector...
~MELI~ down 0.49%
~ILF~ down 2.53%
...If we dont get some kind of bounce from here it could get ugly...
...Major markets are down, so that is a factor...
...I am holding my position, but just giving fair warning to others that arent seeing this weakness...I am not in the business of leading others to losses...
I did one on NTWK last nite but din't post it, CCME has me so distracted that I am capable of hurting my forehead on the keyboard nodding off..
...thanks tothe...I definitely would appreciate your technical take especially in regards to money/volume/acc/dis flow...
...please give me your honest take, good or bad...I know that I was a bit early on the trigger as emerging markets are under a little pressure,but I believe that Latin American stocks are going to be the eventual winners in the near term in terms of relative strength...
...thanks...
I will post a chart tonight. I work on annotations after trading hours because I share my account with traders and there is a limit on number or auto-refresh charts you can have up at one time.
...the early case {chart}...
...this chart reflects one of the reasons that I believe that the people getting in now are the early birds for the next big run...
JP Morgans Price target is $82...my price target is $90 - $100...
...I do not make a lot of stock calls...but when I do, I try to make them count...time cannot hide the truth...
...couldnt believe that it didnt have a board...LOL...deserves a little attention Id say...lol...
Performance charts:
...since ~MELI~ is absolutely one of the strongest Latin Stocks, it dramatically outperforms its sector...
...so, if we are really about to get a sector rotation expect ~MELI~ to hit all time highs very soon...

lol, I was just looking for the MELI board yesterday trying to find some DD. I'll be paying attention.
thanks...big move coming here...
Nice SixNineSevenNine! I'll keep an eye out, your work is first rate!
ATTENTION: ...why ~MELI~?...& why now?...
February 9th, 2011
...This board was started today because I am hoping to share a gift of Technical & Fundamental Analysis at its best...
...What I am noticing on a macro level in our global markets is a potentially powerful sector change and or rotation...
...with all the happenings in Egypt recently, there has been a financial shift in terms of fear... ...yesterday China also raised interest rates in an attempt to fight against rapid growth and inflation... ...these two factors have reluctantly forced some big money to de-leverage some of their holdings in the emerging markets sectors... ...All emerging markets have been under pressure for the last several weeks...
...What I have seen is strength in the emerging markets that are not in the middle east or bigger Asia...The relative strength that I am referring to is specifically the Latin American Markets...all the way across the globe away from the near-term drama...
...In fact, Jim Cramer mirrored my thoughts on tonight's Mad Money Show...
...please take a moment to watch the short skit...
(special link below)
Jim Cramers Latin America View
...Cramer was mostly touting Columbia, but the part that interested me the most is how he mentioned the influx of liquidity coming to Latin America in the near term... ...Cramer is basically giving us the heads up that there will be a Sector rotation towards Latin American country's...I strongly agree with this...
...my strategy to attempt to take advantage of this sector rotation is via Mercadolibre(~MELI~), but you could also play the Latin American ETF's (highlighted in sticky posts here)...
I have done a lot of research with ~MELI~, and I find it to be the absolute strongest fundamentally sound Latin American Growth Stock out there...It is the equivalent of a Latin American E-Bay... This coming liquidity that Cramer talks about, will benefit the entire region, but imo, no one company will benefit more that Mercadolibre...
~MELI~ is currently in a retracement period (as most emerging market companies are at this time)...but very soon, big money is heading towards this part of the world...
...I really hope that some will do a little of their own Due diligence, and surely, they will see the strength in this opportunity...
...I have provided some fairly intricate Technical Analysis on this stock...and will continue to provide more...A starter position has already been established on my part...
...I love figuring out what the big guys are going to do next...Nothing is ever guaranteed, but I am very confident in my conclusions...
...This is another opportunity where Fundamental Analysis meets Technical Analysis at the same Time... ...and I invite others to join me, early, to share in what I anticipate to be a very good series of trades in this investment vehicle...
...please feel free to comment on the board as all opinions are appreciated...
...and please, do not enter a position just on my word...do a little D & D and if you find potential in this situation and reasoning, then I welcome you...
...good luck everyone...
...Watching the LATIN AM. Sector via ETF's...
...this chart contains two Latin American ETF's which can help us keep our pulse on the sector/region as a whole...
...EARNINGS BEAT is consistent to date...
~MELI~

Next Earnings date = February 22nd 2011
JP Morgan Upgrades ~MELI~ 1-3-11 $82 target
http://www.benzinga.com/analyst-ratings/upgrades/11/01/745393/jp-morgan-upgrades-meli-to-overweight

|
Followers
|
14
|
Posters
|
|
|
Posts (Today)
|
0
|
Posts (Total)
|
83
|
|
Created
|
02/08/11
|
Type
|
Free
|
| Moderators | |||
MercadoLibre, Inc. hosts an online commerce platform in Latin America, called MercadoLibre and located at www.mercadolibre.com . The Company has operations in Argentina, Brazil, Chile, Colombia, Ecuador, Mexico, Peru, Uruguay and Venezuela. Additionally, it also operates online commerce platforms in Costa Rica, the Dominican Republic and Panama. It offers a technological and commercial solution that addresses the cultural and geographic challenges of operating an online commerce platform in Latin America. The Company offers its users two principal services: the MercadoLibre marketplace and the MercadoPago online payments solution.
Website: http://www.mercadolibre.com.ve/
Phone#: 54)11-53528000 Address: Tronador 4890, 8th Floor Buenos Aires, null null Argentina
NASDAQ: Ticker - MELI
{Information Stated Below is as of 02-08-2011}
Shares Outstanding: (mil) 44.13
Float: (mil) 30.37
Market Cap: (Billion) 3.087
Return on Equity: 37.41
Institutional Sponsorship as % of OS = 68.4%


Investor Relations Link: http://investor.mercadolibre.com/
Population of America: +/- 200 million
Internet saturation: 60-70%
Ebay Market Cap: $41 Billion
Population of Latin America: +/- 570 million
Internet saturation: 25%
MELI
Market Cap: +/- $3 Billion
(EBAY OWNS OVER 8 MILLION ~MELI~ SHARES)

| Volume | |
| Day Range: | |
| Bid Price | |
| Ask Price | |
| Last Trade Time: |


