 News
News  Market Data
  Discover
Support: 888-992-3836
Copyright © 2023 InvestorsHub Inc.


Register for free to join our community of investors and share your ideas. You will also get access to streaming quotes, interactive charts, trades, portfolio, live options flow and more tools.
Good morning Bob
Not much morning left.
I am seeing this as a positive that the market hasn't really rolled over today or I should say I see it as Bullish. In my book we are officially in the expiration window, this being WWW. The fact that we are consolidating without declining much looks bullish to me.
Max pain is tugging for lower but for today it is ignoring that.
SP Futures 1288-1280-1285
Some overnight topping seeing a pullback to potential support but the bounce from support is running into resistance.
Anticipation would be another retest of support for a double bottom.
Whether that will happen before the Market is open is the question?
For now Euro,DAX,FTSE look trend down
SP 1290 QQQ 58 as Resistance for now
Thanks, appreciate it
I like to see the MACD and DMI crossovers short term.
Both seem to indicate a potential top this AM.
Will see if we again consolidate out a while or catch some downside.
Anticipation for now is a selloff into tomorrow AM similar to Jan 4th, then see if Max Pain offers some recovery.
Bob here is the spx 15 min chart of mine.
USD and Euro I think
The Markets seem to be in Jan Effect mode and wanting up even though the Base indicators are still Iffy or Down? We have had good Econ news but most of the rallies seem to spike and selloff. My anticipation is a selloff again into tomorrow morning, then see if WWW has some recovery into EOD. Thinking we get downside into OEX after any failed rally attempt, we shall see.
Similar to this 5day 15min chart
I like to see the short term implications of the moves.
The SPX chart I was using the server label changed and it won't repost but this INDU chart still works. Can leave off the Stochastics, just like MACD and DMI if you can, thanks.
Bob do you mean a 60 min chart of the spx?
The interesting thing here, IMO is the decoupling from the USD by equities. When we last were @ 81 on the USD the spx was approx. @ 1100, which occurred at the beginning of last year (2010).
I am not bullish or bearish here.
Last expiration I was convinced we would hold 1250 or 125 spy because of Max Pain and we sold down to almost 1210 or 121 spy, which made a lot of money for some out of the money Puts at the time.
Tomorrow is WWW Wednesday and in aj's view of the Max Pain window, it opens Thurs.
Sounds Good Steve!
For now looking at SP 1295 INDU 12500 as potential Resistance.
Support at SP 1290 INDU 12400 for now, but not sure if a bounce or breakdown today. Leaning towards breakdown but might retest the resistance by eod.
The INDU 5 day chart in the Ibox is still working but the SPX 5 day they changed the server so it won't post anymore? Have been trying to get a 5 day short term chart similar to the INDU one for SPX but cannot get it to work. Can you setup a short term 5 day chart for SPX?
Enjoy the Day!
Good morning Bob, the forks were no longer valid on that daily spx chart I screencast a couple posts back. I had placed an extension above the top tine of the fork but we left that behind as well.
If this current Bullish fork is violated to the downside, it will be time to place a Bearish fork on the chart.
SP Futures 1280-1290
For now I am looking at today's candle to end up Mirroring the Dec 19th downside candle but to the upside. Today's gap has the potential to cap the Bowtie move. This last up season in the Markets seems primarily due to the rebound in Euro/Metals bottoming and bouncing imo. If the morning gap holds support for the rest of the week will be the test. I would agree that 1275/1270/1260 the support pivots here but would not rule out a spike high day that retests 1260/1250 by next week, we shall see.
TNX has been hinting at a rollover, will be watching the Euro/Metals to see if just a rinse and recycle or there has truly been renewed support.
Have a Wonderful Week!
Good Morning Steve, welcome back
Sounds as though you had a Great time visiting with family, very Nice. Always the most Fun when you can relax for a while and just Enjoy the moment :)
I am not sure if we are done yet with the Bearish fork so at least we can have it in reserve if need be, we shall see.
Bob
Here is a more current look at the daily spx chart with a Bullish Fork using the late summer drop to fix the center pivot and the lower tine.. No great conclusions from this take.
A couple points though, we are over bought looking at the stoch's, which makes going higher right here seem problematical.
On the plus side we seem to be consolidating above an important horizontal level (Ted Bruge's stuff) which has 1274.40 as a long standing horizontal line of resistance/support.
Let me add this chart should remain alive for you.
Good morning Bob
Hey I think I'm back.... never sure anymore... LOL
Long holiday season for me but it was a great gathering of my siblings and their youngan's. It wore me out a bit entertaining, I think I'm getting old... ouch.
I don't think I missed too much in the market and not making any predictions on what's to come here. What is interesting is how the triangle extensions seem to be a factor in containing price still. Here is a screencast of the spx daily because I think I can safely retire the orange bearish fork but the screencast will preserve it if we should start south again and I want to restore it for some reason.
http://screencast.com/t/AFZmxzSME50
Ditto SP Futures 1270-1275
Link back to the charts, looking similar to how Friday traded.
So far just a lot of testing between 1270-1277 with both the support and resistance holding.
Not sure if we see a break today or just consolidate, thinking just consolidate, we shall see.
SP Futures 1270-1275
Trying to trend up after an overnight dip but getting back to a resistance level.
A Lot of economic news out at 8:30 ahead of the Market open.
Anticipation is a retest of the prior high but we might have seen that already yesterday?
Any selling today could also see a double bottom bounce out of the Euro and then consolidate again.
SP Support to watch is 1270/1265, QQQ 57.50/57
Euro vs USD$
Top of the 'Bowtie'?
Was looking at the volatility to continue and a retest of the top of the Bowtie as resistance. Have we seen it today?
The bottom was a slight dip below so wondering if the top resistance will be slightly lower also?
Fed FOMC at 2pm might offer some influence in the afternoon to upside if there is nothing negative coming out.
Anticipation is that today or tomorrow we go back to Sell at Resistance, we shall see.
SP Futures 1250-1270, spike 1278
Morning spike high at 1278 might get retested at the 10am news announce. If you saw yesterday's DAX/FTSE charts they both closed HOD at EOD with a gap up today that is consolidating. Anticipation is a spike high on the 10 am news and then some consolidation into the FOMC announce at 2pm. Anticipation is today or tomorrow will be the Top of this upmove, just my speculation.
Have a Wonderful Week!
Contrasting days today?
The Euro tested a new spike high but the DAX was trend Up all day where the FTSE mirrored the Spike high surge. Looking like Tuesday could be either one unless we get some Sell at Resistance or Sell the Gap, we shall see.
Hope you all can see this before they reset in the AM.
Wishing Everyone a Happy New Year!
link back to previous post, thanks
SP Futures 1255-1260
SP Futures retested 1255 as support overnight and now retesting 1260 as resistance. So far looks like it will be a tight trading range day with mostly consolidation. Anticipation is that the Markets are back to a major resistance level and could selloff from here so use caution on Longs and it might be Safest to wait for next week to look at Shorts. QQQ retesting at 56 for support/resistance so would watch which side it will be trading on today and much like the DAX/FTSE could be swinging back and forth from yesterday's close.
Just remember to be Safe with your trades!
Have a Fantastic Friday, a Wonderful Weekend and a Happy New Year!
Up late, SP 1255-1265-1258
Not sure what caused this last selloff?
I see the DAX was testing at resistance all morning, possibly finally triggering a sell at resistance?
FTSE had a morning dip and then recovered, perhaps the Market pattern today if we get a morning double bottom?
Will be watching to see if 1260 can be recovered as support.
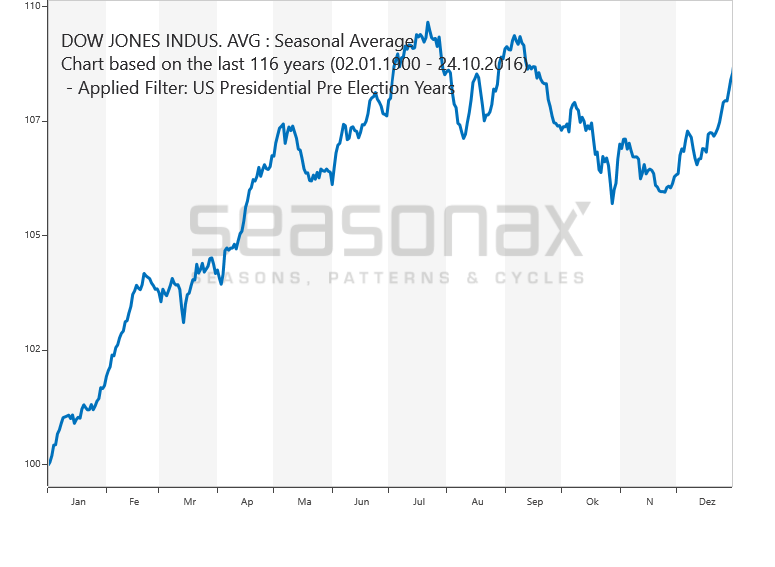
Election Years
You can see the Pre-Election year finishes strong, while the Election Year opens flat and only has a popup in Jan. Will that Jan popup be next week? For now looking for a strong close to the year.
We shall see!

SP Futures 1260-1257
Only a slight pullback in the Futures this am waiting for econ news at 9 and 10 am. FTSE is closed so looking at the DAX today showing a pullback to support for now.
Anticipation would be consolidation into the econ reports.
Possible spike high on the 10am consumer news for another 'sell the news' but will be watching for support to hold on a pullback 1260/1255/1250.
Enjoy the Day!
Have a Wonderful Weekend and a Merry Christmas Everyone!
TNX starting to participate
Will see if the gap consolidates and then moves higher like the FTSE/TNX
SP Futures tested double top 1260
So far just shy of 1260 overnight just ahead of the FTSE open.
The FTSE is showing a ramp but that is after a pullback from 1260 that tested support at 1250 ahead of it's open. So for now heading back to retest the resistance at 1260 again. Remember I mentioned the 'gap down days are buys and gap up days are sells' that seemed to be happening? I would think that today could possibly be another one of the 'gap up days that sells' after a 10/10:30 hod, we shall see.
Have a Fantastic Friday!
Euro vs USD$
SPx test
http://bigcharts.marketwatch.com/quickchart/quickchart.asp?symb=spx&insttype=&freq=&show=&x=31&y=16
Some kind of webhosting change at Bigcharts?
See if this link will duplicate the MKTSS chart, if not let me know.
SP Futures 1232-1235-1240-1245
Overnight retest of SMA support 1232 and trying to build some uptrend.
Unemployment/GDP economic news comes out at 8:30, so far nothing negative anticipated.
SP needs a good break over 1245 to retest 1250/1260, support should hold 1240/1235 at the 100SMA.
So far the FTSE/DAX mood is positive, will see if it changes on the econ news or not.
QQQ premarket high 55.30, need break to test 55.50 pivot, 55 as support.
Anticipation would be a gap up that consolidates for now.
SP Futures 1235-1250-1240-1230
You can see the spike high to 1250 in the Euro and the 1240-1230 test in the FTSE. For the FTSE it is pretty much a gap and fill from the prior day. Looks like a typical Euro sell on the News. Too bad as TNA premarket high was 56.29 which must have been at premarket open. 1230 should be Support for the SP, prior resistance as support in an uptrend, we shall see. QQQ premarket low 55.45, testing support 55.50, so back to the bullish/bearish pivot.
Anticipation is some morning recovery with the same double top selloff at 10:30 but will be watching for support to hold QQQ 55.50 SP 1230. Might be a consolidation day with an afternoon ramp, we shall see.
TNX is Trying
Day after Thanksgiving the TNX had the move back above it's trendline. So far just testing it. Prior attempted reversal days the TNX was still trending down.
SP Futures 1200-1205-1210-1213
The Euro has a big overnight recovery as do the Futures.
So far some hesitation to move higher in the FTSE, would like to see 5400 recovered. SP 1215/1220 will be the short term pivot with 1230/1240/1250 still on watch over that, so a lot of resistance to overcome. Will be watching to see if the Markets can get past the 10:30 selloff that has been halting any recovery efforts lately.
QQQ premarket high 55.02 so need to see 55 recovered as support
Happy Holidays Steve!
Hope you have a fantastic time with family and friends and a Merry Christmas and a Happy New Year.
I am leaning Bullish now since last week. Today looks like an old fashioned shake out and I would not be surprised to see the day close green. A lot of similarity to the right shoulder bottom in Mid April, especially after seeing today's pullback making it nearly identical. Still a lot of Global concerns in the Market and speculation on the $/Euro but I am starting to think more of a relief rally is due here. I think many traders/buyers are thinking the same thing here though, just take the time off and Enjoy the Season.
Wish you All the Best!
Sincerely, Bob
Hi Bob
Just a heads up. I will not post much over the next couple weeks, actually more like three weeks, as I will be busy with lots of family visiting. I have small bias towards the bullish side but no conviction either.
I see Pokersam is suggesting we climb to 1300 once we bottom, he thinks 1200 may end this drop. Carl Futia is suggesting we still need to tag 1175 before we go to 1370. All interesting but no betting from me, I will check in some. Have a good week Bob and happy holidays to you.
SP Futures 1202-1220-1215
You can see the test of recovered support in the Euro/FTSE charts. Euro offering an inverted H&S and the FTSE trying to build some higher support from it's morning open. Both are bullish but only if can get another higher breakout and higher support. Would be watching FTSE/Euro for recovered support above 5400, Euro 1.304. SP over 1220 at the MKTSS 100sma would lead us back into Bullish territory as long as it starts to Incline and hold Support. Until 1220 is recovered as Support there could still be a lot of testing.
For now anticipating the FTSE morning trend to continue bullish.
QQQ premarket high 55.30 with 55.50 the bullish pivot
A look back at SPX
If you look back at SPX March to mid April you can see the similar inverted H&S pattern we could 'potentially' be in here.
You can see the right side lower shoulder ran back up to just over 1350 beginning of May. I think this is where the 'speculation' that the SP sees another runnup over 1300 comes from.
Remember that this is just 'Speculation' based on prior chart trading patterns. Whether it will repeat is to be seen. I think if we do get a gap up on Monday the odds of it happening will be greater, we shall see.
Have a Wonderful Weekend!
Potential Mini Dragon QQQ
The Dragon has 2 bottom legs and is now testing the 'back', typical pattern would move now to retest the back 'tail' extension as a top.
http://investorshub.advfn.com/boards/read_msg.aspx?message_id=1748806&txt2find=dragon
SP Futures 1215-1220
Looking for support recovered at the 100sma 1220 to hold today.
Still resistance 1230/1240/1250 and 1250 the prior major pivot will be the biggest one to overcome. I still think we retest the top of the Bowtie before we get a big selloff, mirror to the runnup Oct but to downside. OEX might try to keep a lid on any upside today, maybe, but expect next week to stay bullish if 1220 can hold good support. Might be a slow grind though with the gap ups grinding out in consolidation. Yesterday was a test of the 100sma as resistance so today might be a test of it as support.
QQQ premarket high 55.13, looks like OEX wants close near 55 with yesterdays 55 Calls selling at .20 so will be watching 55.20 for top or breakout.
Enjoy the Day!
Up late Bob and just looking at charts from today now and will not have much time for the market tomorrow either. Interesting a bit is the daily is now back inside the original orange down fork, spending a second day there. The market IMO needs to escape the extension now sitting approx. at 1250 to allowing me to throw away the Bearish Fork. I am still slightly Bullish but no bets this week. Maybe next week.
Euro/SP testing for breakout
The Euro is in an ascending wedge and the SP is putting in the squeeze on it's 100sma. I think the next break above SP 1220 QQQ 55 could see the 100sma recovered as support and put us back Bullish.
Not sure if we see it today or not, we shall see
TNX double bottom morning
What looks Interesting in this chart is that it is a complete Mirror of the Market reversal after Thanksgiving.
Remember the Nov 25th Rally day that just happened to give it all back only to Gap Up the next trading day Monday?
Let's see if we get a Repeat eh?
Bonds post from Highhertal, interesting
"Uncle Ben is doing some POMO today and a double dip tomorrow. Remember what happened in Nov. when Ben did a double dip POMO?"
"I think the big double POMO was on Nov. 25, check out a chart what happened the following few days."
Interesting if can get a repeat eh?
http://www.newyorkfed.org/markets/tot_operation_schedule.html
Economic News is Positive
QQQ back to near 55.50 which I see as a major pivot, will see if now resistance or can be recovered.
Dec 15 8:30 AM Initial Claims 12/10 366K 390K 385K
Dec 15 8:30 AM Continuing Claims12/03 3603K 3650K 3599K
Dec 15 8:30 AM PPI Nov 0.3% 0.1% -0.3%
Dec 15 8:30 AM Core PPI Nov 0.1% 0.1% 0.0%
Dec 15 8:30 AM EmpireManufacturing Dec 9.53 3.0 0.61
Dec 15 8:30 AM Current Account Balance Q3
-$110.3B -$110.0B -$118.0B
SP Futures 1200-1215-1210-1215
You can see the 1210 test of support in the FTSE chart while the test at 1200 was at Midnight. Euro also attempting a recovery of 1.30. Would watch the FTSE/Euro charts for breakouts and SP a recovery of 1215. SP resistance levels 1215/1220/1225/1230 as seen in the MKTSS chart so a lot of resistance yet to overcome. I would expect some bouncing like the FTSE chart but let's see if today we can get a breakout and some recovered higher support.
QQQ premarket low 55 high 55.30
Good Trading!
Happy Holidays!
Remember to cherish every moment with friends and family and accept every gift being grateful for what you have received.
God Bless!
Sounds Good
Yesterday I was anticipating a 2 day rally thinking we were at support eod. I am still thinking that today and we are at a better support level near 1200 QQQ 55. I think if the QQQ and SPX could get some recovery here, along with the Euro 1.30, we could see a big short covering rally into Friday. Just my speculation though.
Enjoy the Day!
I am very surprised at this move but it does happen with Option Expiration. Although this could all reverse by weeks end but I would be surprised now if they make it back to 1250. Off to do chores today. I'm waiting for this week to pass.
Is this Volume correct?
I have not been tracking the Volume on the SPX but it certainly looks like a relatively low volume day on this drop similar to late November?
Will be watching for SPX 1220, QQQ 55 for recovery now
SP Futures 1225-1215-1220
You can see the morning bounce from support in the FTSE chart.
If you remember yesterday's FTSE rally attempt the morning started out very similar with a retest of it's prior open as support and then a day long rally until 3pm. Anticipation would be a repeat of that pattern. Watch the Euro at 1.30 and the FTSE at 5400-5500.
QQQ premarket low 55.53, SPXU premarket high 14.50 so back to yesterday's bounce point for now also.
Just remember to be Safe with your trades.
Enjoy the Day!
USD$ Upper Bollinger break=Market low?
From what I see on the USD$ chart it looks as though every upper bb band breakout the Markets make a bottom?
Why this last breakout doesn't equate to the Markets being at prior lows I am not sure?
Something is changing or else the Market are lagging and will eventually trip back to Aug/Oct lows.
Looking for the Bull flag now
Picked up the TNA as QQQ 55.50 was tagged on my computer as support and the SP tapping 1220 at the same time looked good. I am also not sure if I am using the Options quotes correctly but I had previously seen the hod on SPXU 13 Calls at 1.50 to target 14.50 resistance and TNA at 43 the 43 Call was trading at 2.30 targeting 40.70 as support so everything seemed to line up for me. A lot will depend on if this last week of trading is a Bull flag that will retest the top range of the Bowtie or not. I wanted to get some covered Calls sold before the close but had to leave.
How we open tomorrow should give us some indication of direction, either we hold support above the island gap or we don't.
If the QQQ recovers 56 and SP over 1240 then I believe 1250 will be tested again, and possibly continue higher, we shall see.
|
Followers
|
204
|
Posters
|
|
|
Posts (Today)
|
0
|
Posts (Total)
|
18894
|
|
Created
|
05/12/00
|
Type
|
Premium
|
| Moderator Bernard Ng | |||
| Assistants bbgold RCKS | |||
This thread is used to give intraday trading signals on the following markets:
1. Dow Jones Industrial Average (INDU)
2. NASDAQ Non-Financial 100 (NDX)
3. S&P 500 (SPX)
We will try to find the medium term direction (1 - 5 days) of each index by locating the important support and resistance, then match them with the chart patterns to find the potential trading range. By merging the behaviour of the corresponding index options and the intraday index trading signals, we hope to find some safe trading opportunities with huge reward in the shortest time frame.
Indexpulse 5 day chart for Short Term trades INDU
http://chart.bigcharts.com/bc3/intchart/frames/chart.asp?symb=indu&compidx=aaaaa%3A0&ma=4&maval=20%2C40%2C60&uf=8&lf=4&lf2=1024&lf3=32&type=4&size=3&state=15&sid=1643&style=330&time=3&freq=7&comp=NO_SYMBOL_CHOSEN&nosettings=1&rand=8541&mocktick=1
http://chart.bigcharts.com/bc3/intchart/frames/chart.asp?symb=indu&compidx=aaaaa%3A0&ma=4&maval=20%2C40%2C60&uf=8&lf=4&lf2=1024&lf3=32&type=4&size=3&state=15&sid=1643&style=330&time=3&freq=7&comp=NO_SYMBOL_CHOSEN&nosettings=1&rand=8541&mocktick=1
Indexpulse 5 day chart for Short Term trades SPX
Usual Trading Signals (with INDU as the reference index)
1. DMI+ cross under ADX = potential HOD, DMI- cross under ADX = potential LOD. The confirmation comes from the gap between DMI+ and DMI- (at least 20), the further apart, the better. This signal is not valid when INDU has about 200 points movement or when you get it before 10:00am. This method works best on the 5 min chart.
Buying Calls at LOD and Support and Puts at HOD and Resistance will likely give us a profit. Remember to use any volatility the first hour of trading to capture good entries and exits.
2. Indices like to Close at or near the High of Day (HOD) or Low of Day (LOD)
3. INDU hits the 320SMA on the 5 min chart.
4. INDU hits the 100SMA on the 15 min chart.
5. INDU hits the Medium Term support and resistance from a longer time frame chart, for instance, the 5 days 15 min chart or 10 days 60 min chart.
6. 15 min MACD signal: fast line cross over or cross under the slow line
7. Maximum-Pain Theory Options Analysis, http://www.iqauto.com/cgi-bin/pain.pl ,works well the week before options expiry.
8. When there is a directional divergence between TRAN and INDU, follow TRAN #msg-1008063
9. Trading Above the SMAs with the SMAs as Support is when you want to be Long or holding Calls. Trading Below the SMAs with the SMAs as Resistance is when you want to be Short or holding Puts. Exit the Calls at HOD and Resistance signals. Exit the Puts at LOD and Support signals. It is not necessary to immediately flip into the opposite trade but Safer to wait until a Market reversal is confirmed.
10.The 5 day 20 and 50SMAs crossing Positive and the markets trading Above them is a Bullish sign, the 5 day 20 and 50SMAs crossing Negative and Below them is a Bearish sign.
11. A Long Calls signal is when the 100/320SMA changes from Resistance to Support and the market is trading Above the SMA and Holding Support. A Short Puts signal is when the 100/320SMA changes from Support to Resistance and the market is trading Below the SMA and Holding Resistance.
12. and many more signals that we discuss on the thread daily.
Trading Tips and Tools:
SPX Current Trading Channels-tks RCKS!
http://stockcharts.com/c-sc/sc?s=spy&p=60&yr=0&mn=0&dy=22&id=p97206685824&a=234724271
QQQ Current Trading Channels -tks RCKS!
http://stockcharts.com/c-sc/sc?s=qqq&p=d&yr=0&mn=5&dy=0&id=p37652474569&a=234033326
TZA Short reference chart
http://investorshub.advfn.com/boards/read_msg.aspx?message_id=69054749
TNX Bond Yield chart-Inverse to Bonds but in line with Markets
http://investorshub.advfn.com/boards/read_msg.aspx?message_id=69397542
Forex Economic Calendar
http://www.forexfactory.com/calendar.php?month=this
Bull Market Cycle/ Fib Fan chart
http://stockcharts.com/c-sc/sc?s=$spx&p=d&yr=3&mn=0&dy=0&id=p37497183341&a=244523596
Read the 24hr Futures Quotes here and Plan your Trade wisely
CME 10-minute GLOBEX Flash Quotes (HTML)
http://www.cmegroup.com/market-data/delayed-quotes/equities.html
Quote.com Futures list - Click on Indices link
http://www.quote.com/us/futures/Default.aspx
VIX chart
http://stockcharts.com/c-sc/sc?s=$vix&p=60&yr=0&mn=0&dy=10&id=p22493041215&a=247969044
TREND1 RUT Chart-very useful
http://investorshub.advfn.com/boards/read_msg.aspx?message_id=69523895
DAX Chart with trading channels-tks RCKS!
http://stockcharts.com/c-sc/sc?s=$dax&p=d&yr=0&mn=4&dy=0&id=p99592837098&a=228099802
FTSE Chart with channels - tks RCKS!
http://stockcharts.com/c-sc/sc?s=$ftse&p=d&yr=0&mn=4&dy=0&id=p67456868979&a=250212975
SPX Swing trade chart MACD/RSI -tks Footquarters!
http://investorshub.advfn.com/boards/board.aspx?board_id=21801
Larry Williams website - I Really Trade LW University
http://ireallytrade.com/freetradingtools.htm
Commitment of Traders Charts
http://www.cotpricecharts.com/commitmentscurrent/
Useful Futures Link
Options site for OEX, SPX, DIA, DJX, NDX
http://www.cboe.com
Seasonality Charts
http://www.seasonalcharts.com/
Seasonality Switching Rules #msg-1381329
Plan Philosophy #msg-471956 #msg-539934
Trade Strategies #msg-538376
Consolidation #msg-544157
Diary of a Loss #msg-545791
Need a Break? #board-30 #board-959
Meanwhile, please feel free to post what you think can be played with these intraday trading signals. This is vital to this thread, please contribute your thoughts. We are all here to learn. I use this thread to document my own observations, and try to draw conclusions from them. You can do the same thing too!
The DJX and NDX options are relatively cheap, and they can obtain nice percentage movement easily. While SPX options are relatively expensive, the volatility can lead to huge percentage movement, hence higher risk and reward. For simplicity, we also assume that you are not allowed to short options, though that will be changed when we gain more experience.
"The Markets offer support and resistance. This Board offers support and assistance"
"If you can Successfully Follow the Plan then Success will Follow You!"
|
Posts Today
|
0
|
|
Posts (Total)
|
18894
|
|
Posters
|
|
|
Moderator
|
|
|
Assistants
|
| Volume | |
| Day Range: | |
| Bid Price | |
| Ask Price | |
| Last Trade Time: |


