 News
News  Market Data
  Discover

Support: 888-992-3836
Copyright © 2023 InvestorsHub Inc.


Register for free to join our community of investors and share your ideas. You will also get access to streaming quotes, interactive charts, trades, portfolio, live options flow and more tools.
COT - Commitments of Traders in Metals Futures Market Reports
By: Software North | April 29, 2022
Gold

Silver

Read Full Story »»»
 DiscoverGold
Gold Forecast: Are Gold Miners In A Stalemate On The Market Chessboard?
By: P. Radomski | April 29, 2022
With the GDXJ ETF suffering a mild drawdown on Apr. 27, the recent rout has calmed for the time being. However, with the medium-term fundamental outlook remaining profoundly bearish, the junior miners and the S&P 500 are fighting a losing battle.
To explain, the Fed needs to lower asset prices to help calm inflation. Moreover, with the earnings season delivering some hit-and-miss results, market participants are dumping the losers and holding on to the winners for dear life. However, while investors rotate from one scarred corner of the stock market to another, the hiding places are shrinking. Therefore, when the walls close in, the only place left to go is down.
For example, Microsoft hit, Alphabet missed, and RBC Capital Markets analysts said that Microsoft’s “solid” fourth-quarter guidance “should allay investor fears of a macro slowdown.” As a result, the bull is alive and well.
Please see below:
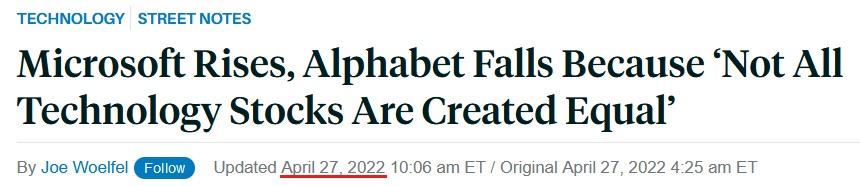
Source: Barrons
Missing the forest through the trees, investors fail to realize that some companies have succumbed to the medium-term realities sooner than others. For context, I’ve been bullish on the U.S. economy for some time, and I still am RIGHT NOW. However, with each Fed rate hike and each passing quarter, that will change materially, and so should investors’ optimism.
Please see below:

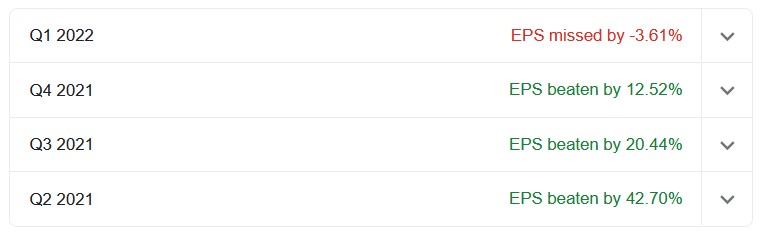
Source: Google Finance
1. You Gain, the Fed Inflicts Pain
To explain, the figures above represent Google Finance’s tally of how much Microsoft outperformed analysts’ earnings per share (EPS) estimates over the last four quarters. Notice the trend? After beating estimates by 12.71% in Q4 2021, Microsoft’s EPS outperformance declined sequentially to a slight 0.98% in Q3 2022. Moreover, its revenue outperformance showcased a similar pattern.
Furthermore, the decelerating trend is also present with Alphabet, only ahead of schedule. As a result, with the Fed poised to slow the U.S. economy to calm inflation, it’s only a matter of time before the stock market’s winners (Microsoft) turn into losers (Alphabet).
Source: Google Finance
Speaking of winners, Visa reported its second-quarter earnings on Apr. 26. CEO Al Kelly said during the Q2 earnings call:
“After the short four to five-week impact of Omicron in December and January in the United States and many other parts of the world, the recovery continues to be robust…. In the U.S., payments volume index to 2019 was 144 in the quarter. Volume growth relative to three years ago has been stable and strong now for four quarters in a row.”
“When looking at specific spend categories for credit cards, we saw greater than a 10-percentage point improvement in the three-year index from Q1 to Q2 in travel, retail goods, food and drug, restaurant, QSR and fuel.”
As a result, while investors hope that a slowing U.S. economy will allow a dovish 180 by the Fed, Visa hasn’t seen any demand description.
Please see below:
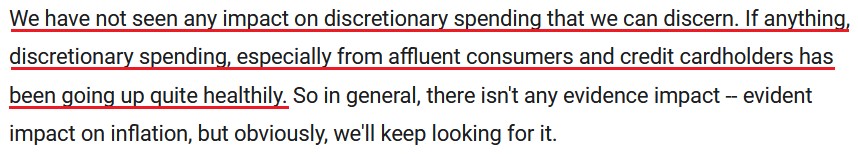
Source: Visa/The Motley Fool
Furthermore, with consumers eager to spend, companies are eager to raise prices. For example, Mondelez released its first-quarter earnings on Apr. 26. The company is home to confectionary brands like Oreo, Cadbury, Ritz and Toblerone. CFO Luca Zaramella said during the Q1 earnings call:
“We now expect input cost inflation in the low double-digit range for 2022 versus our prior view of approximately 8%, despite our coverage is approaching 90% for the year. The revise view of inflation reflects the war in the Ukraine and the related step-up in cost pressure to our commodity basket, including energy, wheat, oil and packaging.”
He added:
“We continue to expect pricing to be a larger driver of top line growth, given its impact in Q1 and we are also announcing price increases across a number of markets for the rest of the year tied to inflation.”
As a result, the Fed can’t wish its problems away, and these hawkish realities should spook investors over the next few months.
Please see below:
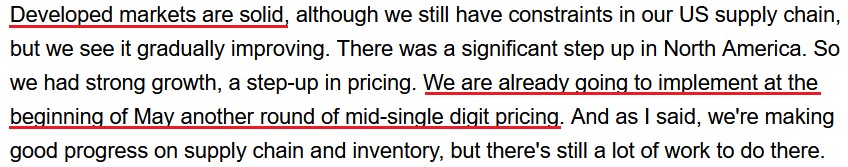
Source: Mondelez/Seeking Alpha
Singing a similar tune, PepsiCo released its first-quarter earnings on Apr. 26. CFO Hugh Johnston said during the Q1 earnings call:
“Inflation has clearly gotten a bit more challenging for the year. No question about that. We had previously indicated it was low teens. It’s several points higher than that now (…).”
“We think the consumer is very early in this process of adjusting to the new inflationary environment. I think there’s going to be new behaviors adapting to the new realities.”
As such, while Johnston didn’t mention any specifics on pricing, “new realities” are not what the Fed had in mind. Moreover, CEO Ramon Laguarta raised PepsiCo’s full-year guidance and added that elasticities are still outperforming. Therefore, with inflation “several points higher” than previously expected, would you bet that PepsiCo isn’t riding the inflationary merry-go-round?
For context, positive elasticities mean that when PepsiCo increases prices, it’s not seeing a drop-off in demand.
Please see below:
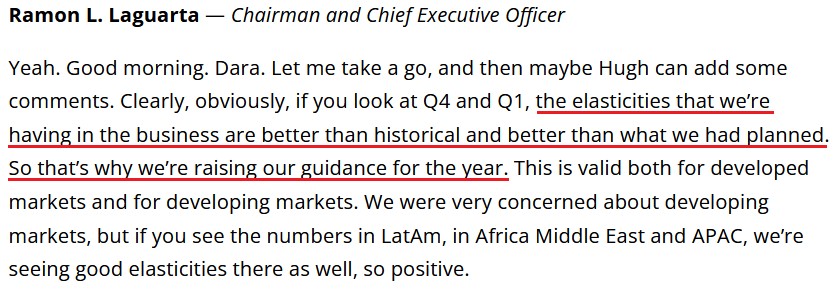
Source: PepsiCo/Alpha Street
Thus, while the U.S. economy remains on solid footing RIGHT NOW, the reality is that all of this data is bullish for Fed policy. With companies still raising prices and receiving little pushback from consumers, we're nowhere near the demand destruction needed to reduce annualized inflation from 8.6% to 2%. As such, the Fed will have to do the heavy lifting.
Moreover, while investors breathe a sigh of relief that corporate profits haven't collapsed, the optimism is short-sighted. Of course, a recession isn't upon us; the Fed has only hiked interest rates once. The damage occurs after the fourth, fifth, sixth, etc., rate hike, as higher interest rates eat away at consumers' disposable income and depress corporate profits. Therefore, the current environment is full of clear skies. However, if you want to get 8.6% annualized inflation down, everything else likely goes down with it.
Also noteworthy, the Richmond Fed released its Fifth District Survey of Manufacturing Activity on Apr. 26. The data was largely bullish for Fed policy. The report revealed:
“Our wage index increased to 41 in April from 37, and firms don’t expect the increase in wages to let up. The average growth rate of prices paid increased slightly in April while the growth rate of prices received from customers edged down slightly. Firms expect growth rates for both prices paid and prices received to decrease somewhat in the next 12 months.”
Please see below:
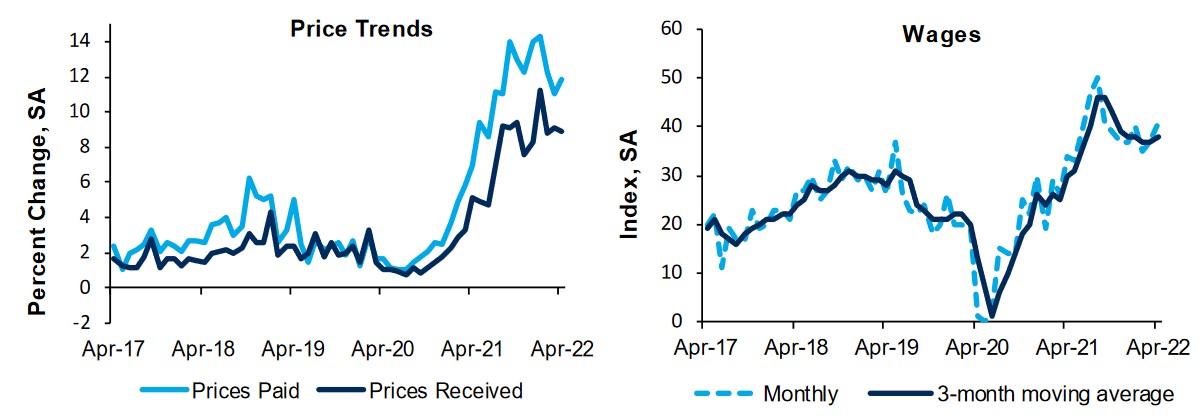
Source: Richmond Fed
Likewise, with employment also moving higher, continued strength in the U.S. labor market is also bullish for Fed policy.
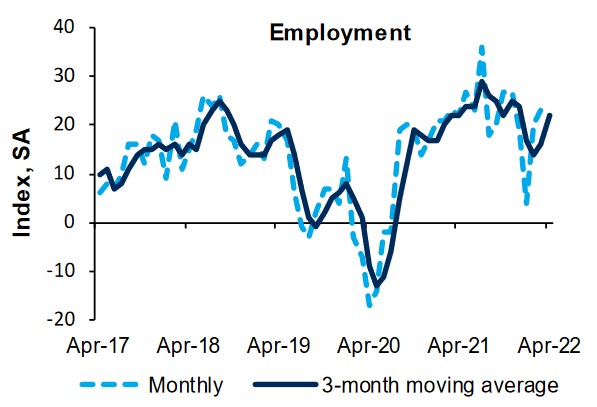
Source: Richmond Fed
In addition, the Dallas Fed released its Texas Manufacturing Outlook Survey on Apr. 25. Showcasing similar results, the data is also supportive of Fed policy. An excerpt from the report read:
“Prices and wages continued to increase strongly in April, though the indexes eased off their historical highs. The raw materials prices index fell 13 points to 61.5, its lowest reading in more than a year, though still well above its average of 27.7. The finished goods prices index moved down from 47.8 to 43.5. The wages and benefits index came in at 50.9, down slightly from its high last month of 55.2 but still markedly elevated from its average reading of 20.1.”
Finally, the Dallas Fed released its Texas Service Sector Outlook Survey on Apr. 26. Similar to the other reports above, inflation increased, though at a slower pace in April. The report stated:
“April saw continued upward pressure on wages and prices, though growth in wages and input prices eased slightly. The wages and benefits index fell from 36.5 to 33.0, still near a record high. The selling prices index was unchanged at 33.7, with 37 percent of respondents noting monthly price increases, while the input prices index declined five points to 54.2.”
The bottom line? While investors are supposed to be forward-looking, they fail to realize that current earnings and guidance don’t reflect the impact of future rate hikes. Moreover, with the Fed on a mission to curb inflation, quarterly price increases and robust elasticities are not helping the situation. As a result, once this reality hits home, the PMs will suffer mightily as the negativity cascades across Wall Street.
In conclusion, the PMs declined on Apr. 27, as commodities have lost some of their mojo. Moreover, while technical conditions may present an opportunity for a short-term rally, both technicals and fundamentals signal lower lows over a medium-term time horizon. As such, long-term buying opportunities will likely present themselves later in 2022.
Summary
Despite the ongoing Russian invasion of Ukraine, and despite gold being the traditional safe haven in times of turmoil, the overall outlook for the precious metals sector remains bearish for the next few months, and the medium-term outlook for the yellow metal remains pessimistic.
Since neither the USD Index nor real interest rates are likely to stop rising anytime soon, the gold price is likely to fall sooner or later. Given the analogy to 2012 in gold, silver, and mining stocks, “sooner” is the more likely outcome.
As silver often moves in close relation to the yellow metal, when gold falls, silver is likely to decline as well – it has probably already started its slide. The times when gold is continuously trading well above the 2011 highs will come, but they are unlikely to be seen without being preceded by a sharp drop first.
Read Full Story »»»
DiscoverGold
The Ord Oracle: GDX Update
By: Tim Ord | April 27, 2022
SPX Monitoring Purposes: Long SPX on 3/25/22 at 4543.06.
Monitoring Purposes GOLD: Long GDX on 10/9/20 at 40.78.
Long Term SPX Monitor Purposes: Neutral.

The top window is the Inflation/Deflation ratio. Last week, it closed above its previous 2020 high, suggesting a breakout. Right after that high, it tumbled the next four days, creating an "upthrust" and suggesting a consolidation is starting. If the Inflation/Deflation ratio starts a consolidation, so will the XAU (GDX). As pointed out in yesterday's report, the pattern that may be forming on XAU is a head-and-shoulders bottom where the head is the October low. Head-and-shoulders patterns have symmetry both in time and price. The Left Shoulder formed over 5 months and suggests the Right Shoulder may take as long; it could complete in the October or November timeframe. Still a bull market, but sideways action over the next 5 or 6 months is possible.
Tim Ord,
Editor
Read Full Story »»»
DiscoverGold
Could the Freeport-McMoRan (FCX) Stock Selloff Be Short-Lived?
By: Schaeffer's Investment Research | April 26, 2022
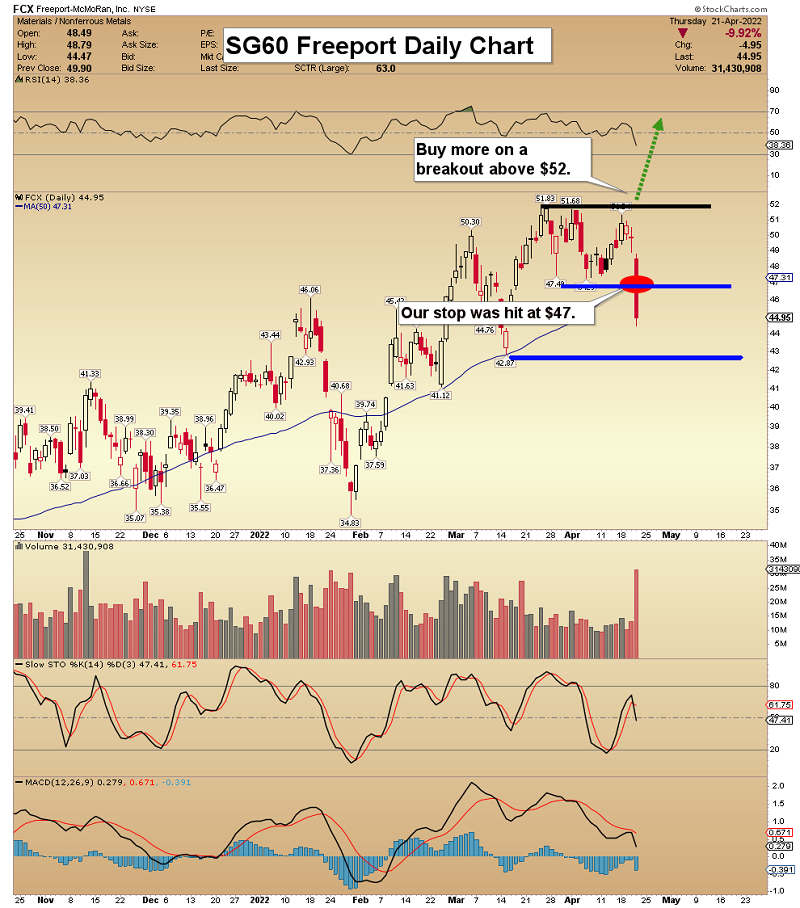
• Demand concerns amid Covid-related lockdowns in China are weighing on the mining sector
• An unwinding of pessimism surrounding FCX could provide tailwinds
Freeport-McMoRan Inc (NYSE:FCX) is one of the casualties of the selloff the mining sector has been suffering from, as lockdowns in China spark demand fears. The security was last seen down 3% to trade at $40.38, after shedding 20% in the last week. Compared to some of the other equities we've covered recently, however, this pullback is relatively tame, with FCX sporting a muted 3% year-to-date deficit and still clinging to a 3.6% year-over-year lead. What's more, the stock's pullback has put it back within striking distance of a trendline that's had bullish implications in the past.
According to data put out by Schaeffer's Senior Quantitative Analyst Rocky White, FreePort-McMoRan stock just came within one standard deviation of its 260-day moving average. Per White's data, there have been four other instances in the past three years where a similar pullback occurred. One month after three of these signals, FCX notched positive returns, averaging a 15.9% pop during this time period. A similar move would put the security just below the $47 level.

An unwinding of pessimism in the options pits could put additional wind at the equity's back. The stock's Schaeffer's put/call open interest ratio (SOIR) of 1.35 sits higher than all other readings from the past year. In other words, short-term options traders haven't been more put biased during this time period.
And while long calls are still outnumbering puts at the International Securities Exchange (ISE), Cboe Options Exchange (CBOE), and NASDAQ OMX PHLX (PHLX), the stock sports a 50-day put/call volume ratio that sits in the 89th percentile of its 12-month range, suggesting a much healthier-than-usual appetite for bearish bets of late.
A shift in analyst sentiment could also be beneficial. Of the 11 in coverage, seven covering brokerage firms call the mining stock a "hold" or worse.
Read Full Story »»»
DiscoverGold
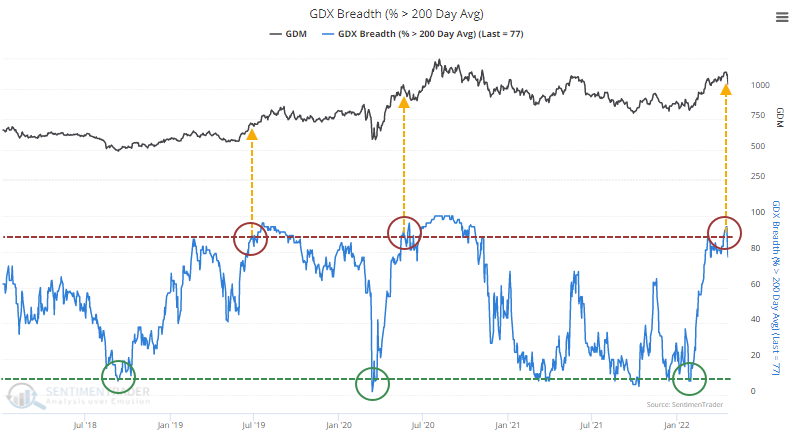
Gold miners have corrected from a major surge
By: Jason Goepfert | April 26, 2022
• Gold mining stocks have cycled from extreme oversold to extreme overbought, with fewer than 10% of members trading above their 200-day averages to more than 90% doing so. Similar cycles over the past 40 years had a strong tendency to lead to medium- to long-term gains in gold and mining stocks.
Read Full Story »»»
DiscoverGold
As soon as they lifted the thumb at 4pm, boing for a minute. Still has to settle trades around 1895 to 7
Gold absolutely getting manipulated. It’s trending down below 1900 at end of day, after getting hammered below there in the morning, and should have not gone above 1900 until it finished trades just below.
Magic, 4pm and it somehow hits 1897 again with a boatload of buying above 1900 all afternoon.
All about propping up the garbage dollar.
Gold Stock's Bull Signal Has Rarely Been Wrong
By: Schaeffer's Investment Research | April 25, 2022
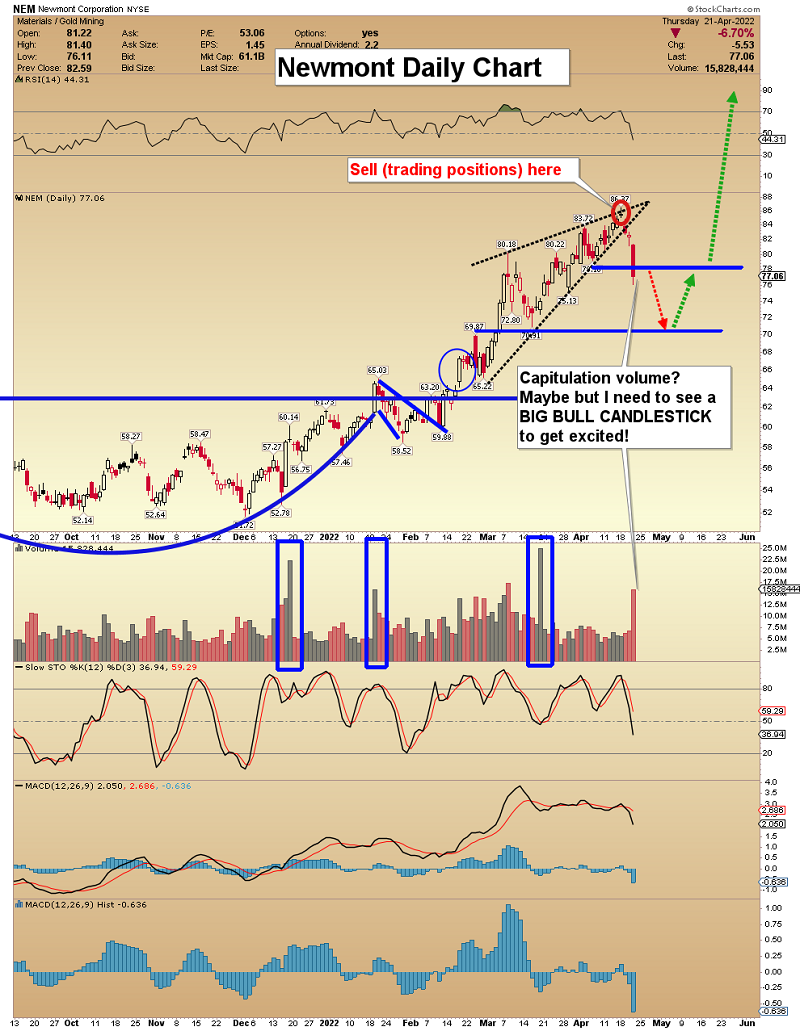
• Newmont stock has lost 15% in the last week
• Several layers of support have helped contain the stock's pullback
Gold producer Newmont Corporation (NYSE:NEM) hasn't been immune to the pullback both stocks and commodities are facing today. Last seen down 3.5% at $71.89 and now just a week removed from its April 18 record high of $86.37, NEM is set to close at its lowest level since early March, shedding over 15% in that timeframe. Investors shouldn't make any rash selling decisions, though, since based on its technical setup, the gold stock's pullback appears to have found its floor.
It looks like the stock has found dual pronged support at the $71 level, as well as its 70-day moving average, which has signaled rebounds for NEM in the past. According to a study from Schaeffer's Senior Quantitative Analyst Rocky White, Newmont stock has come within one standard deviation of this trendline five other times in the past three years. After 80% of these pullbacks, the equity saw a positive one-month return, averaging a 6.9% pop during this time period. A similar move from its current perch could help NEM gain some traction, putting back near the $76 mark. Another indicator that NEM could see a bounce soon is it's 14-day Relative Strength Index (RSI) of 27, which sits firmly in "oversold" territory.

Despite its recent highs, analysts still aren't convinced, and a round of bull notes could provide additional support. Of the 10 in coverage, just three say "buy" or better, while seven say "hold."
There's been a shift towards puts in the options pits, and an unwinding here might create tailwinds. While calls are still outnumbering puts on an overall basis at the International Securities Exchange (ISE), Cboe Options Exchange (CBOE), and NASDAQ OMX PHLX (PHLX), the stock sports a 10-day put/call volume ratio that stands higher than 94% of readings from the past year. In other words, these traders have had an unusually healthy appetite for long puts of late.
Read Full Story »»»
DiscoverGold
Gold Stocks: Are We Witnessing the Onset of a Major Collapse?
By: Przemyslaw Radomski | April 25, 2022
• After gold ran out of steam, the market was flooded by a wave of invalidated breakouts. Can anything keep the precious metals from nosediving?
Remember when gold tried to rally above $2,000? It was just a week ago. Now, it’s likely about to drop below $1,900, silver and mining stocks are sliding too. While the white metal has been weak for a while now, mining stocks finally woke up to the reality and appear to be catching up with gold’s and stocks’ declines.
Boy, they sure have some catching up to do! Even though last week’s ~10% decline might appear terrific, let’s keep in mind that this is most likely just the beginning of a huge slide, probably quite similar to what we saw in 2012, 2013, and in 2008.
Gold Stocks Technical Analysis
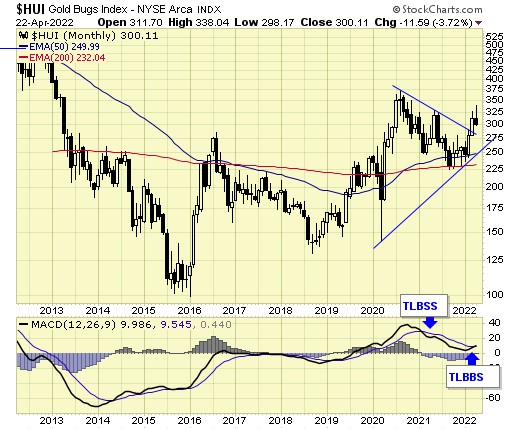
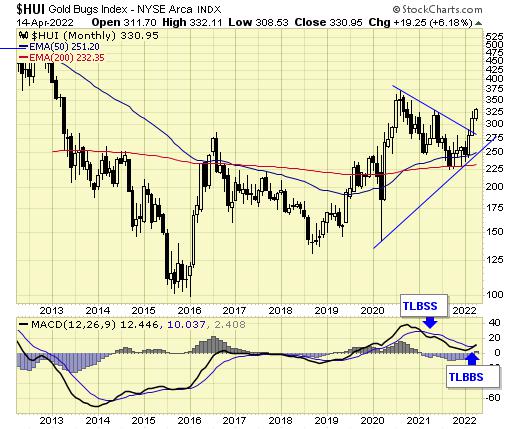
Let’s start today’s analysis with a quick look at changes in the long-term HUI Index chart – the flagship proxy for gold stocks.

We saw a powerful weekly reversal, a decline in the RSI indicator from about 70, which confirmed the previous sell signal, and a fresh medium-term sell signal from the stochastic indicator.
In particular, the weekly reversal and the sell signal from stochastic are important, as they closely link last week with what we saw right after the final top in 2008 and 2012.
History is likely about to rhyme, and the implications are extremely bearish for mining stocks for the next few months.
Let’s zoom in.
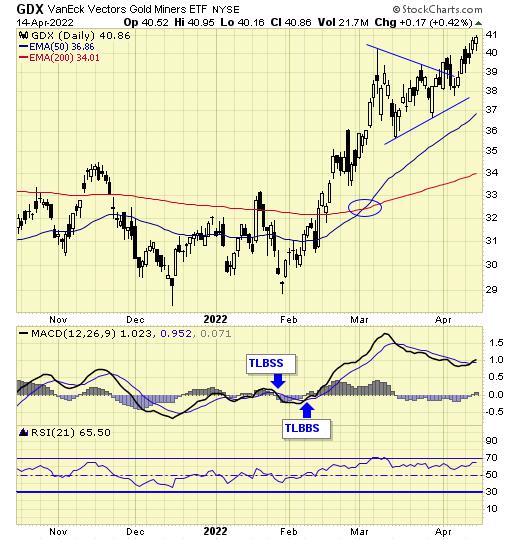
While senior gold stocks declined by a bit less than 10%, junior miners fell by a bit more than 10% last week.
However, that’s the least important fact about this sector.

The key thing is that practically all the seemingly bullish breakouts that we saw recently were just invalidated.
The breakout above the declining red resistance line was invalidated.
The breakout above the late-2021 high was invalidated.
The breakout above the 50% Fibonacci retracement level based on the 2020-2022 decline had been (earlier) invalidated.

The breakout above the upper border of the previous triangle pattern was invalidated.
The breakout above the lower border of the previous triangle pattern was invalidated.
That’s a sell signal on top of a sell signal, on top of a sell signal, on top of a sell signal, on top of a sell signal.
We saw sell signals from the GDXJ-based MACD indicator too.
Speaking of the triangle on the above chart, its vertex is at the end of April, so we might see some kind of turnaround then – perhaps a volatile comeback, which is then followed by another – even bigger – slide.
Gold and Silver Technical Analysis
This would fit the gold chart too.

Gold has a triangle-vertex-based reversal point nearby, so they both confirm each other.
In the case of gold, please note how it followed its self-similarity to the post-2020 top trading patterns. The yellow metal moved slightly above its initial post-top bottom, and then it immediately turned south.
The support lines cross at about $1,845, so that’s where we might see the next short-term rebound, but let’s keep in mind that it’s not likely to be anything more than that – a corrective rebound that is then followed by another move lower.

Silver declined profoundly recently, and just like miners, it invalidated multiple previous breakouts. Most interestingly, though, it now clearly invalidates the breakout above its January 2022 high.
The next strong support is based on the previous lows, close to the $22 level. That’s where silver might correct before moving much lower.
Why Are Mining Stocks and Silver Declining So Much Nowadays?
It is quite likely due to their connection with the general stock market.

I’ve been writing about the stock market’s incoming demise for quite some time, and that’s what we’re finally seeing. Both silver and miners (especially junior miners) are responding accordingly.
Provided that stocks continue to decline, silver and miners are likely to fall even more than gold.
Let’s keep in mind what happened in the previous cases when stocks declined profoundly – in early 2020 and in 2008. Miners and silver declined in a truly epic manner, and yes, the same is likely to take place in the following months, as markets wake up to the reality, which is that the USD Index and real interest rates are going up.

USD Index Correlation
Speaking of the USD Index, after invalidating the breakout below the multi-year head-and-shoulders pattern, the USDX is poised to soar, just like I’ve been expecting it to do for more than a year ago.
The RSI is above 70, but since the USDX is in a medium-term rally and is already after a visible correction, it can rally further. Please note that we saw the same thing in 2008 and in 2014. I marked the corrections with blue rectangles.
The next strong resistance is at the previous highs – close to the 104 level.
It doesn’t mean that the USD Index’s rally is likely to end there. It’s not – but the USDX could take a breather when it reaches 104. Then, after many investors think that the top has been reached as the USDX corrects, the big rally is likely to continue.
Forecast
All in all, the technical picture for mining stocks is extremely bearish for the following months, even though we might see a short-term correction close to the end of April.
Read Full Story »»»
DiscoverGold
Spot needs to clean up its mess below 1900 from last time, didn’t think it cared on its way to 2000 but here we are.
COT - Commitments of Traders in Metals Futures Market Reports
By: Software North | April 22, 2022
Gold
Silver
Read Full Story »»»
DiscoverGold
Gold Cycles Moving Into Bottoming Territory
By: Jim Curry | April 24, 2022
Recapping Last week
Last week's trading saw Gold forming its high in Monday's session, here doing so with the spike up to the 2003.00 figure. From there, a sharp decline was seen into later in the week, with the metal dropping all the way down to a Friday low of 1928.00 - before bouncing slightly into the daily/weekly close.
Gold Cycles, Short-Term
For the near-term picture, the downward phase of the 10 and 20-day cycles was confirmed to be in force early last week, which favored additional short-term weakness for the metal. With that, the next smaller-degree low is expected to come from these two waves, with the same moving into their early-end bottoming window.
Here is the smaller cycle, the 10-day component:
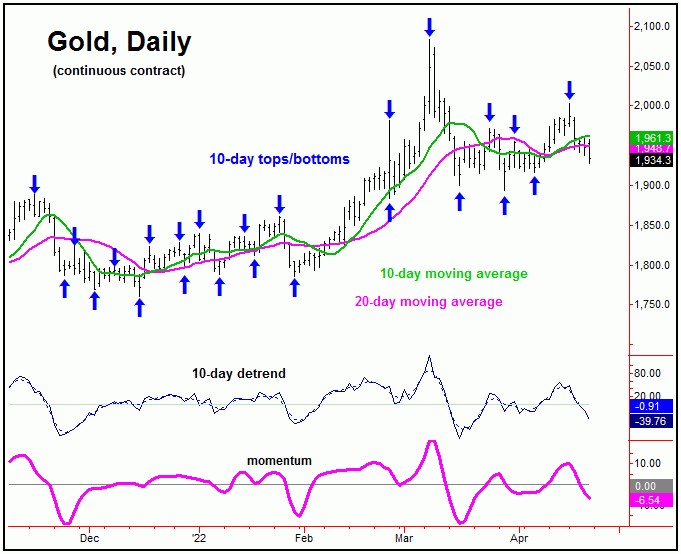
From my 3/27/22 article: "In terms of price, there is key resistance to the short-term upward phase at or into the 1986-2008 region for Gold, which is the 50-61% retracement zone of the move down from the 2078 swing top to the 1895 swing low. This same range is also near our upper 20-day cycle band (i.e., 1996 and declining), and - if tested in the days ahead - would be an ideal area to watch for the next countertrend peak to form."
As mentioned above, Gold had key resistance at the 50-61% retracement zone of the first swing down. This range did stop the move higher into early last week with the tag of the 2003.00 figure, a move which was anticipated to end up as countertrend - due to the position of the larger 72-day component (more on this in a bit).
In terms of time, the 10-day wave is now 11 trading days along, with the larger 20-day cycle being some 17 days along - thus putting each of these waves into bottoming area. Having said that, it is too early to confirm a trough with these cycles, though the next short-term upward phase - when back in force - would be favored to take Gold back up to the 10-day moving average or better, a normal minimum expectation.
Gold's Stepped-Back View
From the comments made in past articles, the last peak of significance came from the 72-day cycle for Gold, which is shown again on the chart below:
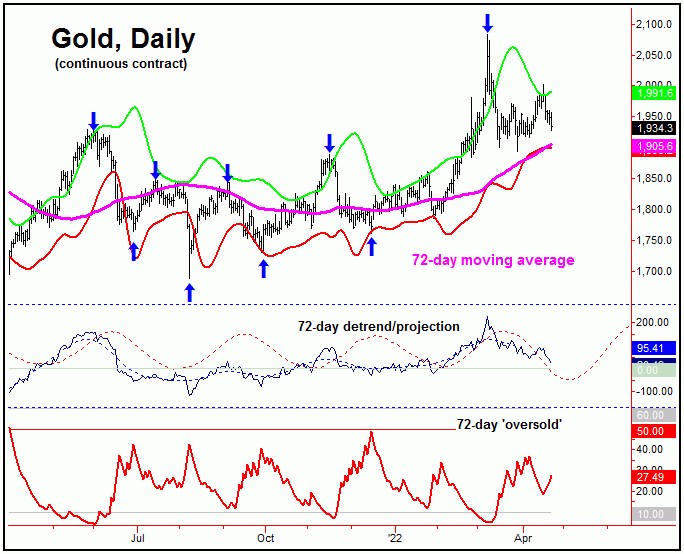
In terms of time, this 72-day cycle has been seen as pushing down into the mid-April region, but with a decent plus or minus variance in either direction. In terms of price, our favored path has been calling for a drop back to the 72-day moving average and/or the lower 72-day cycle band - something which has yet to materialize, though we are certainly inching closer to the same with the recent action.
With that, the best 'look' would be for additional weakness to be seen in the coming days, with the aforementioned price zone (i.e., low-1900's) acting as the magnet. In-between, there may - or may not - be a bounce with the smaller 10 and 20-day cycles. In fact, the best 'look' would be for the metal to go ahead and drop on down to the 72-day moving average or lower.
As mentioned in prior articles, in order to set up the next good buy signal for Gold, I would like to see our 72-day 'oversold' indicator spiking above its upper reference line, in addition to a daily close below our lower 72-day cycle band. Ideally, I would like to see both of these occurring on the same trading day.
Going further, I would also like to see Gold sentiment becoming more bearish in the days/weeks ahead. With that, the chart below shows our sentiment index for Gold:
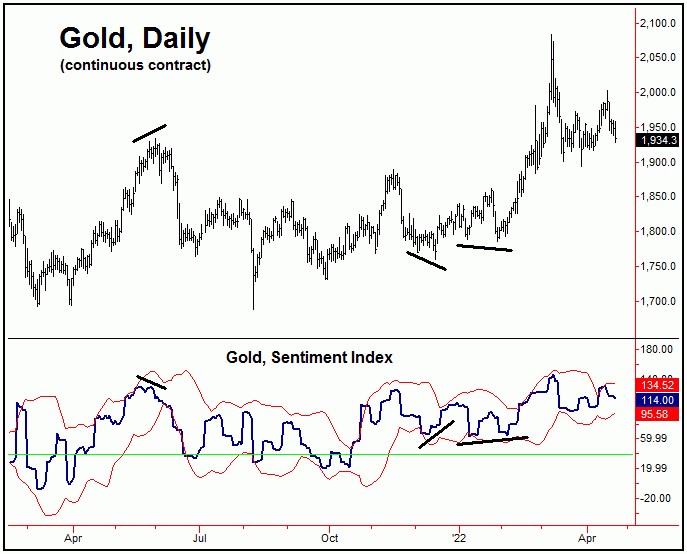
The action of Gold sentiment has been bothersome in recent weeks, with this indicator remaining high - in spite of the overall price decline. With that, though I will still be looking for indications to buy the next 72-day trough, I would certainly want to keep any bets fairly small - at least until some change in sentiment is seen.
Stepping back, until proven otherwise, the favored path is for the current downward phase of the 72-day cycle to end up as a countertrend affair, holding above the mid-December, 2021 and January, 2022 price bottoms. If correct, the probabilities will favor a sharp rally playing out mid-to-late Summer, before topping our larger 310-day component, for the next mid-term correction phase in Gold. Stay tuned.
Read Full Story »»»
DiscoverGold
$GDX closed the week with a big reversal candle and closed below its 10 week MA
By: CyclesFan | April 24, 2022
• $GDX closed the week with a big reversal candle and closed below its 10 week MA, confirming that it made an intermediate term high and potentially the high of the year. The reversal happened 48 weeks from the 2021 high which is the same time span of the 2019 high to the 2020 high.

Read Full Story »»»
DiscoverGold
GDX: We MAY See A Deeper Drop
By: Avi Gilburt | April 22, 2022
While we appropriately called for the pullback we saw this week, the pullback has taken shape with a potential 5-wave decline. To be honest, it is not the most ideal of 5-wave declines. Moreover, the last time we saw a deeper drop, it also looked like 5-waves down, but then invalidated when we again broke out over the prior highs. Will that happen again? I cannot say for sure.
What I can say is that there is definitely risk of a deeper drop in the metals until we are again able to break back over the highs struck this week.
Now, if you are asking that if we see a 5-wave rally off a low, would that invalidate the downside potential? The answer is "no" because the upside structure has been overlapping and most likely a diagonal structure. This means that the next rally may be an a-wave of another a-b-c move higher, or it may be an a-b-c structure to set up another deeper drop.
What does all this mean? Well, that is going to be based upon how you are currently positioned. Anyone that does not want to hold for a bigger drop in the complex may want to lighten up their positions until we are able to break back over the high struck this past week, or maybe even hedge their holdings. And, consider that even if we do get a higher high, it may only complete a bigger diagonal, which means we likely see another decline again before the next major rally takes hold - such as is shown in silver, which would complete wave 5 of i in a leading diagonal, and then likely usher in wave ii pullback.
My point is that now is a good time to consider how much risk you would like to take based upon the current structures we are seeing in the complex. You "should" see an opportunity to lighten up if you choose to do so on a bounce into next week..
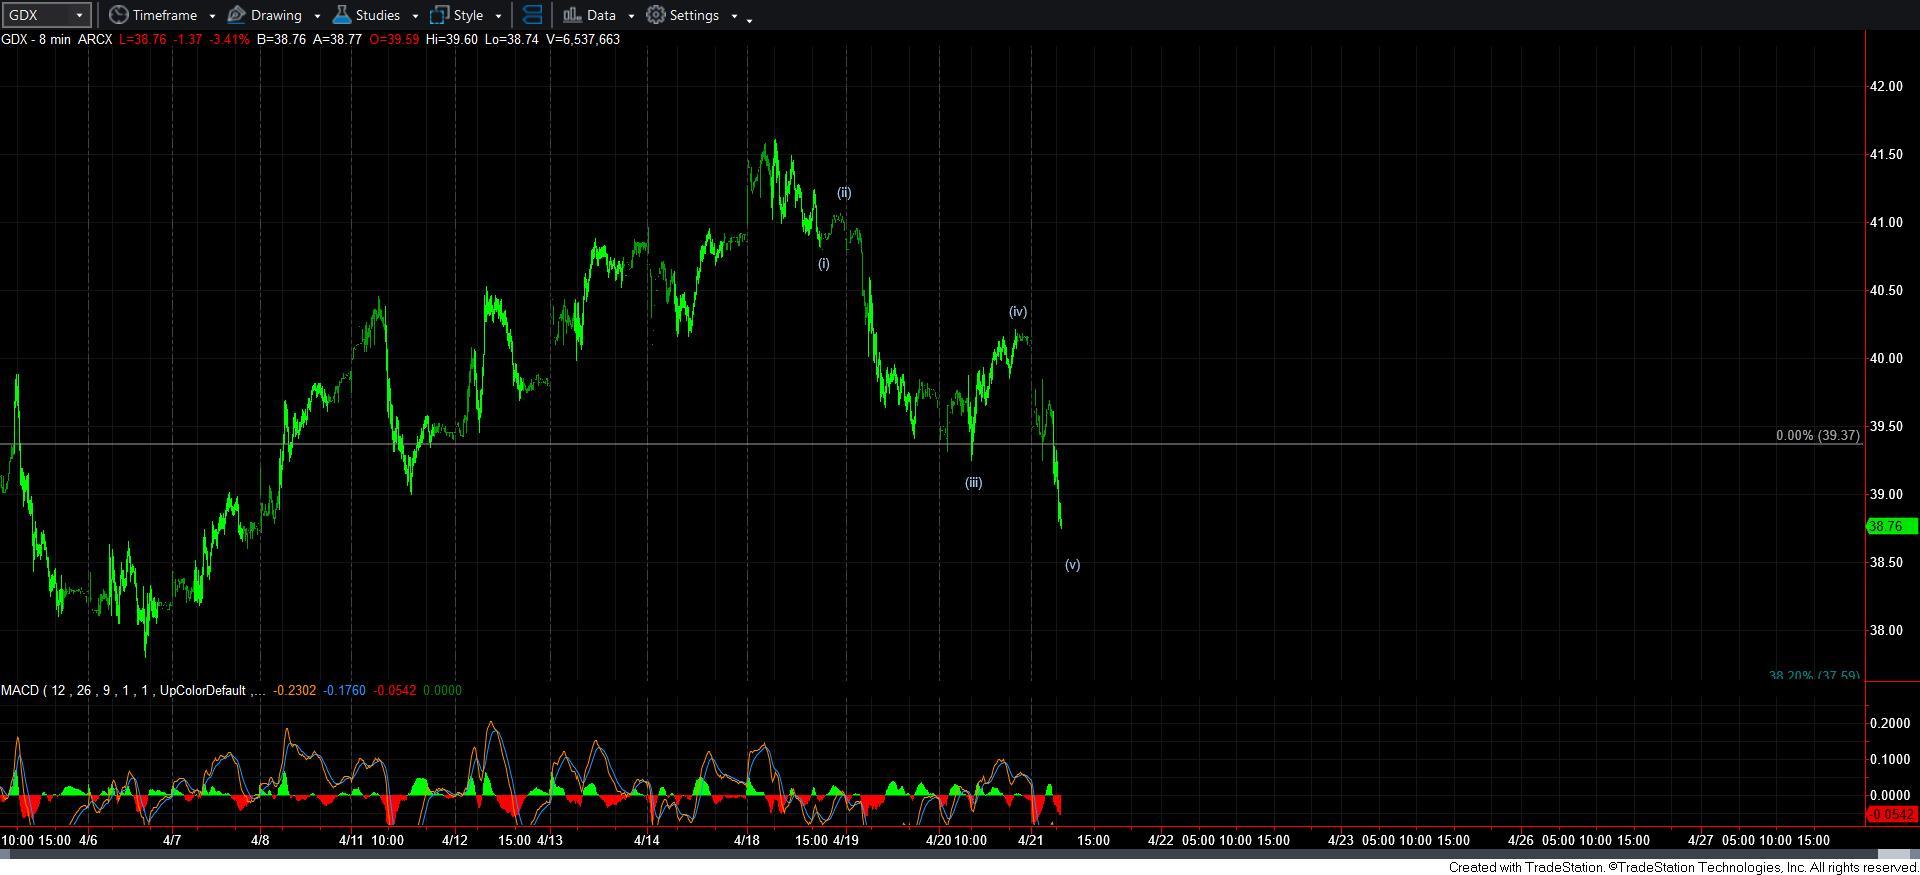
GDX8min
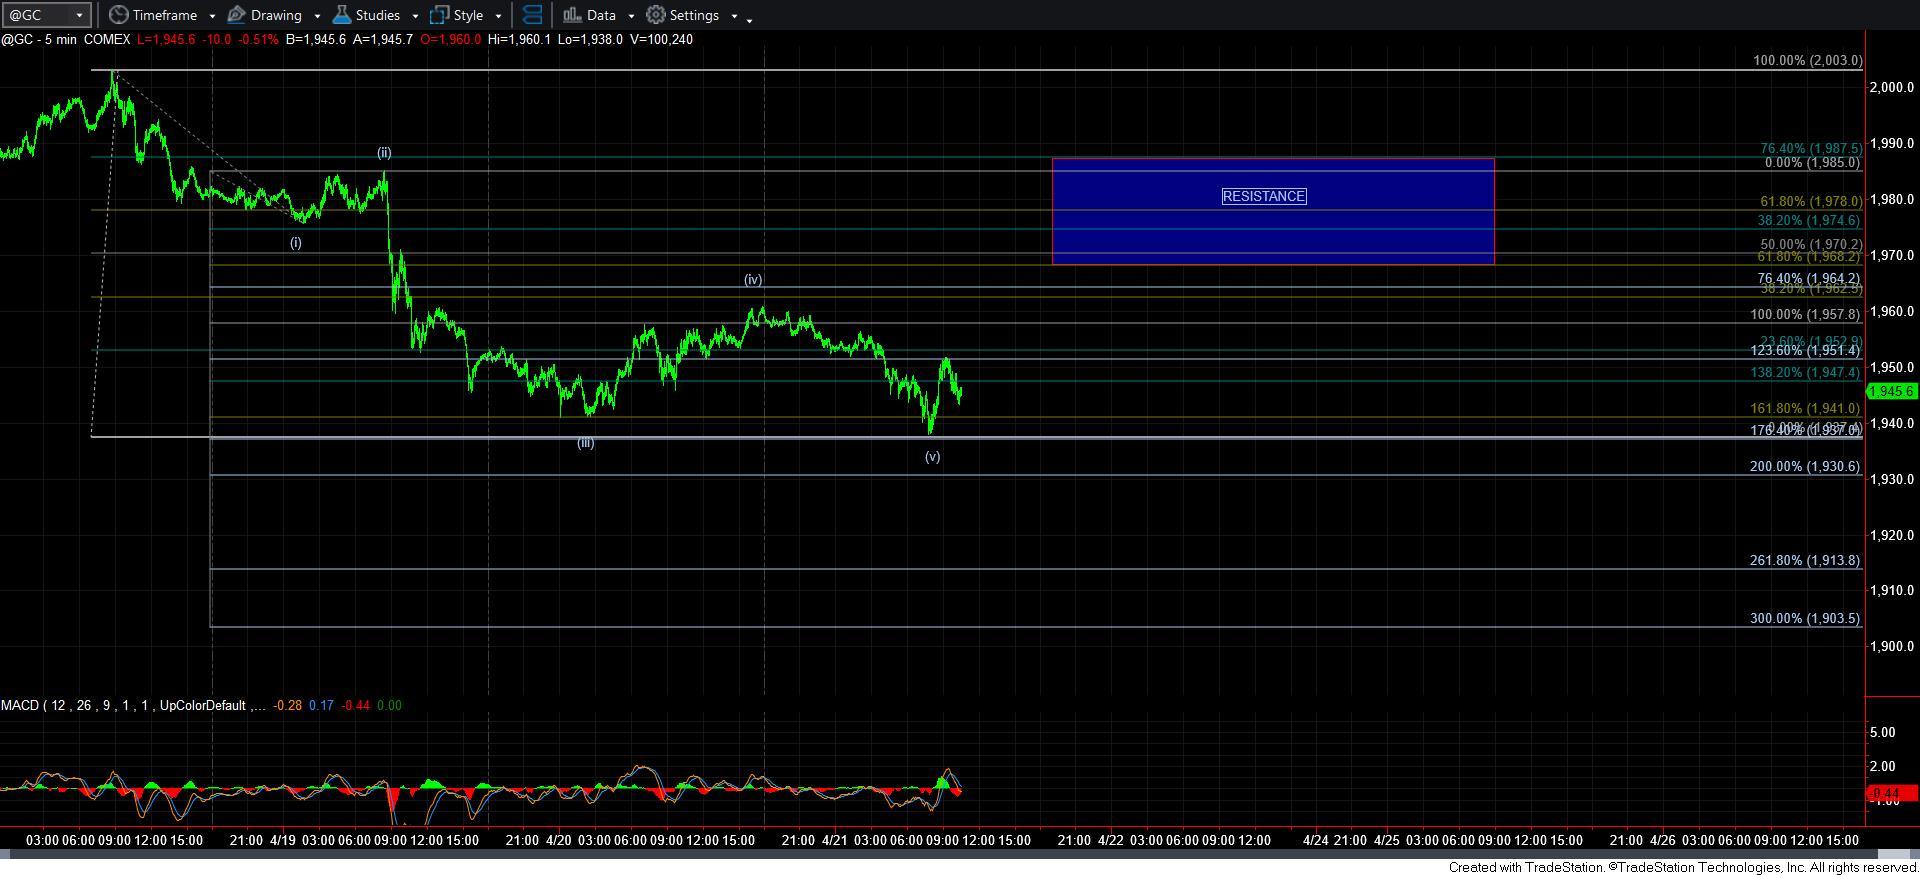
GC5min
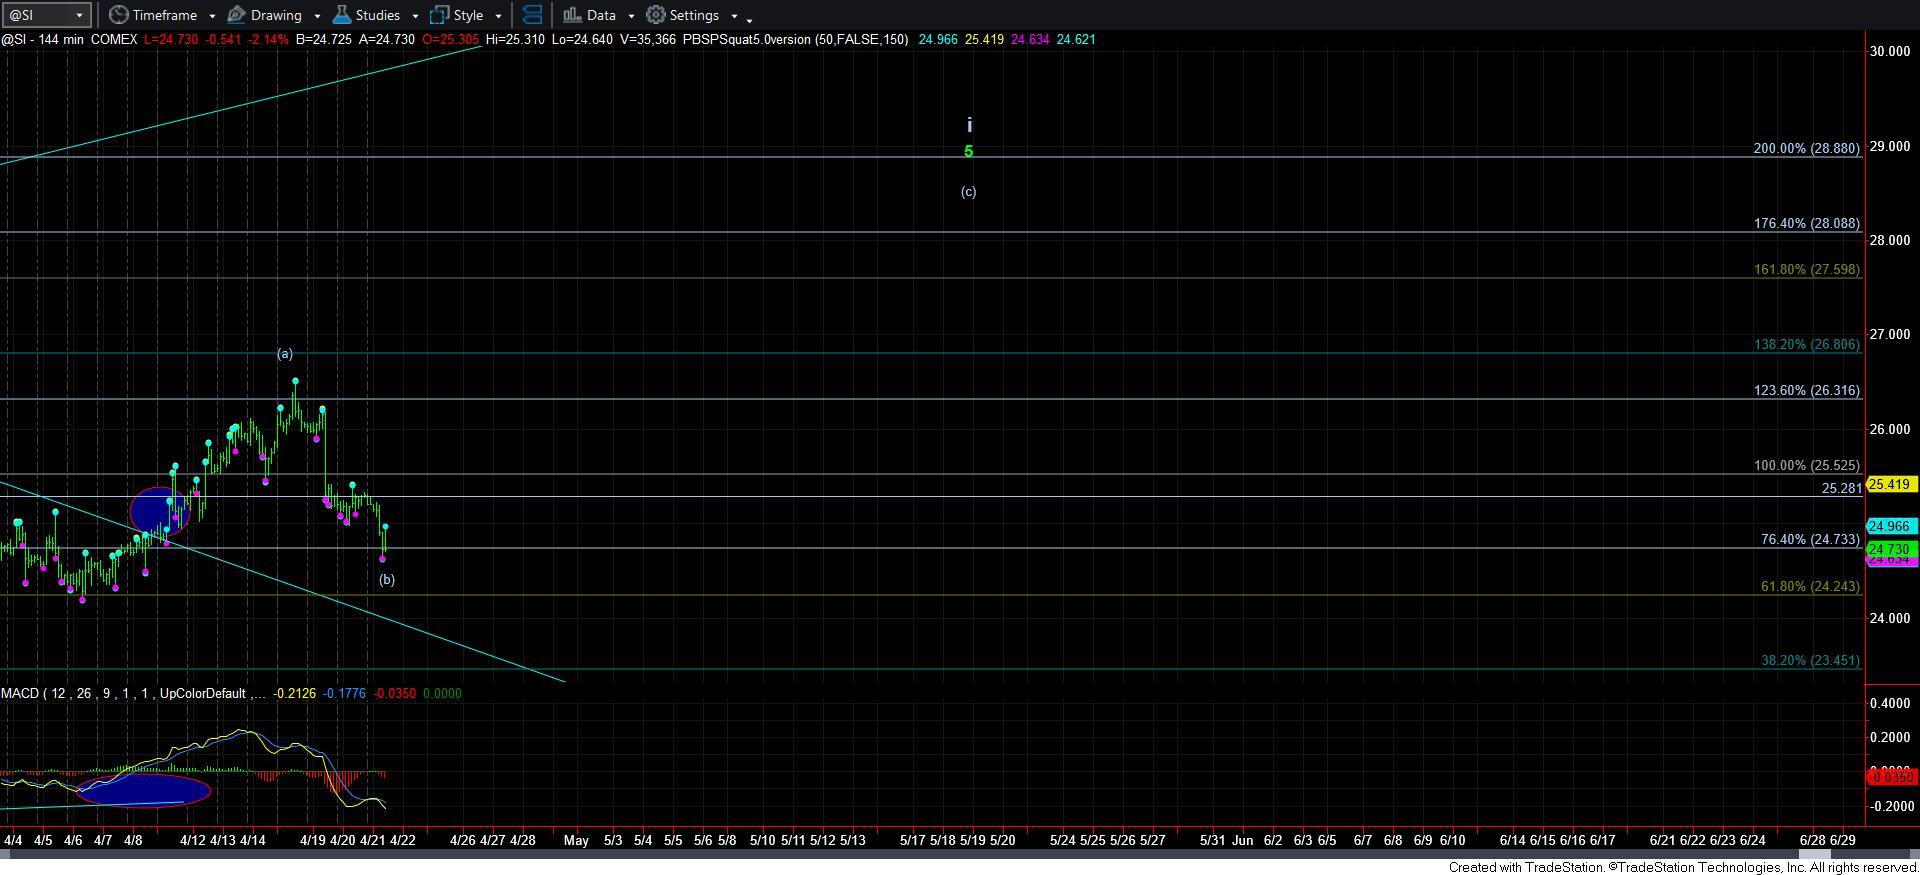
Silver-144min
Read Full Story »»»
DiscoverGold
Gold Still Can’t See Its Way Clear, but the S&P High Looks in Place for the Year
By: Mark Mead Baillie | April 24, 2022
• First Gold: A mere seven days ago we were singing Gold’s praises as its price for two consecutive weeks moved higher in bold defiance of the otherwise Short weekly parabolic trend. “Like salmon spawning upstream” we wrote; that was Gold’s gleam.

But now a week hence, Gold has been reamed, recording its third-worst weekly change year-to-date in settling yesterday (Friday) at 1933. To be sure, we’re maintaining our forecast high for this year of 2254; but for the present — in spite of all things as Gold-positive as for which one could ever wish — the evil, nasty, belligerent Short trend (as is its wont) seems pressing on price. Here are the weekly bars, the parabolic Short trend depicted by the four rightmost declining red dots:

The bad news is RUS state television’s promoting this past Thursday that the RS-28 Sarmat missile can level New York City; but the price of Gold, struggling to see its way clear, dropped anyway. The good news by the above graphic is that such Short trend really looks short-lived, for Gold’s broader bent across the chart clearly is to the upside.
Moreover, with the StateSide Money Supply (“M2”) having just now topped the $22 trillion level, our forecast for Gold 2254 seems modest given the yellow metal’s value of 4088 as shown in the opening Scoreboard. But one year at a time. Further, we deem Gold’s gleam as the buy of a lifetime. To reprise the late, great Richard Russell: “There’s never a bad time to buy Gold” … especially with present price at but 47% of present value. Now as to the overvalued end of the spectrum…
Second the S&P 500: The mighty Index’s high for this year (4819 on 04 January) is it from our perspective. Just as everything possible is positive for Gold, we find absolutely everything as negative for the stock market:
• The recession-indicative yield curve is as flat as a pancake, be it 5-, 10-, or 30-year dough all yielding 2.9%, essentially double the S&P’s yield (per Friday’s 4272 settle) of 1.433%;
• The Economic Barometer is a gyrating, recessive mess as we’ll later show;
• Q1 Earnings Season is very poor on the notion reports were supposed to be better post-COVID but clearly are not: only 54% of S&P constituents’ earnings (thus far reported) bettered Q1 of 2021; post-COVID, shouldn’t that be 100%? Oops;
• The “live” price/earnings ratio of the S&P is at present 35.7x whereas its lifetime mean (to which the p/e historically always reverts) is 38% lower at 22.3x;
• And then technically there’s this daunting negative MACD (moving average convergence divergence) crossover on the S&P monthly chart for the past five years… Ouch! And sayonara 2022. Get ready to get ugly:

“But, you can’t will people out of the stock market…”
Oh that is one of your most salient comments there, Squire. This past week’s last two trading days netted the S&P 500 a combined loss of -4.2%. But the S&P’s MoneyFlow regressed into S&P points recorded a comparable loss of just half that at -2.1%. The interpretation? The “We won’t sell because it always comes back!” crowd is alive and well, until they, too, begin to sell. So much for conventional wisdom, unless one has significant patience —> Per the “Friendly Reminder Dept.”, from October 2007 to April 2013 the S&P 500 did not make a new high, (just in case yer scorin’ at home).
“So how low is low.”
Rather than assign a subjective percentage drop, whether measured from here (S&P 4272) or from the high (S&P 4819), ’tis our preference to assess price structure. And as we shared via text this past week: “Broadly we can see S&P 3587-3198”. In turn, that’s in perfectly reasonable — indeed long overdue — order for an overall correction from 26% to 34%. ‘Course, regardless of our pose, nobody knows.
Still, in recent years we’ve mentioned the notion of the “Look Ma! No Earnings!” crash. So in that vein we today give a tip of the cap to Bloomy reportage in actually acknowledging this poor Earnings Season. And yet, Dow Jones Newswires continues to make reference to an (albeit all inflationary) StateSide “Hot Economy”. Does this look “hot” to you?
The only “hot” metrics of this past week were marginal improvements in March’s Housing Starts and Building Permits. The balance was a “cold” wind that blew for the month’s Leading Indicators and Existing Home Sales, along with April’s lower Index readings from the National Association of Home Builders and the Philly Fed. As for the broader graphic, ’tis a “gyrating, recessive mess” indeed. Cue Jerry Reed from ’71: “When you’re hot, you’re hot. When you’re not, you’re not.”
As for the FinMedia folks at large, our commendation to them for discovering the FedFundsFutures having already priced in a 50-basis-points rise per the Federal Open Market Committee come 04 May. We noted same three weeks ago in the 02 April missive, but ’tis better the news at least play ketchup than remain pickled, (sorry).
As to “The Now” for Gold, here next is the two-panel graphic of price’s daily bars from three months ago-to-date on the left and 10-day Market Profile on the right. Therein you can see the near-term negativity as Gold’s “Baby Blues” of regression trend consistency turn downward whilst price is pinned down near the bottom of the Profile:

And ’tis the same for Sister Silver, say no more:

Ahead of a critical week for incoming economic metrics, we’ll wrap it here with these three notes:
• “Researchers” report that millions of ably-eligible folks are choosing “indefinitely” to remain out of the workforce. We find it curiously coincident with such choice that — going by S&P/Experian’s data on consumer credit defaults — they’ve just increased for the fourth consecutive month. Live by the credit card; die by the credit card.
• One Tobias Adrian — The International Monetary Fund’s Director for Monetary and Capital Markets — expressed concern this past week over the risk for further selling in the markets such that we may “…see a certain amount of readjustment of asset valuations going forward…” That’s a quaint way of putting it, one has to say.
• Ready for the Mother of all Metrics? Again with reference to it being a critical upcoming week for data from the “hot” economy, therein we’ll get the first StateSide reading of Q1 Gross Domestic Product. The consensus is for a vastly reduced annualized pace of only +1.1%. But here’s the killer: the consensus for the associated Chain Deflator is +7.3%. That is stagflation in spades, right there!
And Gold toward seeing its way clear remains so cheap through here!
Read Full Story »»»
DiscoverGold
Jack Chan: Gold Price Exclusive Update
By: Jack Chan | April 23, 2022

Our proprietary cycle indicator is now DOWN.
To public readers of our updates, our cycle indicator is one of the most effective timing tool for traders and investors. It is not perfect, because periodically the market can be more volatile and can result in short term whipsaws. But overall, the cycle indicator provides us with a clear direction how we should be speculating.
Investors
During a major buy signal, investors can accumulate positions by cost averaging at cycle bottoms, ideally when prices are at or near the daily 200ema.
During a major sell signal, investors should be hedged or in cash.
Traders
Simply cost average in at cycle bottoms when prices are at or near the daily 200ema; and cost average out at cycle tops when prices are above the daily 50ema.
Gold sector is on a new long term BUY signal, suggesting that the correction since 2020 has been completed.
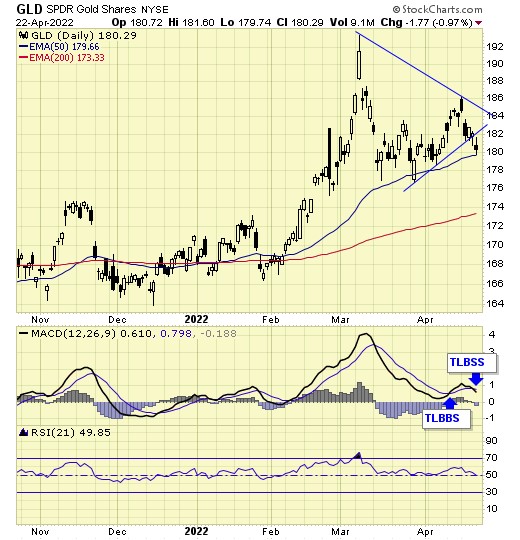
GLD is on short term sell signal.
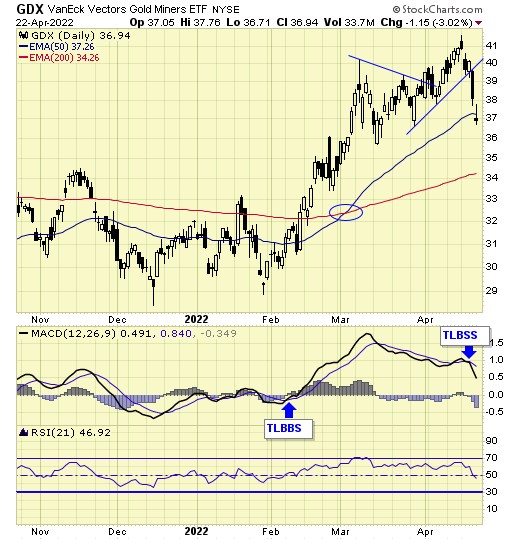
GDX is on short term sell signal.

XGD.to is on short term sell signal.

GDXJ is on short term sell signal.
Analysis
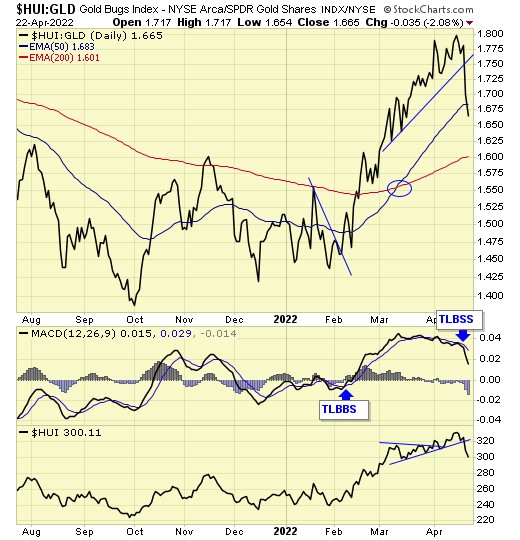
Our ratio is on sell signal.

Trend is up for the dollar.

Trend is up for gold stocks.

Trend for gold is up.
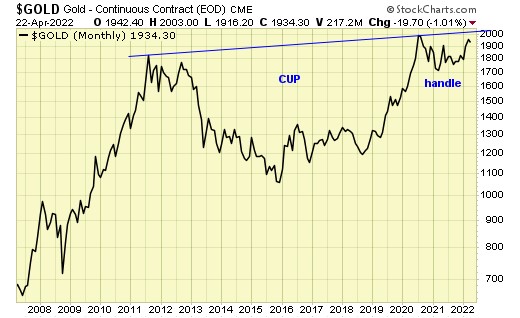
The multi-year “cup with handle” is in progress.
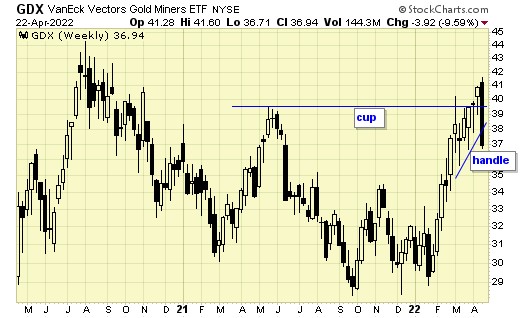
The breakout last week failed promptly.
Not a first time and will not be the last time.
Summary
Long term – on BUY signal.
Short term – on sell signals.
Gold sector cycle is DOWN.
A correction is in progress.
$$$ We are taking partial profits and holding a core position.
Read Full Story »»»
DiscoverGold
NY Gold Futures »» Weekly Summary Analysis
By: Marty Armstrong | April 23, 2022
NY Gold Futures closed today at 193430 and is trading up about 5.78% for the year from last year's settlement of 182860. Caution is now required for this market is starting to suggest it may rally further on a monthly level. As of now, this market has been rising for 7 months going into April suggesting that this has been a bull market trend on the monthly time level.
ECONOMIC CONFIDENCE MODEL CORRELATION
Here in NY Gold Futures, we do find that this particular market has correlated with our Economic Confidence Model in the past. The Last turning point on the ECM cycle low to line up with this market was 2015. The Last turning point on the ECM cycle high to line up with this market was 2020 and 2011 and 1996.
MARKET OVERVIEW
NEAR-TERM OUTLOOK
The historical perspective in the NY Gold Futures included a rally from 2015 moving into a major high for 2020, the market has been consolidating since the major high with the last significant reaction low established back in 2015. The market is still holding above last year's low. The last Yearly Reversal to be elected was a Bullish at the close of 2020.
This market remains in a positive position on the weekly to yearly levels of our indicating models.
Looking at the indicating ranges on the Daily level in the NY Gold Futures, this market remains moderately bearish position at this time with the overhead resistance beginning at 194550 and support forming below at 192400. The market is trading closer to the support level at this time.
On the weekly level, the last important low was established the week of March 28th at 189320, which was down 3 weeks from the high made back during the week of March 7th. So far, this week is trading within last week's range of 200300 to 192800. Nevertheless, the market is still trading downward more toward support than resistance. A closing beneath last week's low would be a technical signal for a correction to retest support.
Looking at this from a broader perspective, this last rally into the week of April 18th reaching 200300 failed to exceed the previous high of 207880 made back during the week of March 7th. That rally amounted to only three typical reaction weeks. Right now, the market is neutral on our weekly Momentum Models warning we have overhead resistance forming and support in the general vacinity of 189320. Additional support is to be found at 189520. Looking at this from a wider perspective, this market has been trading up for the past 18 weeks overall.
INTERMEDIATE-TERM OUTLOOK
YEARLY MOMENTUM MODEL INDICATOR
Our Momentum Models are declining at this time with the previous high made 2020 while the last low formed on 2021. However, this market has rallied in price with the last cyclical high formed on 2020 and thus we have a divergence warning that this market is starting to run out of strength on the upside.
Interestingly, the NY Gold Futures has been in a bullish phase for the past 12 months since the low established back in March 2021.
Critical support still underlies this market at 175200 and a break of that level on a monthly closing basis would warn that a sustainable decline ahead becomes possible. Immediately, the market is trading within last month's trading range in a neutral position.
DiscoverGold as US treasury jacks up the dollar within its own cycle, due to no one else buying it, and commercial banks stuffed to the gills with US debt, they will continue buying gold, and will let the price run so as to have these assets on the books, at 100% thanks to Basil III. technically it looks like gold inflection point is either here or soon will be. I expect gold to run hard into May, its technically oversold. seems when Miners lead gold the reverse is hard. looking for smooth transition above 2000 soon.
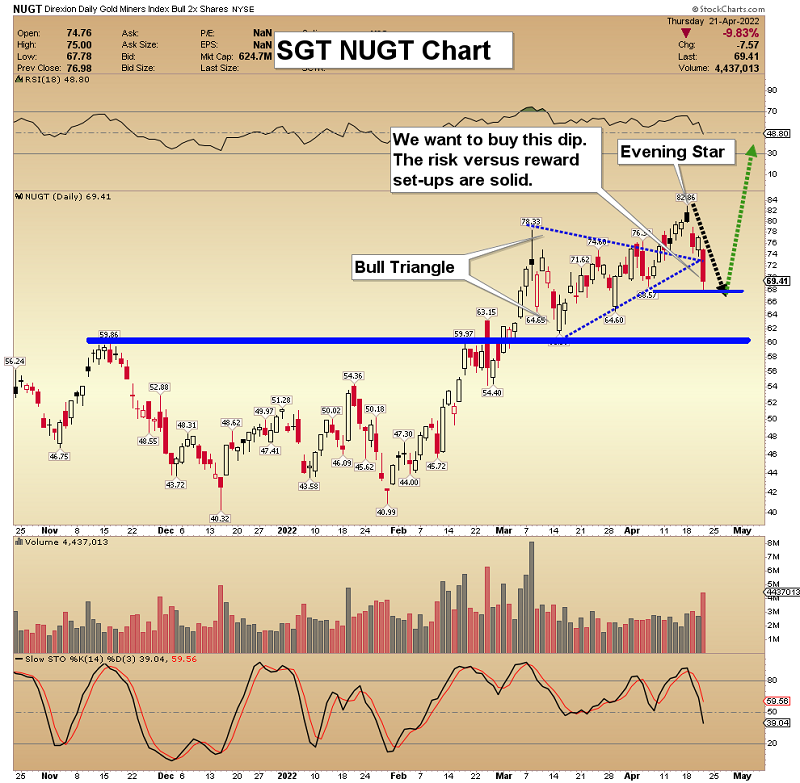
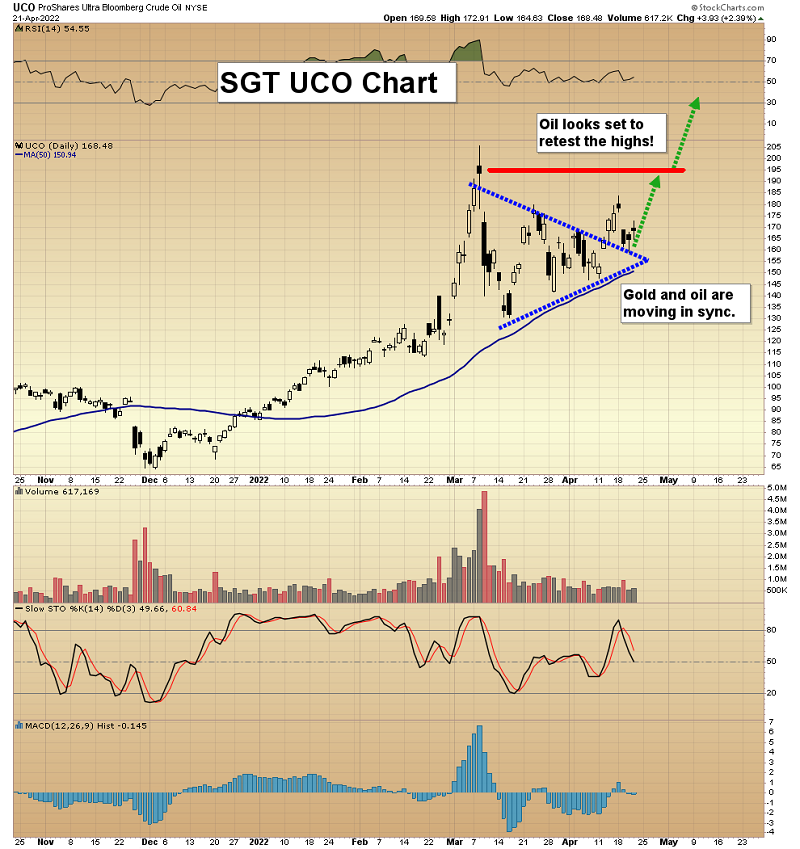
Gold Stocks: An Evening Star Caps The Rally
By: Morris Hubbartt | April 23, 2022
SGS Key Charts, Signals, & Video Analysis
Super Force Signals (SFS) is being rebranded as Super Gold Signals (SGS at https://supergoldsignals.com), to reflect the growing global importance of gold.

SG60 Key Charts, Signals, & Video Analysis

My SG60 service is ideal for investors who like some short-term action and core positions for intermediate gold/silver miners, growth stocks, oil stocks, commodity stocks, regional banks, and big-name cryptos. The SG60 subscription is just $229 per year, but I have a super special of $199 for 14 months this week. If interested, please send me an email and we’ll do it! Thank-you.
SGT Key Charts, Signals, & Video Analysis
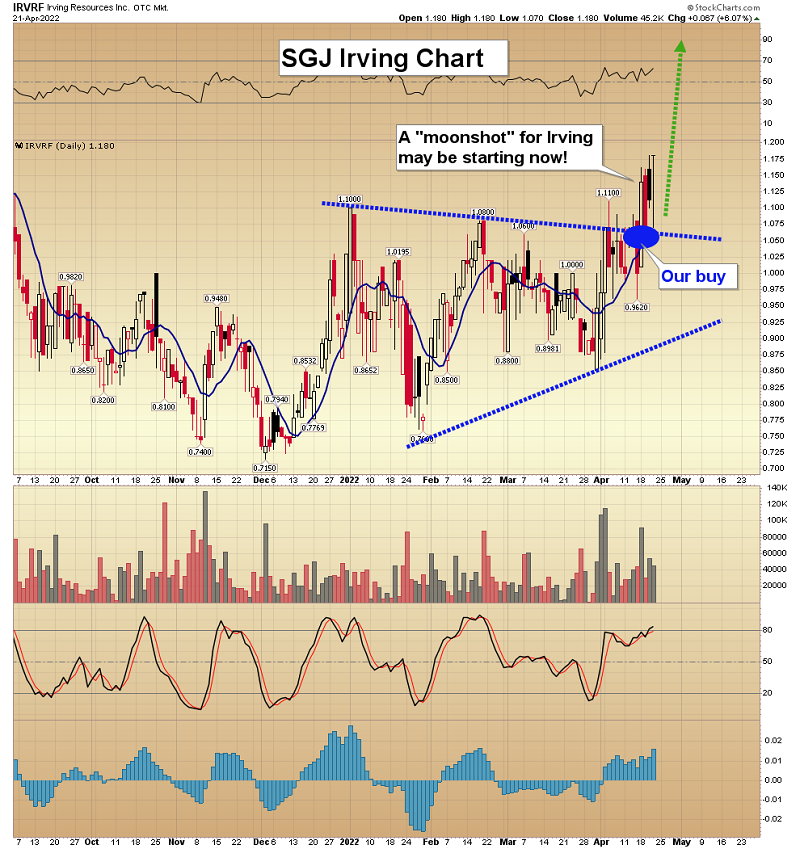
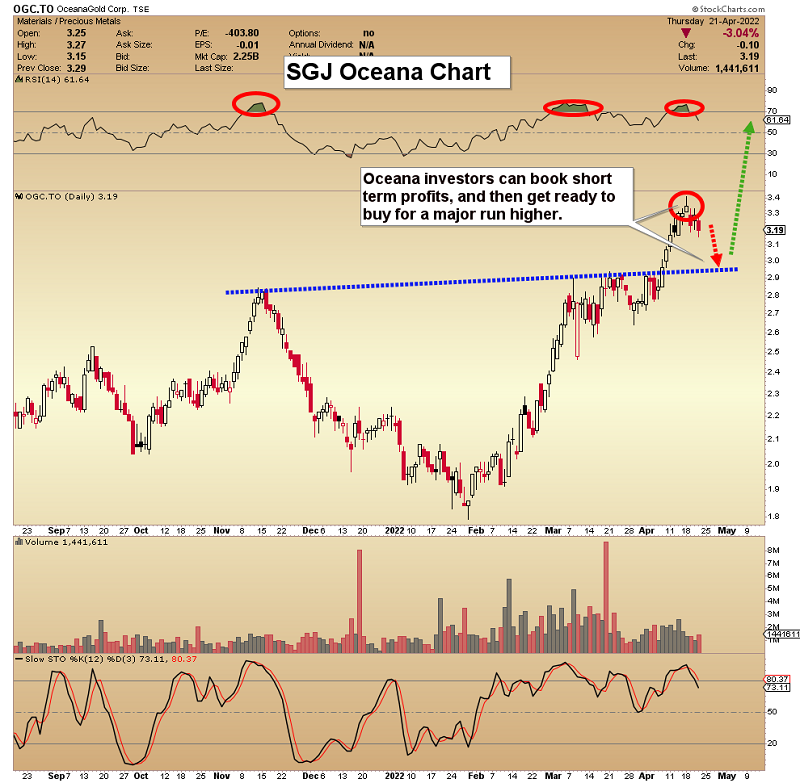
SGJ Key Charts, Signals, & Video Analysis
Read Full Story »»»
DiscoverGold
Gold Stocks Still Running
By: Adam Hamilton | April 22, 2022
The gold miners’ stocks are still running higher in a mounting upleg. These sector gains accelerated into mid-April, spawning fears of excessive overboughtness. While somewhat stretched, gold stocks’ leading benchmark remained nowhere near potentially-terminal levels. So there’s still lots of room for this latest gold-stock upleg to keep powering higher. Like usual its gains won’t be linear, but will flow and ebb with gold.
The gold-stock sector’s most-popular index remains the GDX VanEck Gold Miners ETF. Launched way back in May 2006, it parlayed its first-mover advantage into an insurmountable lead. GDX’s $16.2b of net assets this week more than tripled its next-largest competitor’s, the GDXJ VanEck Junior Gold Miners ETF. The much-bigger GDX is dominated by major gold miners, whose stocks have enjoyed a great run.
Gold stocks’ latest upleg is their sixth of this secular gold bull born back in mid-December 2015. Since GDX’s latest major interim low in late September, this leading sector ETF has rallied 41.4% at best in 6.6 months. That nicely leveraged gold’s parallel 14.6% gain in this span by 2.8x, on the higher end of GDX’s usual gold-price-move amplification range of 2x to 3x. But this upleg is way more compressed than that implies.
Hawkish Fedspeak battered both gold and its miners’ stocks sharply lower in late January, where GDX carved a secondary bottom just 1.3% above late September’s. So an overwhelming 29/30ths of gold stocks’ upleg-to-date gains have rapidly accrued in just the last 2.7 months! To surge so fast, gold stocks had to blast up dramatically. That raised the specter of extreme overboughtness, which eventually slays uplegs.
Absolute price levels usually don’t matter much in the markets, as traders soon come to accept whatever prevailing prices happen to be. This past Monday GDX hit an upleg-to-date closing high of $40.87. That is much-higher than late-January’s low, but much-lower than this ETF’s bull-to-date peak of $44.48 from early-August 2020. Prices are all relative, so what really matters is how fast they moved to current levels.
Overboughtness quantifies the rapidness and magnitude of rallies. The major gold stocks powering 41% higher over a half-year is very different from them skyrocketing that same 41% in a week. The former gains are gradual and sustainable, averaging out to modest 0.3% daily advances. Yet the latter requires huge consecutive 8.2% up days, which are super-unlikely and certainly not a buying pace that can be kept up.
Overboughtness threatens uplegs when prices surge too far too fast to be sustainable. That generates too much greed too soon, attracting in too many traders to chase the exciting upside momentum. Their rush pulls forward too much of their potential near-future buying, leaving their capital firepower exhausted. Then sellers soon overpower those depleted buyers, prematurely killing uplegs well before they fully mature.
There are many technical tools to measure overboughtness and opposing oversoldness after selloffs. My favorite is one I developed decades ago called Relativity. It simply looks at prevailing prices as multiples of their own underlying 200-day moving averages. 200dmas are ideal baselines from which to measure the speed and size of price moves. While they are slow to change, they do still gradually trail prices over time.
200dmas evolve with prevailing prices, never becoming obsolete like static baselines. Relativity Trading simply divides daily closing prices by their underlying 200dmas, then charts the resulting multiples over time. These are perfectly-comparable percentages regardless of prevailing price levels. And they tend to form horizontal trading ranges in trending markets, which are ideal for actively gaming bull uplegs and corrections.
This chart superimposes GDX technicals over its Relative GDX overboughtness-oversoldness indicator, or rGDX, over the past couple years or so. Rendered in red, this effectively flattens GDX’s 200dma to horizontal at 1.00x. This leading sector ETF’s price action meanders around that baseline in comparable terms. While gold stocks may be short-term overbought, they are nowhere near upleg-threatening extremes.
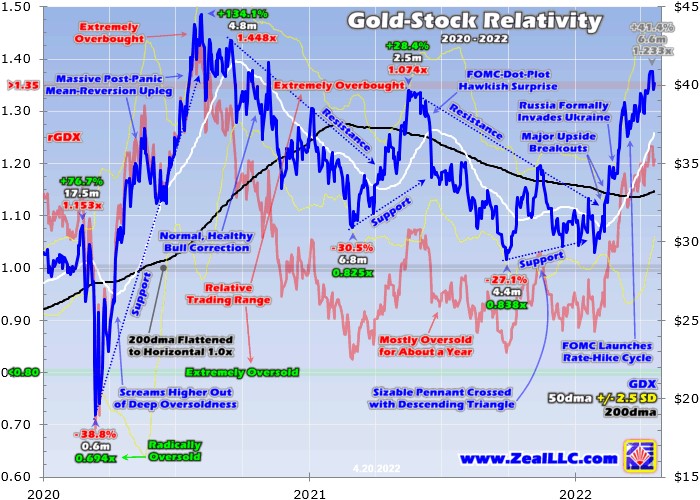
GDX’s impressive surge higher since late January is readily-evident in this chart. It included a powerful upside breakout from a major technical formation, a sizable pennant crossed with a descending triangle. That was followed by a more-important 200dma upside breakout, which both happened before Russia invaded Ukraine catapulting gold prices sharply higher. Gold stocks’ upside momentum has been very strong.
Such a big-and-fast surge left technically-oriented traders increasingly worrying about overboughtness in this sector. The quicker and higher gold stocks rally, the greater the risks they will become unsustainably-overbought. Lesser overboughtness can trigger mid-upleg pullbacks, while greater overboughtness kills uplegs ushering in deeper and longer corrections. So monitoring overboughtness is essential when riding uplegs.
Heading into that long Easter weekend as GDX rallied to new upleg highs, the rGDX stretched to 1.233x. In other words, GDX closed 23.3% above its trailing 200-day moving average. Also well over its shorter-term 50dma, this leading gold-stock benchmark was definitely overbought. But was it overbought-enough to threaten to prematurely truncate gold stocks’ latest upleg? Nowhere close according to bull-to-date precedent.
I started looking at price levels relative to their 200dmas way back in 2004, and have spent long years since both backtesting Relatively and actively trading on it. The latest five calendar years proved to be a good general timespan over which to define Relatively trading ranges. These are based on best-fit horizontal lines for relative multiples’ lower-support and upper-resistance levels. GDX’s current range is shown above.
The rGDX’s trading-range support is down near 0.80x its 200dma. Those are extremely-oversold levels seen after major corrections that are really likely to birth new bull-market uplegs. Both GDX’s current young upleg and its previous couple launched after the rGDX plunged under or neared that strong-buy zone. In late September, GDX fell to 0.838x before the preceding correction gave up its ghost ushering in today’s upleg.
On the overbought end of this spectrum, rGDX trading-range resistance is up near 1.35x its 200dma. These are extremely-overbought levels revealing high odds bull-market uplegs are topping before rolling over into subsequent corrections. Once GDX stretches more than 35% above its 200dma, traders need to be wary of uplegs failing. That doesn’t mean selling outright, just ratcheting up trailing-stop-loss percentages.
When mature uplegs are really surging and fueling popular excitement, they can coast longer and higher on self-feeding upside momentum. The faster gold stocks rally, the more traders want to chase their big gains. As exact upleg toppings aren’t knowable in real-time, realizing gold-stock gains risks missing out. It is more prudent to tighten up trailing stops to ride the upleg as long as possible while protecting more gains.
GDX’s latest 1.233x upleg-to-date relative-multiple high remains well under that 1.35x warning zone! So odds are this latest gold-stock upleg hasn’t yet surged high-enough fast-enough to exhaust traders’ near-term buying potential. The major gold stocks may be short-term overbought, but pullbacks within ongoing uplegs are natural and healthy. They rebalance sentiment, preventing greed from growing excessive too soon.
Even 1.35x is actually on the lower side historically for major gold-stock upleg toppings. For years GDX’s relative-trading-range upper resistance actually ran near 1.50x. It was just dragged down to 1.35x in the most-recent trading-range update late last year, thanks to one of the most-extreme market anomalies witnessed in our lifetimes. That was March 2020’s pandemic-lockdown stock panic, which is seen in this chart.
Leading into that, GDX had powered 76.7% higher over 17.5 months in a major upleg. That gradual rate of ascent was very sustainable, so the rGDX was only running 1.153x when gold stocks reached their last interim high before COVID-19 lockdowns slammed global markets. GDX had stretched higher above its 200dma within that upleg, but never enough to threaten its demise. Then gold stocks were sucked into that panic.
They plummeted as gold was battered lower on epic gold-futures selling in response to huge safe-haven dollar buying. We aggressively bought the resulting radically-oversold gold-stock lows, which I argued at the time were an unsustainable anomaly. Indeed GDX rocketed higher into a massive 134.1% upleg over just 4.8 months, which crested at a 1.448x rGDX multiple in early August 2020. That was a more-normal peak.
The subsequent gold-stock upleg into mid-May 2021 was also killed way early by another unique event. That was when the Federal Reserve started its gargantuan hawkish pivot from zero interest rates and epic quantitative-easing money printing to both rate hikes and quantitative tightening looming. So that gold-stock upleg failed super-early, at just 28.4% GDX gains over 2.5 months and a mere 1.074x rGDX.
With the world finally learning to live with COVID-19, it certainly won’t spawn another lockdown-driven stock panic. And with the Fed’s newest rate-hike cycle already underway and set to accelerate as QT follows hot on its heels, the next market-shaking hawkish Fed pivot is many years away. So gold and its miners’ stocks are likely to return to more-normal Relativity trading ranges less distorted by anomalous events.
Even including that pair of prematurely-killed squib uplegs, all five GDX has completed so far during this secular gold bull have still averaged awesome 85.0% gains! So today’s sixth just hitting +41.4% at best still remains small compared to bull-to-date precedent. It should continue powering higher on balance for months to come. The gold stocks’ sentiment, technicals, and fundamentals remain exceedingly-bullish.
While GDX’s powerful surge over the last several months left it somewhat-overbought, sector psychology never grew particularly-bullish. Gold stocks still hadn’t surged far-enough fast-enough to spawn sufficient greed to expand this contrarian sector’s popularity into mainstream traders. Normal bull uplegs generally don’t fail until excessive greed attracts in too many traders too soon exhausting their near-term buying potential.
That terminal gold-stock euphoria hasn’t developed yet because this upleg hasn’t been exciting enough to drive it. Again still small compared to GDX’s bull uplegs in recent years, gold stocks haven’t surged far enough to challenge upleg-threatening levels of overboughtness. Upside momentum needs to accelerate dramatically before that can happen. A major technical buy signal and strong seasonality ought to hasten that.
In mid-March GDX flashed a fabled Golden Cross buy signal, as its shorter 50dma climbed back above its longer 200dma! These powerful buy signals happen early in major uplegs, with the last decisive Golden Cross triggering early in mid-2020’s huge 134.1% GDX surge. And May is actually the strongest month of the year seasonally for gold stocks, with an older index averaging big 4.9% gains in modern gold-bull years.
Gold stocks are ultimately leveraged plays on gold, which overwhelmingly drives their earnings and thus stock prices. The major gold miners of GDX have earned fat profits for seven quarters in a row before this latest Q1’22, which will be reported over the next several weeks. With this newest quarter’s average gold price surging another 4.6% higher than the preceding Q4’21’s, the gold miners’ Q1 results should prove great.
Higher earnings will force their generally-already-low valuations even lower, leaving their fundamentals looking even more bullish. Those will continue improving as gold prices keep marching higher on balance, driven by the raging inflation unleashed by extreme Fed money printing and stock markets likely rolling over into a bear market on Fed tightening. Last week’s gold-upleg-strengthening essay analyzed both.
So this current gold-stock upleg is well-positioned to keep powering higher on balance in coming months. While it will flow and ebb like usual, surging higher before pulling back, it hasn’t yet grown large-enough or gotten overbought-enough to threaten giving up its ghost. Sentiment, technicals, and fundamentals are still giving all-clear-ahead signals. Thus any weakness can be used as buying opportunities to add positions.
If you regularly enjoy my essays, please support our hard work! For decades we’ve published popular weekly and monthly newsletters focused on contrarian speculation and investment. These essays wouldn’t exist without that revenue. Our newsletters draw on my vast experience, knowledge, wisdom, and ongoing research to explain what’s going on in the markets, why, and how to trade them with specific stocks.
That holistic integrated contrarian approach has proven very successful. All 1,296 newsletter stock trades realized since 2001 averaged outstanding +20.0% annualized gains! Today our trading books are full of great fundamentally-superior mid-tier and junior gold and silver miners to ride their uplegs. These stocks have recently surged sharply, but still have massive room to run. Subscribe today and get smarter and richer!
The bottom line is gold stocks are still running higher, their sixth upleg of this secular gold bull remaining underway. Despite its strong rally in recent months, the leading GDX gold-stock benchmark hasn’t yet hit upleg-threatening levels of overboughtness. Gold stocks still haven’t surged high-enough fast-enough to generate excessive popular greed, which is necessary to accelerate their gains to extreme overboughtness.
Until that happens, there’s no need to worry about this young upleg failing. Both gold stocks’ technicals and fundamentals are strong and still improving, with gold itself continuing to power higher on balance. This underlying gold bull fueling gold stocks’ gains should head much higher on the Fed’s raging inflation, and weaker stock markets hit by aggressive Fed tightening. This is a super-bullish backdrop for gold stocks.
Read Full Story »»»
DiscoverGold
$XME Metals & Mining ~ SIZE #option flow in to the 05/20/22 $57 PUTS ~ $5.15 mil premium/32K contracts
By: Money Flow Mel | April 22, 2022
• $XME Metals & Mining ~ SIZE #option flow in to the 05/20/22 $57 PUTS ~ $5.15 mil premium/32K contracts.

Read Full Story »»»
DiscoverGold
Gold miner Newmont (NEM) Earnings Miss Despite Higher Gold Prices. The Stock Is Dropping
By: Barron's | April 22, 2022
Newmont mining stock was falling after the gold miner’s quarterly earnings fell short of investor expectations.
Newmont (ticker: NEM) reported adjusted earnings per share of 69 cents in the first quarter, lower than the 72 cents expected, according to analysts surveyed by FactSet. For the quarter ended in March, revenue grew by 5% to $3.02 billion as higher average realized gold prices and an increase in copper sales volumes drove sales higher, the company said. Still, sales missed the $3.08 billion estimated by analysts.
Rising costs might also be a problem for Newmont. “In 2022, an additional 5% of cost escalation is incorporated into our direct operating costs related to labor, energy, and material and supplies,” the company said.
The stock fell 2% to $75.49 in premarket trading on Friday.
Newmont stock is up 24.3% year to date, through Thursday’s close, as investors seek havens amid Russia and Ukraine war. Gold prices are up almost 7% year to date. Newmont was one of Barron’s 2021 stock picks; it gained 3.6% last year.
Out of 19 analysts tracked by FactSet, 13 are bullish on the stock, while six rate it as Hold. The average target for the stock price is $105.93, up 37% from Thursday’s close.
Read Full Story »»»
DiscoverGold
$GDX 3.63 Million #darkpool Shares at $38.09
By: Money Flow Mel | April 21, 2022
• $GDX 3.63 million #darkpool shares at $38.09.

Read Full Story »»»
DiscoverGold
Gold Markets Continue to Find Buyers on Dips
By: Christopher Lewis | April 21, 2022
• Gold markets have fallen again during the trading session on Thursday as we continue to see a lot of pressure put on the marketplace. However, we continue to see buyers come back into the picture.
Gold Market Technical Analysis
Gold markets have fallen during the trading session on Thursday to reach below the $1950 level again. This is an area that seems to attract a lot of buyers, and therefore I think it is only a matter of time before we get a little bit of a bounce, but that does not necessarily mean that it is going to be easy to do so. The 50 Day EMA is currently at the $1927 level and rising. This should offer a little bit of a “floor in the market”, and therefore gives you an area to pay close attention to if we do continue to break down.
On the upside, if we can turn around and take out the $1970 level, then it would continue the overall uptrend, perhaps even opening up the possibility of threatening the $2000 level. The $2000 level is a large, round, psychologically significant figure, and an area where we have seen a lot of selling pressure previously. Because of this, I think it would make quite a bit of sense to see that area as one that is difficult but quite likely going to be broken above given enough time. Ultimately, this is a market that I think will continue to see a lot of noisy behavior, but I still believe that the longer-term uptrend is very much intact.
At this point, I think the market is one that continues to attract plenty of people to buy on dips, and I think that will continue to be the case until we break down below the $1900 level. If we were to break down below the $1900 level, then it is possible we really start to break down drastically.
Read Full Story »»»
DiscoverGold
The Ord Oracle: GDX Update
By: Markets & Mayhem | April 20, 2022
SPX Monitoring Purposes: Long SPX on 3/25/22 at 4543.06.
Monitoring Purposes GOLD: Long GDX on 10/9/20 at 40.78.
Long Term SPX Monitor Purposes: Neutral.

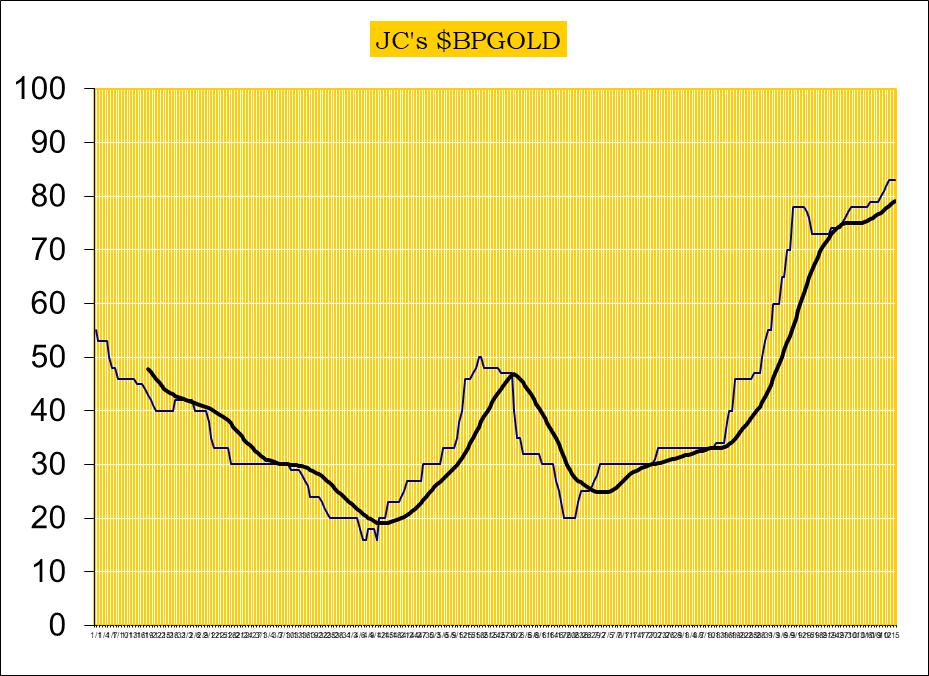
There is no cause for concern right now, but there will be when the Bullish Percent index for the Gold miner's index hits 100%; the last two times, GDX was at an intermediate-term top. The Bullish percent index is sitting at 83% (83% of the stocks in the Gold miners index are on a Point and Figure buy signal). The chart above goes back to 2008 and shows all the history for the bullish percent index. According to our indicators, which you have seen in our reports, the bull market has further to go both in time and price, but when the Bullish Percent index gets to 100%, the market will be due for a rest.
Tim Ord,
Editor
Read Full Story »»»
DiscoverGold
Bank of America still sees gold price hitting record highs and silver price pushing to $30
By: Neils Christensen | April 19, 2022
The gold and silver are seeing some solid technical selling pressure after gold tested resistance at $2,000 an ounce at the start of the week. However, technical analysts at Bank of America Securities said that any dip in the price could be seen as a buying opportunity for both precious metals.
The gold market is currently trying to hold support at around $1,960 an ounce. But the analysts at BofA aren't too worried if that level breaks. In a report published Tuesday, the bank said that the precious metal remains on course to record all-time highs as long as prices stay above the trending average at $1,888 an ounce.
"We think the daily, weekly and monthly timeframes still indicate higher gold prices this year. Therefore we like longs/buying dips near $1,940/50 for tactical trades and if above $1,888/oz for medium-term trades. Our measured move targets suggest $2,175/oz can still be seen," the analysts said.
Looking at gold's technical picture, the analysts said that the precious metal is forming a bullish cup and handle pattern. In the near term, the price action looks a little exhausted. However, they added that they expect support to hold between $1,940 and $1,950 an ounce.
The analysts added that the precious metal sector could be on the cusp of being one of the best-performing commodities for the year.
"Gold vs. copper and gold vs. silver look like they are forming bottoms in favor of gold outperforming this summer. They just need one break higher to confirm. Gold vs. bonds and silver vs. bonds are breaking out to new highs suggesting precious metals are preferred, instead of bonds," the analysts said. "Silver vs. oil and silver vs. copper look supported and may start to form bottom patterns to indicate silver outperformance in 2Q-4Q22."
Looking at silver prices, BofA reiterated its call for prices to push to $30 an ounce this year. The bullish outlook comes as silver prices fall nearly 3% on the day, with May silver futures last trading at $35.39 an ounce.
"Tactical views need to hold support at $24.80 while medium-term views need to hold $24.00/oz. A trend line in upper $23s is a last resort," the analysts said in the report.
Although Bank of America remains bullish on gold and silver, the analysts said that there is a risk that the yellow metal forms a double top at the 2021 record high of $2,078. However, they noted that risks are still low.
"Gold would need to start selling off in the next 1-2 months, such as below the last breakout point of $1,840, to entertain the possibility of a double top and large decline," the analysts said.
Although gold prices have room to move against the U.S. dollar, BofA said that the precious metal looks stretched against other currencies like the euro and the Japanese yen.
Read Full Story »»»
DiscoverGold
NY Gold Futures »» Weekly Summary Analysis
By: Marty Armstrong | April 16, 2022
NY Gold Futures closed today at 197490 and is trading up about 8.00% for the year from last year's settlement of 182860. Caution is now required for this market is starting to suggest it may rally further on a monthly level. Historically, this market has been declining for going into 2022 reflecting that this has been only still a bearish reactionary trend. As we stand right now, this market has made a new high exceeding the previous year's high reaching thus far 207880 while it is still trading above last year's high of 196250.
MARKET OVERVIEW
NEAR-TERM OUTLOOK
The historical perspective in the NY Gold Futures included a rally from 2015 moving into a major high for 2020, the market has been consolidating since the major high with the last significant reaction low established back in 2015. The market is still holding above last year's low. The last Yearly Reversal to be elected was a Bullish at the close of 2020.
This market remains in a positive position on the weekly to yearly levels of our indicating models.
Focusing on our perspective using the indicating ranges on the Daily level in the NY Gold Futures, this market remains moderately bullish currently with underlying support beginning at 197460 and overhead resistance forming above at 198100. The market is trading closer to the support level at this time. An opening above this level in the next session will imply a decline is unfolding.
On the weekly level, the last important high was established the week of March 7th at 207880, which was up 30 weeks from the low made back during the week of August 9th. We have been generally trading up for the past week from the low of the week of March 28th, which has been a move of .0301%.
INTERMEDIATE-TERM OUTLOOK
Interestingly, the NY Gold Futures has been in a bullish phase for the past 12 months since the low established back in March 2021.
Critical support still underlies this market at 175200 and a break of that level on a monthly closing basis would warn that a sustainable decline ahead becomes possible. Immediately, the market is trading within last month's trading range in a neutral position.
DiscoverGold GDX: Nothing Outright Bearish To Report
By: Avi Gilburt | April 14, 2022
While I am always on the lookout for another signal of a pullback, my bigger expectations continue to be higher. So, overall, nothing has really changed in my view.
While there are some individual mining charts that seem to be approaching a topping after a 5-wave rally seems to be completing, there is potential that we may see some pullback before we continue to head higher. However, with the MACD's on the daily charts just starting to turn up on GLD and GDX, I am not certain how much sway those miners may have on the overall GDX.
Furthermore, silver still looking to be within its (a) wave of its wave 5. And, I would like to see it push a bit higher before it sees a (b) wave pullback. But, overall, keep in mind that as long as we remain below the 28/29 region in the futures, I think we are only completing wave i, with a multi-week wave ii pullback potentially being seen around the late spring into the summer time.
So, again, nothing overall bearish to report, other than we may begin to see some charts pulling back correctively in the coming weeks before we continue higher this year.

GDXdaily

GLDdaily

Silver-144min
Read Full Story »»»
DiscoverGold
Gold’s Upstream Gleam
By: Mark Mead Baillie | April 17, 2022
• Gold’s settling out the abbreviated trading week this past Thursday in 1977 was the yellow metal’s second-highest year-to-date weekly close, bettered only by that ending 11 March 1992.

Better indeed, as it occurred within Gold’s weekly parabolic trend being Short, but defied by price now for two weeks running. Yes, as we’ve oft quipped over these many years, “Shorting Gold is a bad idea” especially when price gaps up over Smart Alec’s Short stop as periodically happens toward wrecking his account, (see 19.Mar.2009, 16.Mar.2020, 28.Feb.2022, et alia).
“Jeepers, mmb, that’s 118 points of opening up gaps for those three days alone…”
That’s why ’tis a bad idea, Squire. And we can wax far more eloquently thereto (like 631 points of up gaps from just 37 days this century … but we digress). Instead, let us process to Gold’s weekly bars from one year ago-to-date. And like salmon spawning upstream against onrushing water, we see Gold rising toward the descending red dots of parabolic Short trend. Fairly gleaming stuff, one has to say:

To be sure, ‘twould be imprudent not to acknowledge said trend as Short. However, to see it proved wrong– such that we can get on toward attaining our forecast high for this year of 2254 per the dashed top line — is the far better and broader story.
Geo-politically anew, musings of a “NucWpn”, loss of a “towed” warship (by either a “stormy sea” else a “missile spree”) can be rationale for Gold again getting a boost, and in turn, the S&P 500 being given the boot; (yet, we reprise the infamous headline: “World Ends, Dow +2”). Either way, we’d prefer to see “Gold is on the move” due instead to the debased StateSide money supply, its “M2” measure of which in the new week ought surpass the $22 trillion level to have doubled in eight years.
And yet: Gold’s price is only 1977? The market is never wrong, but the irrationality of price today not trading ’round the 4000s is off the far end of Gaussian’s bell curve.
All that noted, a favourite measure of ours for detecting if a market is “in play” is the directional change of its “expected daily trading range”. Here below ’tis for Gold from one year ago-to-date, clearly of late in “El Plungo” form as range (rather than staying geo-politically hyped) returns toward “normal” levels from well before events related RUS/UKR 2022. Thus we’ve the nauseating interpretation that Gold at present is not “in play” despite ours (and everyone’s) common sense thinking that both range and price ought be “up, up and away”:

“Still, price has been up almost as much as 14% so far this year, mmb…”
True enough, Squire. And at 1977 today, Gold at present is +8% net in 2022. Should that be maintained, Gold shall record its seventh-best “year-through-April” percentage gain from 2001-to-date: not really that great given the war, inflation/stagflation, debasement and thus massive undervaluation. Comparably in 2006, Gold’s Jan-Apr gain was a net +26%, and ’twas +22% for the like four months in 2016. Yet as just itemized, there are far more “dire” events afoot now than there were back then.
But again, in the words of charter Gold Update reader JGS: “One day we’ll wake up and Gold’ll be 1,000 points higher than the day before.” For the sake of humanity, ’tis probably better we never see that. Rather, to get Gold’s gains realigned with StateSide currency debasement as we witnessed throughout this century’s first decade would be perfectly acceptable, per this magnified 10-year snippet from our opening Gold Scoreboard graphic:

Meanwhile economically off the Dow Jones Newswires this past week came “After Rapid Recovery, Watch for Sudden Slowdown…” Per the Economic Barometer, the lads are having difficulty parsing it all out:
Our best guess is in reference to Q4 Gross Domestic Product annualized growth having been recently finalized at 6.9% (with a blind eye to the 7.1% Chain Deflator, i.e. “real” economic shrinkage). That said, the Baro did put in a good week: April’s University of Michigan Sentiment Survey and New York State Empire Index posted improvements, as did March’s Retail Sales (save for cars) and Capacity Utilization.
However, this all came amidst further inflation in both Export and Import Prices, Wholesale and Retail Inflation, (albeit the Core reading of the Consumer Price Index actually slowed). As well, the U.S. Treasury reduced some of its budget deficit. But February’s Business Inventories became more bloated.
Then there’s the Federal Reserve with just 13 trading days left until they again raise. And as noted a week ago, the FedFundsFutures already have “priced-in” a 50-basis-point increase come 04 May. Indeed St. Louis FedPrez James “Bullish” Bullard, NY FedPrez John “It’s All Good” Williams, and FedGov Christopher “Up The” Waller all see a 50-bps hike in the cards. Besides, they gotta keep up with The Reserve Bank of New Zealand and The Bank of Canada, both having already so moved.
Upwardly mobile as well are the precious metals’ “Baby Blues”, the dots that depict linear regression trend consistency. Below on the left we’ve Gold’s daily bars from three months ago-to-date, the blue dots clearly in ascent, as they are on the right for Silver. As noted of late, the two charts being ever so similar is indicative of Sister Silver adorned not in her industrial metal jacket, but rather in her precious metal pinstripes:
To the 10-day Market Profiles we go for Gold (below left) and Silver (below right). And for both cases respectively, should their congestion areas of 1967-1982 and 25.50-25.95 become support, then for the yellow metal ’tis “Hello 2000” and “Hello 27” for the white metal, (barring the evil parabolic Short trend having its way):

* * *
Read Full Story »»»
DiscoverGold
Mining companies have to aggressively rebuild their gold reserves with M&A – Ian Telfer
By: Neils Christensen | April 15, 2022
Mining companies need to aggressively grow their reserves through mergers and acquisitions if they want to attract new investors, according to mining legend Ian Telfer.
In the last few years, the mining sector has seen a significant improvement in margins as higher prices and solid production has driven cash flow to record levels. However, Telfer said that many producers are making a mistake trying to attract investors with share buybacks and increased dividends. He added that this is not a sustainable trend for the sector.
"I don't know any investor who buys a gold stock for the dividend," he said. "The only people that buy gold shares are people who think the price of gold is going higher."
Instead of buying back shares, Telfer said that mining companies should be using their growing stockpile to look for acquisition targets. He added that in the current environment, the only way a company is going to grow is through aggressive M&A activity.
Telfer reiterates his base case that the mining sector has seen peak gold. He added that all the easy gold has been discovered and it's going to get more and more challenging and expensive to find major precious metal deposits.
"I don't think we are ever going to see projects valued at $1,200 gold again. If that is the criteria you are looking for, then you will see your reserves shrink away to nothing," he said. "Mining companies have to be aggressive when it comes to rebuilding their reserves and that is what will attract investors. Gold investors want to see companies that are growing."
Telfer is also putting his words into action as independent chair of Aris Gold Corp (TSX: ARIS);. Tuesday, the junior producer closed its acquisition for a 20% joint-venture interest in the Soto Norte gold project in Colombia, to become the operator.
According to the project's Feasibility Study, the deposit contains indicated mineral resources of 8.5 million ounces of gold, 55.3 million ounces of silver, and 193 million pounds of copper.
Aris plans to develop Soto Norte as an underground mine that will see annual gold production of around 450,000 ounces.
The company noted that along with its current Marmato mine, which is expected to produce 175,000 ounces of gold per year when both the Upper Mine and Lower Mine are operating, the transaction will position Aris Gold as a significant mid-tier gold producer in Colombia.
"Getting our hands on Soto Norte was a huge step forward for the company," Telfer said. "We think that there are enough opportunities out there for us to build another major gold producer. It won't be easy and you have to be aggressive. There's no doubt about it, but in my view, I think that's the way to go."
Read Full Story »»»
DiscoverGold
Jack Chan: Gold Price Exclusive Update
By: Jack Chan | April 16, 2022
Our proprietary cycle indicator is UP.
To public readers of our updates, our cycle indicator is one of the most effective timing tool for traders and investors. It is not perfect, because periodically the market can be more volatile and can result in short term whipsaws. But overall, the cycle indicator provides us with a clear direction how we should be speculating.
Investors
During a major buy signal, investors can accumulate positions by cost averaging at cycle bottoms, ideally when prices are at or near the daily 200ema.
During a major sell signal, investors should be hedged or in cash.
Traders
Simply cost average in at cycle bottoms when prices are at or near the daily 200ema; and cost average out at cycle tops when prices are above the daily 50ema.
Gold sector is on a new long term BUY signal, suggesting that the correction since 2020 has been completed.

GLD is on short term buy signal.
GDX is on short term buy signal.
XGD.to is on short term buy signal.
GDXJ is on short term buy signal.
Analysis

Our ratio is on buy signal.
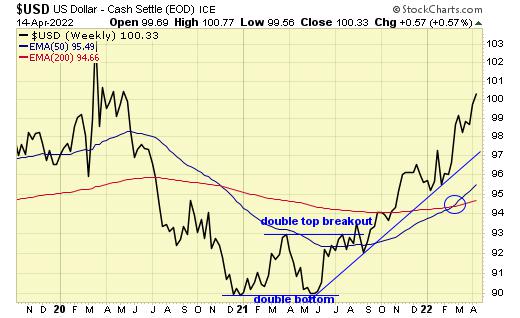
Trend is up for the dollar.
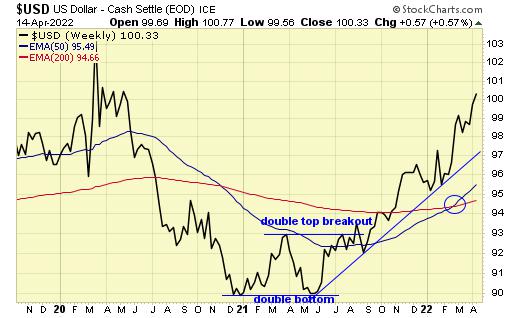
Trend is up for gold stocks.
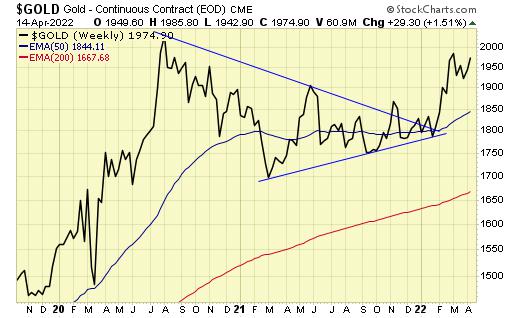
Trend for gold is up.
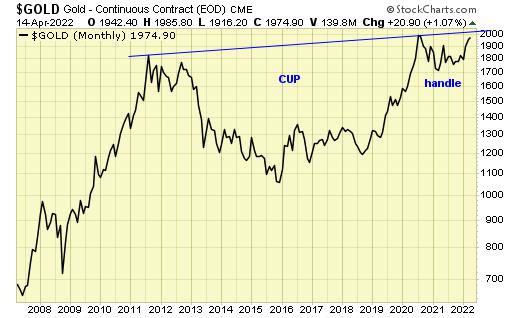
The multi year “cup with handle” is in progress.
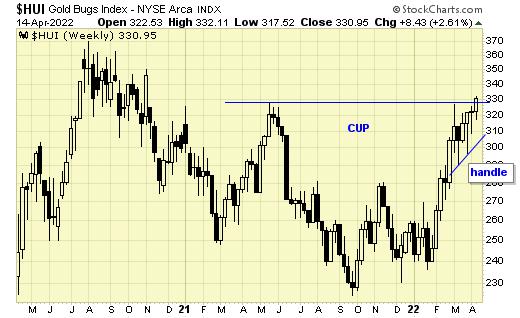
A breakout this week.
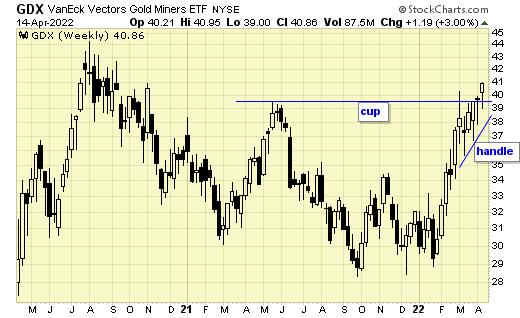
A decisive breakout this week.
Summary
Long term – on BUY signal.
Short term – on buy signals.
Gold sector cycle is UP.
$$$ We continue to hold our profitable positions.
Read Full Story »»»
DiscoverGold
COT - Commitments of Traders in Metals Futures Market Reports
By: Software North | April 15, 2022
Gold
Silver
Read Full Story »»»
DiscoverGold
Major Cracks in the Dollar as customers buying commodities in rubbles.
$GDX Sweeper Alert
By: Theta Warrior | April 13, 2022
• $GDX Sweeper Alert.

Read Full Story »»»
DiscoverGold
The Ord Oracle: GDX Update
By: Markets & Mayhem | April 13, 2022
SPX Monitoring Purposes: Long SPX on 3/25/22 at 4543.06.
Monitoring Purposes GOLD: Long GDX on 10/9/20 at 40.78.
Long Term SPX Monitor Purposes: Neutral.

Yesterday, GDX tested the "Buying Climax" high of 3/8/22 on lighter volume and backed away. Today, GDX is back to the 3/8 high and not backing away. If GDX holds near the 3/8 high of 40.26, it will imply that GDX is eating through supply and will eventually work higher. If GDX manages to stay near current prices or higher for the next couple of days, that will imply the next impulse wave has started. Notice that market has only retraced 38.2% retracement of the previous rally from the late January low. This condition suggests the retracement is at the halfway point of the move up, giving a target near the 47.00 range on GDX.
Tim Ord,
Editor
Read Full Story »»»
DiscoverGold
$GDX Bullets 9/16/22 45 Calls
By: Theta Warrior | April 13, 2022
• $GDX BULLETS.

Read Full Story »»»
DiscoverGold
$GDX went higher this week too which confirms that it's likely to surpass its March high next week and make a new multi month high
By: CyclesFan | April 10, 2022
• $GDX went higher this week too which confirms that it's likely to surpass its March high next week and make a new multi month high. The next intermediate term high is likely to be a major high from which it will start a decline into the 7 year cycle low in 2023.

Read Full Story »»»
DiscoverGold
excellent article. GDX btw, is at resistance, from May of last year. We can expect it to shortly, in the next day or week or 3 weeks, to punch through this resistance, and then make a very compelling move higher. The path is so obviously upwards. Remember too, GDX may well be now providing downside support. In other words, it may hold its own or go upwards, even during down days in the S and P. .............so either way, the path is steadily higher.
GDX is not a hot item right now, but we are building and building here. It will pick up momo when it punches through this resistance from last May and early June
NY Gold Futures »» Weekly Summary Analysis
By: Marty Armstrong | April 9, 2022
The NY Gold Futures has been in an uptrend for the past 2 days closing above the previous session's high. The broader rally has unfolded over the past 8 days. Currently, the market is trading in a neutral position on our indicators but it is trading strongly higher up some 1.50% from the previous session low. Our projected target for closing resistance for the next session stands at 197020, we need to close above that target to imply a further advance. Failure to even exceed this intraday warns that the upward momentum is starting to decline. Nevertheless, this session closed below our ideal projection for closing resistance warning that the market which stood at 196720 is forming a high. A break of this session's low of 193040 will warn that we have a potential temporary high in place.
ECONOMIC CONFIDENCE MODEL CORRELATION
Here in NY Gold Futures, we do find that this particular market has correlated with our Economic Confidence Model in the past. The Last turning point on the ECM cycle low to line up with this market was 2015. The Last turning point on the ECM cycle high to line up with this market was 2020 and 2011 and 1996.
MARKET OVERVIEW
NEAR-TERM OUTLOOK
The historical perspective in the NY Gold Futures included a rally from 2015 moving into a major high for 2020, the market has been consolidating since the major high with the last significant reaction low established back in 2015. The market is still holding above last year's low. The last Yearly Reversal to be elected was a Bullish at the close of 2020.
This market remains in a positive position on the weekly to yearly levels of our indicating models.
Focusing on our perspective using the indicating ranges on the Daily level in the NY Gold Futures, this market remains moderately bullish currently with underlying support beginning at 194460 and overhead resistance forming above at 194890. The market is trading closer to the support level at this time. An opening above this level in the next session will imply a decline is unfolding.
On the weekly level, the last important high was established the week of March 7th at 207880, which was up 30 weeks from the low made back during the week of August 9th. We have been generally trading up for the past week from the low of the week of March 28th, which has been a move of .0301%.
INTERMEDIATE-TERM OUTLOOK
YEARLY MOMENTUM MODEL INDICATOR
Our Momentum Models are declining at this time with the previous high made 2020 while the last low formed on 2021. However, this market has rallied in price with the last cyclical high formed on 2020 and thus we have a divergence warning that this market is starting to run out of strength on the upside.
Interestingly, the NY Gold Futures has been in a bullish phase for the past 12 months since the low established back in March 2021.
Critical support still underlies this market at 175200 and a break of that level on a monthly closing basis would warn that a sustainable decline ahead becomes possible. Immediately, the market is trading within last month's trading range in a neutral position.
DiscoverGold
Gold sector is on a new long term BUY signal, suggesting that the correction since 2020 has been completed.
Jack Chan: Gold Price Exclusive Update
By: Jack Chan | April 9, 2022

Our proprietary cycle indicator is UP.
To public readers of our updates, our cycle indicator is one of the most effective timing tool for traders and investors. It is not perfect, because periodically the market can be more volatile and can result in short term whipsaws. But overall, the cycle indicator provides us with a clear direction how we should be speculating.
Investors
During a major buy signal, investors can accumulate positions by cost averaging at cycle bottoms, ideally when prices are at or near the daily 200ema.
During a major sell signal, investors should be hedged or in cash.
Traders
Simply cost average in at cycle bottoms when prices are at or near the daily 200ema; and cost average out at cycle tops when prices are above the daily 50ema.

Gold sector is on a new long term BUY signal, suggesting that the correction since 2020 has been completed.

GLD is on short term sell signal.

GDX is on short term buy signal.

XGD.to is on short term sell signal.

GDXJ is on short term buy signal.
Analysis

Speculation pulling back from level of previous top.

Our ratio is on buy signal.

Trend is up for the dollar.

Trend is up for gold stocks.

Trend for gold is up.

The multi year “cup with handle” is in progress.

A cup with handle is in progress on the weekly chart on $HUI.

GDX is also sporting the same bullish pattern.

A firm follow thru after testing support this week.
Summary
Long term – on BUY signal.
Short term – on mixed signals.
Gold sector cycle is UP.
$$$ Our positions are firmly in the black.
Read Full Story »»»
DiscoverGold
Newmont Mining is the oldest Gold stock and has made Lows and highs every 20 or 40 years with 2022 supposed to be a Low
By: Francis Bussiere | April 9, 2022
• Newmont Mining is the oldest Gold stock and has made Lows and highs every 20 or 40 years with 2022 supposed to be a Low. In fact the Low was in 2016 which could be a Bullish sign as both the 20 year and Prime 17 year cycles show. While Gold pulled back Gold stocks did not.

Read Full Story »»»
DiscoverGold
Gold Stocks: A Lull Before The Big Rally
By: Morris Hubbartt | April 9, 2022


The tension between Russia and the West is intensifying while inflation soars and the Fed finally talks like a hawk.
SG60 Key Charts, Signals, & Video Analysis


SGT Key Charts, Signals, & Video Analysis


SGJ Key Charts, Signals, & Video Analysis


Read Full Story »»»
DiscoverGold
COT - Commitments of Traders in Metals Futures Market Reports
By: Software North | April 8, 2022
Gold
Silver
Read Full Story »»»
DiscoverGold
Gold-Stock Upleg Mounts
By: Adam Hamilton | April 8, 2022
The gold miners’ stocks have powered higher lately, enjoying mounting upleg gains. Their nice surge paralleled gold’s own, but they’ve increasingly outperformed in recent weeks. The resulting bullish gold-stock technicals are naturally fueling more-optimistic sentiment, enticing traders back. Their buying is supported by strong fundamentals, with gold miners earning fat profits at these high prevailing gold prices.
While this small contrarian sector is slowly returning to favor, it certainly isn’t popular yet. So despite their growing gains, gold stocks still haven’t hit the radars of the great majority of speculators and investors. But awareness is gradually improving, with gold miners getting mentioned with increasingly frequency on both CNBC and Bloomberg. This sector’s dominant benchmark remains the GDX VanEck Gold Miners ETF.
Gold stocks’ last correction technically bottomed in late September when GDX fell to $28.91. That was driven by gold drooping to $1,725 in the wake of a pivotal Federal Open Market Committee meeting on monetary policy. That was the one where the Fed pre-announced quantitative-easing tapering, slowing its blistering rate of conjuring up vast new money. Fed officials’ rate-hike outlook also waxed more-hawkish.
That proved the gold-stock nadir after GDX had fallen 27.1% over 4.4 months. That climaxed in a sharp capitulation plunge, leaving this sector deeply-oversold. The gold miners initially V-bounced out forming a strong early upleg, but that soon fizzled and rolled over. With the FOMC decisionmakers increasingly signaling imminent rate hikes and even quantitative-tightening monetary destruction, gold futures were dumped.
By late January GDX was pounded back down to $29.30, just 1.3% above its late-September bottoming. That swoon happened soon after late-January’s FOMC meeting, where the Fed warned it would both end its QE4 bond monetizations and start hiking its federal-funds rate off zero in March. Although gold miners’ stocks were technically still in an upleg, that was more like a double-bottoming with very-bearish sentiment.
So over 19/20ths of GDX’s total upleg gains so far accrued since just late January! Thus these past 2.2 months’ sector action is important for traders to understand. It looks like a major new gold-stock upleg is gathering steam, and those tend to grow very-large. So far during this secular gold bull born back in mid-December 2015, GDX has enjoyed five uplegs averaging massive 85.0% gains! This is a high-potential sector.
This GDX chart covering the past couple years or so helps frame this latest young gold-stock bull upleg in context. It includes gold stocks’ total gains and losses during recent uplegs and corrections, their defining trend lines, and catalytic events that ramped this sector’s volatility. GDX has made remarkable progress since late January despite some fierce headwinds, revealing traders finally warming back up to gold stocks.
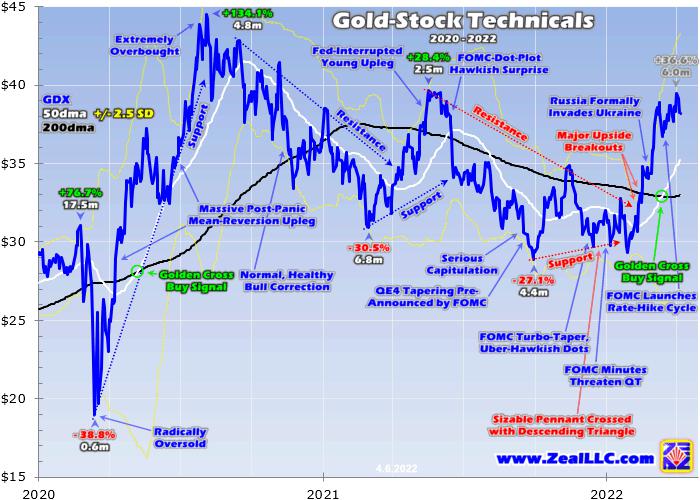
To help understand how awesome gold stocks are doing, some context is necessary. Last spring GDX started powering higher in a strong young upleg. But that was prematurely truncated by a big hawkish surprise in mid-June’s FOMC dot plot. Then top Fed officials first started predicting a couple of distant-future FFR hikes. That unleashed extreme gold-futures selling, battering gold and miners’ stocks sharply lower.
A subsequent relentless parade of Fed-hawkishness and economic data supporting it forced gold stocks into that last correction. But even after GDX fell too far too fast hitting deeply-oversold levels in late September, gold stocks had a tough time recovering. Psychology among contrarian traders interested in this small sector remained bearish. That compressed GDX into an important technical pattern rendered in red here.
It was something of a cross between a consolidating pennant formation similar to gold’s own gigantic one and a descending triangle. Gold stocks couldn’t break free from its upper resistance in this upleg’s early months into mid-November. That initial GDX surge also failed near its key 200-day moving average. Both convinced technically-oriented traders that gold stocks suffered insufficient upside momentum to buy.
But that finally changed in early February as gold’s own young-upleg gains started accelerating. GDX’s composition and weighting is dominated by major gold miners. Their stocks tend to amplify their metal’s material price moves by 2x to 3x, since their earnings are highly-levered to prevailing gold prices. Gold stocks usually follow gold higher whenever it enjoys sizable sustained gold-futures and/or investment buying.
It’s important to realize gold’s upleg was mounting well before Russia invaded Ukraine. Russian armor, artillery, and infantry didn’t first roll into Ukraine’s eastern Donbas region until early on February 22nd. And the formal invasion into other non-separatist-plagued areas of Ukraine didn’t start until overnight into February 24th. Before that most traders assumed Russia’s vast military buildup was just a negotiating tactic.
By late January the day before that QE-end-heralding FOMC meeting, gold closed near $1,848 which was up 7.1% since its last correction bottomed in late September. GDX had only rallied a pathetic 9.5% in that span, highlighting the festering bearish sentiment dogging this sector. That made for terrible 1.3x upside leverage, way too little to compensate traders for gold stocks’ big additional risks on top of gold’s.
By mid-February, when Russia-preparing-to-invade-Ukraine skepticism remained high, gold had surged back up to $1,899 for a 10.1% upleg-to-date gain. That was starting to thaw the pessimistic gold-stock psychology, helping drive up GDX to $34.79 for a parallel 20.3% rally that made for better 2.0x upside leverage to gold. This young gold-stock upleg was well-established and 4.6 months old before Russia invaded!
GDX achieved two major upside breakouts in the week before Vladimir Putin unleashed his geopolitical crisis upon the world. The upper-resistance line for this dominant gold-stock ETF’s big hybrid technical consolidation pattern was running near $32 into mid-February. GDX’s decisive 1%+ breakout above that arrived back on February 11th. That certainly piqued the interest of technically-oriented gold-stock traders.
They started buying to chase the gold miners’ mounting upside momentum, accelerating it to a second more-important breakout just a few trading days later on February 16th. That’s when GDX powered decisively above its 200dma, which was running $33.11. While chart-pattern trend lines are eyeballed and thus somewhat ambiguous, moving averages are mathematically-precise and easily-observable by everyone.
These crucial major upside breakouts had both happened by several trading days before Russia invaded. After the massive Russian military might arrayed around Ukraine’s borders breached them and stormed in, most traders and financial analysts were shocked. Putin wasn’t just saber-rattling to keep Ukraine from moving towards NATO, he wanted to decapitate Ukraine’s elected government and install a puppet one!
So surprised markets rushed to price in the huge implications of the biggest European war since World War II in the couple weeks after Russia formally invaded. Within that short post-invasion span the US flagship S&P 500 stock index plunged 4.9%, the US Dollar Index blasted up 3.3% on safe-haven buying, and US crude-oil prices skyrocketed 34.8% higher! Gold joined commodities’ massive geopolitical spike.
Within that same compressed span, gold soared 8.6% to $2,051 on massive gold-futures and investment buying! The gold stocks per GDX weakly amplified their metal’s huge gains, surging up 13.2% for 1.5x upside leverage. Upleg-to-date since late September, GDX had powered 33.4% higher to gold’s 18.9%, making for a better 1.8x. But geopolitical gold spikes are always risky, tending to soon symmetrically reverse.
I warned our weekly-newsletter subscribers about that in real-time on March 8th as gold euphoria soared with that lofty peak. With gold closing at $2,051, I wrote “Unfortunately gold is getting overbought after such a big, fast run.” Thus “the odds for an imminent sharp rebalancing selloff” were soaring. Indeed that massive gold geopolitical spike started collapsing the very next day, dragging down the miners’ stocks with it.
Big-and-fast rallies generate excessive greed sucking in too much capital too soon. That exhausts gold’s near-term buying firepower, leaving it at the mercy of sellers. Geopolitical spikes are the most fragile of such surges because they are headline-dependent. Whatever the crisis du jour happens to be, traders soon come to accept it moderating whatever fears it spawned. Their focuses soon shift back to other things.
And gold selling after sharp spikes soon cascades, due to the extreme leverage inherent in gold-futures trading. This week for example each contract controlling 100 ounces of gold worth $192,500 just required traders to keep $7,200 cash margins in their accounts. That enables exceedingly-risky leverage running up to 26.7x! Up there a mere 3.7% adverse gold move would wipe out 100% of speculators’ capital deployed.
Over just a week after its geopolitical spike topped, gold plunged a brutal 6.6% on heavy gold-futures selling! When gold-stock sentiment is bearish, GDX tends to amplify big gold drops closer to 3x. So the major gold stocks could’ve easily crashed close to 20% during that gold plummeting. Yet in a stunning testament to how much sector psychology had improved, GDX only lost a relatively-small 4.8% within that same span!
That made for extraordinarily-mild 0.7x downside leverage to gold, its miners’ stocks were showing amazing resilience. Gold stabilized near $1,916 after that big gold-futures selling abated. In the several weeks since then, the yellow metal has largely ground sideways on balance. It rallied as high as $1,962 later in March, but was quickly bashed back down near $1,920 a couple days later and again to $1,921 this week.
So gold’s upside momentum has almost totally stalled since its geopolitical spike pulled forward too much near-term demand. Normally that would poison sector sentiment enough to leave the gold stocks drifting lower or sideways at best. Yet GDX defied gold’s breather to continue powering higher on balance later in March into early April. On this month’s opening trading day, GDX surged 3.0% to a new upleg high of $39.49!
That came in 2.4% above where the major gold stocks traded at gold’s $2,051 geopolitical-spike topping. Yet gold itself was still down a big 6.2% from that peak! GDX’s full-upleg leverage had soared to 3.2x. Traders have continued to move capital into gold stocks on balance over the several weeks since gold crested. That proves sector psychology is really improving, with bullishness increasingly edging out bearishness.
GDX’s post-geopolitical-spike gains are even more remarkable considering the FOMC’s uber-hawkish meeting on March 16th. That day the Fed hiked its FFR for the first time since mid-December 2018, launching the 13th rate-hike cycle of this modern era since 1971! Even worse, top Fed officials’ dot-plot rate-hike outlook more than doubled from three quarter-point hikes in 2022 to an incredible seven this year!
Back in mid-June when that FOMC dot plot first changed from zero hikes forecast to maybe two way out in late 2023, GDX cratered 9.2% in just three trading days. Yet during the four starting with this latest far-more-hawkish mid-March FOMC decision, GDX actually rallied 3.4%! The Fed’s tyranny over gold-stock traders’ worldview has broken. Both technical and fundamental factors contributed to this pivotal sea-change.
One of the most-powerful buy signals in all of technical-analysis-dom is the legendary Golden Cross. It happens when a shorter moving average migrates back above a longer one during sizable rallies out of major lows. The classic golden cross is when a 50dma climbs back over a 200dma. Normally when this happens after a full-blown correction, it confirms a new bull-market upleg is indeed marching higher again.
GDX achieved this rare 50-200 golden cross on March 15th, fully a week after gold’s geopolitical spike peaked and the eve of that latest FOMC decision. While this leading gold-stock benchmark’s last golden cross soon fizzled after last June’s hawkish-dot-plot surprise, the prior one in early May 2020 confirmed a young gold-stock upleg that would ultimately mature to mammoth 134.1% GDX gains over just 4.8 months!
Traders really notice golden crosses, since most financial-charting websites and software throw in the widely-followed 50dmas and 200dmas by default. Speculators and investors just love chasing strong upside momentum, and 50-200 golden crosses are a high-probability signal that it will likely continue for some time. These strong gold-stock technicals were recently confirmed with even-stronger fundamentals.
The major gold miners dominating GDX recently finished reporting their Q4’21 operational and financial results in March. After every quarterly earnings season, I painstakingly analyze the reports from the top 25 GDX gold miners. The resulting GDX Q4’21 essay was published several weeks ago. A quick proxy for how the major gold miners are faring looks at their mining costs compared to prevailing gold prices.
Gold averaged $1,796 in Q4’21, while the GDX-top-25 gold miners reporting all-in sustaining costs were averaging $1,188 per ounce. That made for implied sector unit profits of $608 per ounce, which proved the seventh-highest on record behind only the preceding six quarters! Those earnings are understated too, as average AISCs were skewed high by a handful of outliers. AISCs should have moderated a bit in Q1’22.
Let’s assume they came in down a conservative 1% quarter-on-quarter to $1,175 last quarter. And due to gold’s mounting upleg, Q1’s average gold price blasted up 4.6% QoQ to $1,879! So that less projected $1,175 AISCs would yield GDX-top-25 Q1 implied unit earnings of $704 per ounce. That would make for a huge 15.8% QoQ surge, and tie Q3’21 for the sixth-highest ever seen. Gold-mining profits are big and growing.
Yet gold-stock prices remain fairly-low absolutely, and very-low relative to the fat earnings this industry is generating with these high prevailing gold prices. Even at April 1st’s latest interim high of $39.49, GDX is still 40.7% under its all-time high of $66.63 from way back in early-September 2011. Unfortunately that was years before I started my comprehensive quarterly analyses of GDX miners’ results 24 quarters ago.
But back in Q3’11 gold averaged $1,706, marking a mighty secular gold bull’s peaking seeing much-lower quarterly averages for years both before and after. So those big gold-mining profits were an anomaly, not sustained. Yet average gold prices during the last eight quarters including Q1’22 have run between $1,714 to $1,912. Those implied sector unit profits have stayed between $608 to $884 per ounce, super-high.
So the gold miners’ stocks have generally rarely if ever been as chronically-undervalued relative to their strong earnings as they are today. And gold itself is likely heading much higher too, driven by this raging inflation unleashed by the Fed’s epic money printing in recent years. Gold also has a many-decades-long history of rallying strongly through the exact spans of Fed-rate-hike cycles, which are bearish for stock markets.
In light of all this, today’s young gold-stock upleg with mere 36.6% gains at best so far is likely just getting started. Again GDX’s average upleg during today’s secular gold bull ran +85.0%. And this upleg’s setup is far better than most with radically-unprecedented money-supply growth fueling the worst inflation super-spikes since the 1970s and early 1980s. This gold-stock upleg ought to prove the best of their entire bull!
If you regularly enjoy my essays, please support our hard work! For decades we’ve published popular weekly and monthly newsletters focused on contrarian speculation and investment. These essays wouldn’t exist without that revenue. Our newsletters draw on my vast experience, knowledge, wisdom, and ongoing research to explain what’s going on in the markets, why, and how to trade them with specific stock
That holistic integrated contrarian approach has proven very successful. All 1,280 newsletter stock trades realized since 2001 averaged outstanding +20.7% annualized gains! Today our trading books are full of great fundamentally-superior mid-tier and junior gold and silver miners to ride their uplegs. These stocks have recently surged sharply, but still have massive room to run. Subscribe today and get smarter and richer!
The bottom line is this latest gold-stock upleg is mounting. This sector has continued powering higher on balance in recent weeks, despite gold consolidating lower after its Russia-Ukraine-invasion geopolitical spike peaked. The leading GDX gold-stock ETF had already achieved a pair of major decisive breakouts before that crisis. That strong upside momentum is shifting sentiment back to bullish, enticing in more traders.
With sector herd psychology improving, gold stocks are increasingly outperforming their metal again. And their growing gains are fully justified fundamentally. Gold miners continue to earn fat profits with these high prevailing gold prices. And gold’s own secular bull the gold stocks amplify is likely to keep generally marching higher for years on the Fed’s epic money printing. That gives gold stocks vast upside potential!
Read Full Story »»»
DiscoverGold
bought several million dollars of this yesterday, glad I did, as it is good to be first, as they say in boxing, be first always, and then when the retail and fund money comes, it will push you so much higher. I own this, gdxj, silj and very little any longer of X......I will buy back into x later.
Barrick Gold $GOLD 5.25 Million Share #darkpool prints at $24.90
By: Money Flow Mel | April 7, 2022
• $GOLD 5.25 million share #darkpool prints at $24.90.

Read Full Story »»»
DiscoverGold
Best Gold Mining Stocks To Buy Now
By: Vladimir Zernov | April 7, 2022
• Gold looks ready to get out of consolidation, which should provide support to gold mining stocks.
While gold continues consolidation in the $1915 – $1935 range and has good chances to develop additional upside momentum, it’s high time to take a look at the best gold mining stocks.
Barrick Gold
Shares of one of the leading gold miners, Barrick Gold, are already up by about 30% year-to-date, but they have a good chance to gain additional upside momentum in case gold moves out of the current trading range and heads towards the $2000 level.
Barrick Gold is expected to report earnings of $1.26 per share in 2022, so the stock is trading at 20 forward P/E, which looks reasonable for the current market environment.
Newmont Corporation
Newmontstock also had a successful year, which is not surprising for the gold mining stock with the biggest market capitalization in U.S. markets.
Smaller companies have faced various setbacks in recent years, so traders prefer to bet on big diversified companies. Trading at about 25 forward P/E, Newmont is not cheap, but the market is willing to pay a premium for the leading gold mining stock.
It is not clear whether the stock is ready for multiple expansion, but higher gold prices will drive earnings estimates higher and should provide support to the stock.
Agnico Eagle Mines
Here’s another gold mining stock which is not cheap but will have plenty of upside in case gold manages to get out of the current range and move closer to the $2000 level.
Agnico Eagle Mines is even more expensive than Barrick Gold and Newmont, but it will also benefit from the flow of funds into the segment as there is a limited number of big companies in the marketplace, and investors prefer to bet on strong names.
Read Full Story »»»
DiscoverGold
Providence Gold Mines start of a incredible year
CEO Ron Coombes Interviewed On The Market Harold- The Deal Room
Interview With Alex Jennings, Interview Starts At 5:55
Https://Providencegold.com/The-Market-Harold-The-Deal-Room-Interview-With-Alex-Jennings/
|
Followers
|
150
|
Posters
|
|
|
Posts (Today)
|
0
|
Posts (Total)
|
5580
|
|
Created
|
06/29/08
|
Type
|
Free
|
| Moderators DiscoverGold trunkmonk | |||

http://www.vaneck.com/index.cfm?cat=3192&tkr=GDX&LN=3-02
The Gold Miners ETF seeks to replicate as closely as possible, before fees and expenses, the price and yield performance of the NYSE Arca Gold Miners Index. The Index provides exposure to publicly traded companies worldwide involved primarily in the mining for gold, representing a diversified blend of small-, mid- and large-capitalization stocks. As such, the Fund is subject to the risks of investing in this sector.
| ||||||||||||||||||||||||||||||||||||||||||||||||||||||||||||||||||||||||||||||||||||||||||||||||||||||
| DAILY |
| WEEKLY |
| Volume | |
| Day Range: | |
| Bid Price | |
| Ask Price | |
| Last Trade Time: |


