 News
News  Market Data
  Discover
Support: 888-992-3836
Copyright © 2023 InvestorsHub Inc.


Register for free to join our community of investors and share your ideas. You will also get access to streaming quotes, interactive charts, trades, portfolio, live options flow and more tools.
Gas went up another 10 cents around here. I found a station that hadn't increased yet and gassed up tonight instead of tomorrow. I felt like I had "saved" a buck and a half so I bought myself a treat on the way home.
#3 on the fact list. Gas is almost $6 a gallon right now in some places in the US :
#8 and #14 are mind blowing
http://theeconomiccollapseblog.com/archives/55-interesting-facts-about-the-u-s-economy-in-2012
That's too bad. The only problem with listening exclusively to views that agree with one already held, is you never learn anything.
It's true, usually you just hear the same old jargon, but sometimes there's something really useful or helpful that comes from it.
That GSS Golden Star Resources Ltd. http://www.gsr.com/ is a good example. They sound pretty darn good.
I don't always agree with that poster's methodology but that doesn't mean he can't find a great pick.
If I was a pussy or had a thin skin I never would have heard about it!
That fellow has never posted on this board, to the best of my knowlege.
And nobody is dissing charts here. What some of us have been saying is Bernanke is negating any chart you can put out there.
Jim Sinclair - 1980 Was a Warmup, Gold to Range $400 a Day
Today legendary trader and investor Jim Sinclair told King World News that movements in gold will become so violent that gold will become untradable to individuals. Sinclair also said that gold will be the last great bubble as it goes into a geometric uptrend. Here is what Sinclair had to say about what we can expect to see going forward: “Liquidity, it’s as simple as that. All of this is the event that’s taken place many times in history. Many times in history there has been an inflation caused by volatility in currencies called currency induced cost push inflation.”
“The younger generation has no concept of this. They look at inflation as ebullient business and they look at deflation as being a breadline. They don’t recognize that during a period of extremely difficult business conditions, (you see) some of the highest rates of inflation.
It’s a question of whether our indicators will ever show inflation again. But the truth is if you go back to how the inflation was calculated in the 1970s, you get a good look at what’s going on right now....
“This great kick of the can down the road will only be cured by a commodity currency. That’s how it’s been cured all throughout history and that’s how it will be cured this time. 1980 was a dress rehearsal. This time gold is going into the system.
The last man standing will be the standard that will hold the currency and correct the problem, that’s gold. That is the only investment that will make it through this turbulent period, regardless of how volatile it may become.
We opened up the week in which the price of gold has changed $60. But we’ve been changing to $60 during a day’s session. There will be times when it will be in the hundreds (of dollars) during the session. You will easily see a $400 (range in gold) in a day, there is no question about it.
Back in 1980 we had days where gold moved $150. What do you think is about to happen if what we’ve just been through is the beginning of a geometric uptrend? Gold will be untradable to the individual.
There’s no question that every market, prior to reaching maximum valuation will take on a characteristic. That characteristic we’ve defined as a ‘Rhino Horn.‘ There has been no such event in the gold market and in the gold share market even less so.
There is no evidence of a top. Before this market is over, we will see what we’ve seen in all markets that go into it. The last great bubble which will not break is gold.”
Eric King
KingWorldNews.com
http://kingworldnews.com/kingworldnews/KWN_DailyWeb/Entries/2012/2/23_Jim_Sinclair_-_1980_Was_a_Warmup%2C_Gold_to_Range_%24400_a_Day.html
This poster has posted some nice charts on the new CS board
http://investorshub.advfn.com/boards/board.aspx?board_id=23176
He wrote:
No haven't seen him over there, almost no traders in residence with nary a murmer of debate. I still bump up a few trades there when I'm in the mood but as I said today there ain't much point in talking to oneself. The gold board on IH is frequented by a few who say technicals have no place or value so I'll either stop posting or look for pastures new. Yep - I keep one eye on a few folks over here as and when.
AGCZ--big volume breakout today. They have bonanza-grade gold and are producing...
Goldline agrees to pay refunds to ex-customers.
2/23/2012
Santa Monica, California, precious metals dealer, Goldline International Inc. one of the nation's largest gold retailers, as resolved a criminal prosecution by agreeing to refund as much as $4.5 million to former customers.
Goldline agreed to an injunction that requires the company to "change its unfair sales practices" and to disclose price markups in recorded telephone conversations with customers.
The Santa Monica city attorney filed a 19 count criminal complaint in November against Goldline, accusing the company of running a "bait and switch" operation in which customers seeking to invest in gold bullion were instead sold gold coins that were marked up more than 50%. Six current and former employees were also charged.
Goldline has used radio talk show host Glenn Beck as a pitchman.
The agreement calls for a third party to monitor the injunction and make sure the company is disclosing the markups, through undercover buys, recorded telephone calls, and meeting with employees.
stuart.pfeifer@latimes,com
GSS (The dog wakes up)
Reports Q4 (Dec) earnings of $0.03 per share, $0.03 better than the Capital IQ Consensus Estimate of ($0.00); revenues rose 12.6% year/year to $118.8 mln vs the $118.54 mln consensus. Co is forecasting a 16-23% increase in gold production in 2012. The co expects total gold production to be in the range of 350,000-370,000 ounces, up from 301,000 ounces in 2011. Production at Bogoso/Prestea is expected to increase by 49-60% year-over-year, more than offsetting the expected decline at Wassa/HBB. Production from the oxide section at Bogoso/Prestea is expected to range from 60,000-70,000 ounces and the sulfide section from 150,000-155,000 ounces. Wassa is expected to produce 140,000-145,000 ounces.
Gold Miners Losing Capital to ETFs By Liezel Hill
Feb 23, 2012 1:42 AM PT
Feb. 16 (Bloomberg) -- Aaron Regent, chief executive officer of Barrick Gold Corp., talks about the outlook for the gold industry and production strategy. Barrick speaks on Bloomberg Television’s “InBusiness With Margaret Brennan.” (Source: Bloomberg)
.
Barrick Gold Corp. (ABX) and Goldcorp Inc. (G), the world’s largest producers of the metal, are poised to outperform bullion after gold-mining companies fell to their cheapest in at least a decade, executives said.
[/b]Gold producers are heading for an “inflection point” triggering a rally, Barrick Chief Executive Officer Aaron Regent said in an interview. They have been punished as investors decided the shares should no longer trade as a proxy for physical gold, he said.
The growing popularity of gold-backed exchange traded funds, or ETFs, which include the $73.3 billion SPDR Gold Trust, probably have taken away some of the capital that previously was invested in companies such as Toronto-based Barrick, Regent said. Investors have shunned gold producers choosing instead to hold physical metal and ETFs after gold prices advanced in 11 successive years and touched a record in September.
The NYSE Arca Gold BUGS Index (HUI), which includes Barrick and 16 of its competitors, has advanced 53 percent in the past five years while spot gold traded in London has more than doubled. The index trades at about 17 times earnings, compared with an average of 65 over the past 10 years. The ratio fell to a decade low of 15 on Jan. 20.
“There will be a point where the multiples just converge with every other company,” Regent said Feb. 16 at Bloomberg News’s Toronto bureau. “Then you will start to see potentially increased leverage in the share price versus a gold price move.”
‘Investors Puzzled’
Holdings (.GLDTONS) of physical gold via ETFs have more than tripled in the last five years to 2,390 metric tons, an amount valued at about $137 billion, according to data compiled by Bloomberg. While such funds seek to track the price of gold, shareholders of gold producers may suffer the effects of mining accidents, cost overruns or asset writedowns.
Gold ETFs have “been a huge hoover of capital and competition for the gold companies,” Peter Miller, BMO Capital Markets’ head of equity capital markets in Canada, said in a Feb. 17 telephone interview. “It’s easy just to park yourself with an ETF versus taking on the capex creep and the operational risk of some of these development plays.”
Paulson & Co., the $23 billion hedge fund founded by John Paulson, said in its year-end letter that “investors remain puzzled” by gold stocks’ underperformance relative to gold. One likely explanation is concern that gold prices may decline, said Paulson, which is bullish on the metal.
Currency-Devaluation Play
Quantitative easing in the U.S. and other countries will lead to inflation, spurring more demand for gold as a hedge, the fund said in the letter, which was obtained by Bloomberg News. New York-based Paulson invests in the SPDR Gold Trust (GLD) as well as mining companies. The fund owned 12 percent of South Africa’s AngloGold Ashanti Ltd. (ANG) as of May 30 and 8.3 percent of Vancouver-based NovaGold Resources Inc. (NG) at Dec. 31, according to data compiled by Bloomberg.
Gold for immediate delivery gained 0.2 percent to $1,780.07 an ounce by 9:40 a.m. in London. It’s up 14 percent this year and reached a record $1,921.15 on Sept. 6.
While declining to give a specific estimate, Regent said he expects gold prices will surpass last year’s record.
“If fiat currencies continue to be devalued and gold just holds its value, on a relative basis it’s going to go up,” he said.
Rising Costs
Another reason for producers’ underperformance is that they’re valued by analysts and investors who assume a long-term gold price of about $1,300 an ounce, he said. Gold will average $1,798 in 2012 and $1,975 in 2013, according to the average of analysts’ estimates compiled by Bloomberg.
“There’s quite a significant gap between how the world’s traders see the gold price and how equity analysts, with their conservative forecasts, are looking at it,” Tye Burt, CEO of Kinross Gold Corp. (K), Canada’s third-largest producer, said in a Feb. 15 interview.
While investors are concerned that rising production costs in the industry will squeeze profit margins, gold-mining equities will “ultimately outperform, given the leverage in gold producers relative to the gold price,” Burt said.
Barrick, Kinross and Canada’s Goldcorp all forecast mining costs will increase in 2012 as labor, raw-material and equipment expenses keep rising. Another factor boosting costs is producers’ extraction of lower-grade ore that wouldn’t have been profitable when gold was cheaper, Regent said.
Dividend Increases
Gold producers’ valuations will be helped by higher dividend yields, said Sean Boyd, CEO of Toronto-based Agnico- Eagle Mines Ltd.
“We really need to attract a broader range of investors,” Boyd said in a Feb. 16 interview. “I think the industry can capture those investors if it shows discipline around capital spending and paying a bigger dividend yield.”
Agnico and Kinross said Feb. 15 they will increase their payouts to investors. Barrick, Goldcorp and AngloGold have also announced dividend increases in the past year. Newmont Mining Corp. (NEM), the second-biggest gold miner by sales, said yesterday it’s more than doubling its quarterly dividend, 10 months after announcing it would link payments to the gold price.
Such payouts are becoming increasingly important for gold miners, Donald Coxe, a Bank of Montreal strategy adviser, said in a Feb. 21 interview.
Premium Eroded
“While they’re waiting for the market to recognize the intrinsic value of these wonderful corporations, why don’t you pay them some money?” he said.
Still, even if gold producers outperform the metal, they may never fully recapture their old valuations, said David Christensen, CEO of ASA Ltd. in San Mateo, California, which manages $600 million.
“The ‘traditional’ premium has probably flown the coup,” Christensen said by e-mail. “There are just too many alternatives to buying gold shares today, such as ETF products, that have eroded the premium multiples.”
Barrick said Feb. 16 its fourth-quarter net income was little changed at $959 million. Sales advanced 26 percent to $3.79 billion, outpacing its so-called total cash costs, which rose 15 percent to $505 an ounce. Gold, which has gained for 11 straight years, averaged $1,687 an ounce in the fourth-quarter in New York, 23 percent more than a year earlier.
Goldcorp, the world’s second-largest producer by market value, has seen its cash flow more than double in the last three years, CEO Chuck Jeannes said in a Feb. 15 interview. The shares have risen 23 percent in the same period.
“That I don’t think is a sustainable trend,” Jeannes said. “At some point we become so inexpensive on a cash flow per share multiple that it makes no sense for buyers not to acquire the stock.”
To contact the reporter on this story: Liezel Hill in Toronto at lhill30@bloomberg.net
http://www.bloomberg.com/news/2012-02-23/barrick-s-regent-says-gold-miners-losing-capital-to-etfs.html
well then load up buddy!
FDCFF Forum Uranium Corp. (.08) A Canadian-based energy Company with a focus on the acquisition, exploration and development of Rare earth projects and Uranium projects in the Athabasca Basin, Saskatchewan and the Thelon Basin, Nunavut. Forum has forged joint venture and other strategic relationships with mining notables such as Agnico-Eagle, Cameco, and Rio Tinto. Forum has interests and options on over 260,000 hectares of strategic uranium and REE exploration properties.
Website: http://www.forumuranium.com/s/Home.asp
TSX as FDC: http://tmx.quotemedia.com/quote.php?qm_symbol=FDC
Pinksheets: http://www.otcmarkets.com/stock/FDCFF/quote
IHUB: http://investorshub.advfn.com/boards/board.aspx?board_id=10014
Forum Identifies Heavy Rare Earth Potential on the Kipawa West Project
http://www.otcmarkets.com/stock/FDCFF/news
Forum Uranium Receives Encouraging Drill Results on Inuit Owned Lands Nearby the Kiggavik Deposits-North Thelon Project, Nunavut
http://finance.yahoo.com/news/Forum-Receives-Encouraging-ccn-7753147.html?x=0
mg]stockcharts.com/c-sc/sc?s=fdc.v&p=d&yr=1&mn=0&dy=0&id=p20250978534[/img]
You might keep hearing it for a while still... Who knows? Then one day you look back in hindsight and say, "That was pretty obvious" Same thing happened when gold was in that $270 zone and all you heard from the gold bugs over and over for a long time was, "this has got to be the bottom!", those that look back today saying same thing...."that was obvious too."
Looking forward to seeing some prosecutions! The wonder is that it hasn't happened already.
I keep hearing that but I don't see it actually happen! Why is HL down 2% on gold/silver day like this??? Makes no sense.
Forum Uranium Receives Encouraging Drill Results on Its Agnico-Eagle Option Nearby the Kiggavik Deposits-North Thelon Project, Nunavut
VANCOUVER, BRITISH COLUMBIA--(Marketwire -02/22/12)- Forum Uranium Corp. (TSX-V:FDC.V; OTC:FDCFF - News) is pleased to announce drill results on property held under option from Agnico-Eagle Mines Ltd. on Forum's district-scale North Thelon project adjoining Areva Resources Canada's Kiggavik uranium deposits. Forum drilled nine holes totaling 2,036 metres on uranium targets identified by its regional geological, geophysical and geochemical programs conducted over the past five field seasons. Encouraging drill results have been received from DDH JD-01 and JD-02 on the Judge Sissons claims under option from Agnico-Eagle. These lie to the east of Areva's Kiggavik deposits near the prolific Andrew Lake Fault which controls Areva's End and Andrew Lake deposits and recent discoveries by Cameco.
Rick Mazur, President & CEO, stated: "Our 2011 drill program has provided Forum with three strong targets for follow-up drilling in 2012- Tarzan, BL-32 and Judge. Areva's Kiggavik deposits, Cameco's recent discoveries and Forum's newly identified drill targets demonstrate the world class nature of this emerging uranium mining camp. Forum is in the unique position of exploring strategic ground in the company of two of the largest uranium companies, Areva and Cameco."
Holes JD-01 and 02 were drilled in the Judge area located on a fault parallel to the Andrew Lake Fault, the structure that controls most of the known mineralization in the area. The Judge area lies to the east of Areva's Andrew Lake and End deposits on a very strong gravity low. The two drill-holes intersected metasediments (the rock type that hosts the Kiggavik deposits and Cameco's showings) throughout both holes. The metasediments are strongly to extremely hematized and bleached with extensive quartz brecciation (similar to the local showings and deposits) and chloritized at the bottom of the hole, intersecting a redox front. Geochemistry returned uranium values of 20ppm over 12.5 metres, 512ppm boron over 102 metres and 115ppm nickel over 54 metres in JD-01, and 16ppm uranium over 10 metres, 362ppm boron over 161 metres and 115ppm nickel over 54 metres in JD-02. These geochemical results are highly encouraging indications of a substantial uranium mineralizing system.
Areva has completed an initial feasibility study and submitted its Environmental Assessment Study to the Nunavut Impact Review Board for the development of an 8 million pound per year uranium mine, and Cameco has intersected uranium with grades of up to 3.52% U3O8 over 10 metres along the Andrew Lake Fault.(Cameco presentations at the 2011 Nunavut Mining Symposium and the 2011 Saskatchewan Mining Open House).
About the North Thelon Project
Forum acquired a large (greater than 400,000 acres), strategic land position surrounding the Areva/Japan Canada Uranium (JCU)/Daewoo world-class Kiggavik mine development project in Nunavut starting in 2006. Forum owns 100% interests in mineral claims, subject to a 2% NSR on the Tarzan and Nutaaq claims to Nunavut Tunngavik Incorporated, acquired the rights to earn 100% interest in Inuit owned land parcels BL-21 and BL-32 from Nunavut Tunngavik Incorporated and acquired the rights to earn up to a 65% interest in claims held by Agnico-Eagle Mines Ltd. The 127 million pound Kiggavik uranium project grading 0.55% U3O8 has completed an initial feasibility study, commenced permitting and submitted an Environmental Assessment Study to the Nunavut Impact Review Board. The proposed mine anticipates production of approximately 8 million pounds of uranium per year. Cameco has been actively exploring its property to the west of Areva since 2005 and has announced three discoveries. Cameco and Areva continue to aggressively drill in this newly emerging mining camp.
To view Figure 1, please visit the following link: http://media3.marketwire.com/docs/Forum-0222-fig1.pdf
Ken Wheatley, P.Geo. (Saskatchewan and Nunavut), Forum's Vice President of Exploration and qualified person has reviewed the contents of this news release.
About Forum Uranium
Forum Uranium Corp. is a Canadian-based energy company with a focus on the acquisition, exploration and development of Canadian uranium and rare earth projects. Forum has assembled a highly experienced team of exploration professionals with a track record of mine discoveries for unconformity-style uranium deposits in Canada. The Company has a strategy to discover near surface uranium deposits nearby existing infrastructure by exploring on its 100% owned properties and through strategic partnerships and joint ventures. Website: http://www.forumuranium.com
ON BEHALF OF THE BOARD
Richard J. Mazur,
P.Geo., President & CEO
Contact:
Forum Uranium Corp.
Matt Terriss
Director, Corporate Affairs
604-638-3947
info@forumuranium.com
http://finance.yahoo.com/news/Forum-Receives-Encouraging-ccn-7753147.html?x=0
War with Iran: Focusing on the end-game
http://www.aljazeera.com/indepth/opinion/2012/02/201222072746430386.html
Tick tock, they should turn green soon...
Gold up. Miners down. Gee, what a shocker. lol
Posted by thegoldspeculator: Charting Gold
By Scott Silva
Feb 22 2012 3:26PM
http://www.thegoldspeculatorllc.com
http://www.kitco.com/ind/Silva/feb222012A.html
The charts are displaying new strength in gold and silver. We will see new highs in gold and silver this year. It’s not too late to buy the precious metals at bargain prices.
Technical analysis is a powerful tool for understanding the market for a traded good. Technical analysis employs time-tested techniques for predicting future price levels. The successful technical trader uses a combination of indicators to support the decision to take a long or short position in a given commodity. The planets are lining up in favor of another leg up in gold and silver. Let’s examine what the charts are telling us about gold today.
First, gold has broken out of a bullish falling wedge chart pattern dating back to September 2011.
The falling wedge pattern can be a continuation or a reversal pattern. It this case, it is a reversal pattern, signaling a reversal of an intermediate bearish trend. The falling wedge is a bullish pattern that begins wide at the top and narrows as prices gradually move lower. This price action forms an extended cone shape that slopes down as the reaction highs and reaction lows converge. The pattern is defined by the down-sloping upper resistance line and the lower, converging base support line. The bullish breakout occurs when price action closes above the resistance line (upper descending tend line) with confirming volume. The point count for the pattern is calculated by adding the magnitude at the widest span to the price at breakout.

We can see the falling wedge reversal pattern in the daily basis chart for April COMEX gold above. The intermediate bearish trend began in early September 2011. The price at the break above the resistance line was 1674.40. The point count is 321 which sets the price target at $1995/oz. The breakout is confirmed by significant volume at the breakout day, January 25th.
We can see the same breakout in gold using Ichimoku Kinko Hyo indicators.

Here we see spot gold on a daily basis with Ichimoku indicators. The January 25 breakout above resistance on higher volume is highlighted in the oval. Today’s chart shows all Ichimoku indicators are bullish for gold. Price action is above the cloud, which is bullish. The Tenkan Sen made a bullish cross (from below) the Kijun Sen back on January 17th. The projected cloud is bullish (shaded green). And the Chikou Span is well above price action and above the cloud, which is a strong bullish signal.
Silver is displaying similar bullish patterns and indicators. So are selected gold and silver stocks.
Now is the time to own gold and silver.
Investors from around the world benefit from timely market analysis on gold and silver and portfolio recommendations contained in The Gold Speculator investment newsletter, which is based on the principles of free markets, private property, sound money and Austrian School economics.
By Scott Silva
Editor, The Gold Speculator
2-22-12
Lake Shore Gold Corp (LSG) fiat$1.69 UP $0.18 +11.92% 
Volume: 8,213,200 @ 2:36:49 PM ET strong demand
Bid Ask Day's Range
1.68 1.69 1.5 - 1.73
TSE:LSG Detailed Quote Wiki
http://investorshub.advfn.com/boards/read_msg.aspx?message_id=72427806
http://www.lsgold.com/
http://investorshub.advfn.com/boards/read_msg.aspx?message_id=72168809
God Bless
Companies With Mineable Ounces Soundest Investment For Coming Volatility By Jim Sinclair
* Wednesday, February 22, 2012 
My Dear Friends,
Today was long and enlightening for me. I made multiple meetings in New York City with significant money managers.
During these meeting the price of gold rose above the $1764 level which I have repeatedly told you is as important as $524.90 was when gold broke out of its arithmetic up trend and entered its first power up trend. I wish to remind you $1764 is the point where gold moves out of its power up trend and enters into its geometric uptrend. I have also assured you the central banks and especially the US Fed via the BIS and Exchange Stabilization Fund seek not to depress gold, but only to prevent it from running so hard on the upside as to expose the true condition of Western world finance.
There has been significant interventions in the gold price at Angel $1764 with unexpected other central bank accumulation resulting in inexplicable strength in the $1710-$1720 area.
As the strong dollar policy is clearly a policy of softening a long term decline, the interventions in gold have been to modify a desire in the market itself to go ballistic on the upside.
If there was any startling realization today it was that among true geniuses and maturity in major money managers there is a grave lack of understanding concerning the forces at work in the financial can kick of the century now about to take place.
Only one person today knows that the war with Iran starts when Iran is frozen out of the Swift system. In terms of finance, that is a nuclear attack. It was just that threat alone that made Swiss banks destroy their tradition of privacy and send their loyal clients to a mass execution, assuming that they were cheating on taxes.
Not one person I spoke to today ever asked themselves who determines if credit event is a default and what that means to the mountain of credit default swaps that US banks have vended via their non US subsidiaries. By this method the count of these OTC derivatives by the US Controller of the Currency is way short of the true amount of debt insurance banks have sold.
Only one man understood what a commodity currency was and had studied where currency induced cost push inflation had produced severe price inflation during periods of awful economic conditions brought on by all types of debt failure.
I am speaking with leaders in finance who control immense sums of money. If these people do not understand the forces at work what makes you think politicians or their college professor appointees to central banks have a better understanding? The answer is simple – they do not!
Let me share with you the conclusion I took away from today’s luncheon.
1. What is going to happen is going to take place in March somewhere between the 14th and 20th in all probability.
2. What will determine the fate of markets is what action China does or does not take in providing funds to IMF bailout funds.
3. I believe China can and will extract significant trade and other benefits for their presence.
4. I believe China will want the same immunity that the IMF just took for themselves on sovereign debt in liquidation.
5. Greek gold will be held hostage to their debt.
6. That will accelerate the modest trend of repatriation of gold for the cellar of the New York Fed to nations like Germany that are certainly able to store their own wealth.
7. There will be an acceleration in the trend of utilization of other currencies than the dollar for contracting internationally regarding goods, service, oil and minerals.
8. I do not agree that we are at the doorstep now of major changes in the international monetary system. That comes in June of 2015.
9. I am certain that we are on the immediate threshold of the monster kick of the financial can down the road that is a dead end.
10. I believe China and the US Fed will assist in that great last can kick that backfires.
11. I am certain that I am in the right business and that business is the identification and accumulation of gold as gold is the ultimate survivor of what is about to happen.
12. I am certain the gold industry is mad as a Danbury hatter in selling their product the moment they produce it.
13. I am certain the gold and silver industry is in a transition back to the dividend producers they once were.
14. I am certain that the volatility in gold, silver and equities we have already seen is nothing compared to what is about to happen.
15. The last man standing among asset categories as the new monetary system is introduced sometime post June of 2015 will be gold and gold alone.
Therefore the soundest investment now is what I, and others (McEwen) are doing in building companies whose inventories of goods to be sold are mineable ounces of gold and other precious metals in the ground moving towards production.
The immense shorts in this industry group are whacked out noobies without a clue.
New mines need never pollute. Old mines can never be cleaned up. Open pit and surface enrichment is the type of gold that will be least effected by rising costs.
Respectfully,
Jim
http://www.jsmineset.com/2012/02/22/companies-with-mineable-ounces-soundest-investment-for-coming-volatility/
George.
Click on "In reply to", for Authors past commentaries.
Stonecap Securities ups Aurcana target price to $1.20 as La Negra expansion on track
by Joyanta Acharjee
10:16 am Feb. 22, 2012

Stonecap Securities Wednesday increased its price target on Aurcana (CVE:AUN) to $1.20 from $1.10 after the junior miner raised its ownership in the Mexican La Negra mine to 99.86 percent.
Aurcana is a silver explorer with interests in the Shafter silver mine in Texas as well as La Negra. Its partner in La Negra has been diluted down to a 0.14 percent ownership interest.
The company's management has confirmed that the mill expansion plan for La Negra is on track and almost complete, with a target date of the first week of March for completion.
In a research note, Stonecap analyst Christos Doulis said: "Aurcana is poised to enter the ranks of mid-tier silver producers in 2012. While we have now factored in the mill expansion at La Negra, the company’s expansion plans at Shafter could increase production beyond our current forecasts."
Aurcana's previous successful expansion at La Negra to 1,500 tonnes per day (tpd) and Stonecap's recent dialogue with management has increased confidence that the expansion to 2,500 tpd capacity at La Negra is on track, and should result in an average throughput rate for the mine of 2,000 tpd in 2012 and 2,500 tpd, thereafter, the capital markets firm said.
Aurcana's recent marketing efforts have focused on the expansion scenarios for both La Negra and Shafter, Stonecap said.
"While we are taking a more cautious view with Shafter (given that it has yet to be commissioned) and are maintaining our 1,500 stpd life-of-mine throughput rate assumption for the operation, successful implementation of the company's expansion plans at Shafter could increase production significantly beyond our current forecasts," Stonecap's Doulis said.
http://www.proactiveinvestors.com/companies/news/25284/stonecap-securities-ups-aurcana-target-price-to-120-as-la-negra-expansion-on-track-25284.html
Caledonia Mining Corporation (CALVF) Insider is big buyer -

http://canadianinsider.com/node/7?menu_tickersearch=CAL+%7C+Caledonia+Mining
Latest 10 SEDI filings (by transaction date) for CAL within the last 6 months [?]
Amended Filing
As of 11:59pm ET February 21st, 2012
Filing
Date Transaction
Date Insider Name Ownership
Type Securities Nature of transaction # or value acquired or disposed of Unit
Price
Jan 20/12 Jan 17/12 Inwentash, Sheldon Control or Direction Common Shares 10 -
Acquisition in the public market 242,000 $0.120
Jan 20/12 Jan 16/12 Inwentash, Sheldon Control or Direction Common Shares 10 -
Acquisition in the public market 252,000 $0.120
Jan 16/12 Jan 13/12 Inwentash, Sheldon Control or Direction Common Shares 10 -
Acquisition in the public market 107,500 $0.110
Jan 13/12 Jan 12/12 Inwentash, Sheldon Control or Direction Common Shares 10 -
Acquisition in the public market 148,500 $0.110
Jan 11/12 Jan 9/12 Inwentash, Sheldon Control or Direction Common Shares 10 -
Acquisition in the public market 150,000 $0.100
Jan 10/12 Jan 6/12 Inwentash, Sheldon Control or Direction Common Shares 10 -
Acquisition in the public market 600,000 $0.934
Dec 8/11 Dec 6/11 Inwentash, Sheldon Control or Direction Common Shares 10 -
Acquisition in the public market 12,500 $0.110
Dec 7/11 Dec 5/11 Inwentash, Sheldon Control or Direction Common Shares 10 -
Acquisition in the public market 35,000 $0.110
Dec 6/11 Dec 2/11 Inwentash, Sheldon Control or Direction Common Shares 10 -
Acquisition in the public market 148,500 $0.110
Dec 5/11 Dec 1/11 Inwentash, Sheldon Control or Direction Common Shares 10 -
Acquisition in the public market 33,000 $0.110
Sign up for an account or login above to see all SEDI filings within the past 6 months.
Caledonia Mining Corp. should start a buy back their own shares
program -
CALVF Long TEAM should e-mail to tell them BUY BACK CALVF
biggest global Gold producing strategic Au bargain -
to make it great for all LONG TEAM SHAREOLDERS!
Caledonia Mining Corporation -
E.g.,
Will Caledonia Strike A Fair Compromise With Zimbabwe For Indigenisation? -
history often repeat itself -
http://www.marketbust.com/2012/01/caledonia-mining-corporation-will.html
Caledonia signs Memorandum of Understanding with the Government
of Zimbabwe relating to the Indigenisation of
the Blanket Mine -

http://investorshub.advfn.com/boards/read_msg.aspx?message_id=72322960


God Bless
Moneta adopts shareholder rights plan following news of 3.14 m oz gold resource -
![]()
http://tmx.quotemedia.com/article.php?newsid=47763060&qm_symbol=ME
http://investorshub.advfn.com/boards/read_msg.aspx?message_id=72359774
http://investorshub.advfn.com/boards/read_msg.aspx?message_id=72409352

Moneta Porcupine Mines Inc (TSE:ME) CORPORATE PRESENTATION -
February 2012
http://www.monetaporcupine.com/i/pdf/MONETA_FEB_2012.pdf
http://www.monetaporcupine.com
God Bless
Silver to Reach $489/oz by 2016:
And on significant volume increase, too.
We'll break $1800 by summer.
looks like a cobra rearing up....

Gold breaks this years high today with $1769.30 as of this moment.
Almost a double just today. I still have a consolation prize, but I missed the really big money by selling most of my shares too soon. But how can you predict such things...many of the pinks and OTC miners behave irrationally. I have some good ones that are producing that won't move, and others will move on smoke and mirrors.
The Next Move for Gold to Set New All-Time Highs This Year is Days Away
By Barry Stuppler
Feb 21 2012 4:28PM
I believe that all the elements are now in place for a Gold break-out move from the current $1700/$1760 trading range. This move will happen very soon. There will be a short pause when it breaks into the $1,800 level, and then we are heading for new highs before the summer.
What are the key elements to the coming gold move?
1) More Global Quantitative Easing (monetary stimulus) is on the way
Both Great Britain and Japan have recently announced massive increases in monetary stimulus programs. The Eurozone countries have currently given problem banks that are holding sovereign debt massive injections of euros, and are also preparing massive amounts of monetary assistance for Greece, Spain, Italy, and Portugal. While in the U.S., more than a majority of Federal Reserve Open Market Committee Governors favor another round of monetary stimulus (QE3) to keep our economic recovery on course within the United States.
Over the weekend, China cut its required bank reserve ratios, joining a number of central banks in relaxing monetary policies to promote economic growth. Greece’s current debt crisis was dealt with on Tuesday morning as Euro zone finance ministers agreed to the 130-billion-euro ($172 billion) Greek rescue package.
Governments are loosening bank reserve requirements to make lending easier, as well as printing trillions of Dollars, Euros, and Yen to pay down debt and stimulate economies, driving down the value of paper money versus gold.
2) Investment demand for Gold is increasing from Central Banks and the public.
2011 was a record year for physical demand for gold investment products and that demand escalated more and more as we approached year end.
Global demand for gold in 2011 rose to 4,067.1 tonnes, worth an estimated US$205.5 billion - the first time that global demand exceeded US$200 billion and the highest tonnage level since 1997, according to the World Gold Council's Gold Demand Trends. Of the total 4,067 tonnes 2011 world gold demand, 1,703 tonnes (41.8%) came from China and India. Last week the World Gold Council (WGC) provided details on the 2011 World’s demand from Central Banks Gold purchases. In their report, the WGC disclosed that the World’s Central Banks purchased 440 tonnes of Gold in 2011, a 471% increase from a record high of 77 metric tonnes in 2010.
Physical demand for coins is now outpacing jewelry demand and many countries are seeing dramatic growth in public buying of gold sovereigns and popular European and U.S. gold coins.
3) The perception of Gold as a mainstream investment has changed.
10 years ago, investors would buy gold as a potential inflation hedge or for asset diversification. Only a small group of U.S. financial planners and money managers (less than 5%) would even consider gold as part of an investment strategy, as it was called a non-productive assets class. The few financial advisors that did allow gold into an investment portfolio would limit it to only 5-10%.
Now, high profile investment advisors (Soros, Paulson, and others) proudly share their gold investments. Gold is now in the mainstream media,with its daily price broadcast on major radio and T.V. stations.
Gold is now considered as a hedge against debasing currencies.More and more financial advisors and money managers that I work with are recommending gold and silver as part of a balanced investment portfolio with a range from 15 to 25% commitment. Many financial professionals now feel that with a consistent 10 year track record of appreciation, the risk element for gold investments has been minimized.
Fourteen out of our fifty States have passed (or have pending) legislation that allows gold and silver coins to be used as currency in commerce transactions. Both houses of Congress have proposed legislation that would re-introduce a gold standard.
4) Low global interest rates on bank CD’s, Corporate, and Government Debt
Global interest rates have fallen to 20 year lows in Europe, Asia, and the United States.
Earning a fixed return of less than 2% on a multi-year AA government debt, versus an average return on gold over the past 10 year of 20%, gives gold the advantage for income focused investors. Plus, the U.S. Federal Reserve has virtually guaranteed that interest rates will remain low for the next two years.
By Barry Stuppler
Feb. 21st 2012
http://www.kitco.com/ind/Stuppler/feb212012.html
That thing reminds me of GSPG a few years ago. It turned 1,000 in to 10,000. I have to stop watching GDSM. It makes me sick that I didn't catch it.
GDSM--sold most of my shares way too soon. If only all miners had pops like that one...
Bravo Gold Corp.: Airborne Geophysical Survey Delineates 2012 Exploration Targets at Kinskuch Project
VANCOUVER, BRITISH COLUMBIA--(Marketwire - Feb. 21, 2012) - Bravo Gold Corp. (TSX VENTURE:BVG.V; OTC:BVGIF - News)(FRANKFURT:B6I.F - News) ("Bravo") has received final results from the 2011 Airborne DIGHEM geophysical survey on its 596 square-kilometre Kinskuch project located adjacent to, and to the southeast of, Bravo's Homestake Ridge project in northwest British Columbia.
The survey utilized Fugro's DighemV-DSP electromagnetic system. The completed survey totaled 3,821 line-kilometres flown at a nominal 100 metre spacing, which included 364 line-kilometres of tie lines at 1,000 metre spacing, and was completed from August 1st to September 14th, 2011. The survey, which covers about 60% of the total project area, was completed from the company's base of operations at Alice Arm at the southern margin of the survey block.
Objectives of this survey were two-fold:
-- to provide high resolution electromagnetic and magnetic data for the direct detection and delineation of sulphide-associated gold occurrences, and
-- to facilitate the mapping of bedrock lithologies and structure, which in turn influence the emplacement or hosting of economic mineralization.
The objectives of the survey have been met. The data has enabled both the mapping and delineation of controlling structures, and the identification of areas with anomalous conductivity that suggests the presence of sulphide mineralization. Several zones of anomalous conductivity have been identified within key target areas throughout the project area.
The Illiance River trend, which was a target of the company's 2011 exploration efforts, shows up in the survey as both a broad magnetic low (possible alteration zone due to destruction of magnetic minerals) and an electro-magnetic high (conductive zone suggesting the presence of sulphides) extending over a five kilometre strike length of strongly altered volcanic stratigraphy that is an important host at the nearby Homestake Ridge project. The target in this area is high-grade silver-enriched polymetallic mineralization within a series of sub-vertical structures occurring along the altered trend. Only a 2.5 kilometre strike length of this geophysical trend was mapped and sampled by Bravo during 2011.
Bravo also completed four drill holes within the Illiance River trend in 2011, three of which returned encouraging assay results including a 2.8 metre interval averaging 318g/t Ag, 0.4g/t Au, 2.2% Pb and 6.5% Zn (582g/t AgEq) from drill hole KN11-02; and a 3.9 metre interval averaging 268g/t Ag, 0.2g/t Au, 3.4% Pb and 6.5% Zn (491g/t AgEq) from drill hole KN11-03 (see NR-04-12). The holes were drilled from two set-ups, 500 metres apart. Mineralization is open at depth and to the north and south.
A program of geological prospecting, sampling and ground geophysics is being recommended to further delineate the conductive zones and to identify disseminated sulphides that may indicate anomalous silver and gold mineralization.
Follow-up exploration will be carried out within the context of an expanded 2012 exploration program on the project, which is planned to include an aggressive surface exploration program and up to 10,000 metres of diamond drilling on the Illiance River trend and other targets throughout the property.
To view Figure 1 please click the following link: http://media3.marketwire.com/docs/BravFig1-221.pdf
Financing Update
Bravo has closed the final tranche of its previously reported non-brokered private placement by issuing 1,065,000 units at a price of $0.07 per unit for gross proceeds of $74,550.00. Each unit consists of one common share and one-half transferable share purchase warrant exercisable to purchase one additional common share for a period of two years at an exercise price of $0.10 per share. Together with the first tranche closing on December 30, 2011 and the second tranche closing on January 4, 2012 Bravo Gold has raised an aggregate $884,119.95.
About Bravo
Bravo Gold Corp. has a 100 percent interest in the Homestake Ridge project, which is located in a prolific mineral belt in northwestern British Columbia. The project is being advanced as a potential high-grade underground mining operation with a current NI43-101 compliant Indicated Resource, at a 3.0 g/t AuEq. cut-off, of 191,000 oz gold and 1,350,000 oz silver plus an Inferred Resource of 530,000 oz gold and 13,470,000 oz silver(1). Two deposits have been delineated to date, with a third, South Reef, discovered late in 2011. Multiple additional exploration targets remain to be tested on the large 2585 hectare property. Bravo acquired an option to acquire the 596-square-kilometre Kinskuch project located adjacent to, and to the southeast of, Bravo's Homestake Ridge project. Bravo also holds a 9.76 percent interest in Bravada Gold Corporation (TSX VENTURE:BVA.V; OTC:BGAVF - News), which is exploring 21 projects in Nevada. Visit us at http://www.bravogoldcorp.com
Robert Macdonald (P.Geo) is the Qualified Person as defined by National Instrument 43-101 for the Homestake Ridge project and has reviewed and approved the technical contents of this release.
On behalf of the Board of Directors
Joseph A. Kizis Jr.
Director, President
Bravo Gold Corp.
1. The current estimate was prepared by Roscoe Postle Associates Inc. (RPA). Mineral Resources on the Main Homestake deposit were estimated previously in 2010 using a block model constrained by 3D wireframes of the mineralized zones. Mineral Resources on the Homestake Silver deposit were estimated in 2011 using a block model constrained by pierce points projected to 2D surfaces. The Main Homestake block model comprised an array of blocks measuring 5 m x 5 m x 5 m, with grades for Au, Ag, and Cu interpolated using ID3 weighting. The Homestake Silver block model comprised an array of blocks measuring 10 m x 10 m. At a 3.0g/t AuEq. cut-off, the models identified an indicated resource of 888,000 tonnes averaging 6.7g/t Au, 47.2g/t Ag and 0.15% Cu and a cumulative inferred resource of 4,060,000 tonnes averaging 4.3g/t Au, 158g/t Ag.
Contact:
Liana Shahinian
Bravo Gold Corp.
1-888-456-1112 or 604-641-2773
liana@mnxltd.com
http://finance.yahoo.com/news/Bravo-Gold-Corp-Airborne-ccn-3559725740.html?x=0
Gold and Related 1-Year Charts >


PMI Gold drills 72 m of 4.25 g/t gold at Obotan
2012-02-21 16:06 ET - News Release
This item is part of Stockwatch's value added news feed and is only available to Stockwatch subscribers.
Here is a sample of this item:
Mr. Collin Ellison reports
PMI GOLD ANNOUNCES FURTHER POSITIVE RESOURCES DRILL RESULTS FROM ITS FLAGSHIP OBOTAN GOLD PROJECT
PMI Gold Corp. is providing further assays from resource drilling at its 100-per-cent-owned Obotan gold project in Ghana, West Africa. The results from 46 diamond drill holes representing 6,395 samples from 11,843 metres of drilling have been received. These results are from all four deposits in the Obotan gold project. All drill holes were designed to test the downdip extension of mineralization on the four deposits (Nkran, Adubiaso, Abore and Asuadai) in the Obotan gold project. The results continue to reinforce the resource estimate and block models for the various deposits, and continue to support the potential of the project.
These results will be included in a new resource estimate due in the March quarter of 2012 for the definitive feasibility study. The definitive feasibility study is targeting completion by June, 2012.
Moneta Porcupine Mines Inc (TSE:ME) CORPORATE PRESENTATION -
February 2012 -
![]()
http://www.monetaporcupine.com/i/pdf/MONETA_FEB_2012.pdf
About Moneta est. of GOLD valuations
let's start with an ex....
Golden Highway Project which contains 3.1 million ounces gold
(NI 43-101) -
Proven & Probable
US$92/oz x 3.1 million ounces gold
(NI 43-101) = US$285 million -
compare with Moneta Porcupine Mines total of
the market cap valuation - Market Cap: CAN$56,630,555.-- only
its very undervalued and oversold - what a Au bargain play
http://tmx.quotemedia.com/quote.php?qm_symbol=ME
on the TSX and TSX Venture (companies selected run the gambit
from junior explorers, to advanced development and also
producers) which had NI 43-101 categorized resources in
three industry standard categories of
1) Inferred,
2) Measured & Indicated, and
3) Proven and Probable.
The results were tabulated in US funds according to closing
valuations for the last full trading week in the month of
January 2012.
Results (rounded to the closest dollar) are as follows:
1)
Inferred
US$47/oz
2)
Measured & Indicated
US$72/oz
3)
Proven & Probable
US$92/oz
Moneta holds a 100% interest in 5 core projects strategically
located along the Destor Porcupine Fault Zone in the world class
Timmins Camp with excellent infrastructure including access
roads, water, electricity, and mills.
The land position is one of the largest -
after three gold producers -
including the highly prospective
Golden Highway Project which contains 3.1 million ounces gold
(NI 43-101) and covers 12 kilometers of a volcanic/sedimentary
belt along the Destor Porcupine Fault Zone, similar to that
which has hosted the bulk of the 75 million ounces mined to
date in the Timmins Camp.
Moneta expands near surface gold mineralization on Golden Highway Project
TIMMINS, ON, Feb. 2, 2012 /CNW/ -
Moneta Porcupine Mines Inc.
(TSX: ME / OTC: MPUCF / XETRA: MOP) ("Moneta") announces results
from its ongoing exploration program on its 100% owned
Golden Highway Project,
located 100km east of Timmins, Ontario (Canada).
http://tmx.quotemedia.com/article.php?newsid=48055239&qm_symbol=ME
Ian C. Peres, President and CEO said, "Windjammer Central is
one of the key target areas in 2012 and we are pleased with
the results to date.
This large mineralized envelope is important as it lies between
Windjammer North and Windjammer South and has the potential
to develop into a new gold resource which may incorporate
Windjammer North, and have possible linkage to
Windjammer South".
Drill highlights include:
MWJ-11-51:
MWJ-11-53:
MWJ-11-55:
MWJ-11-57:
0.97 g/t over 22 metres or 0.72 g/t over 57 metres
1.02 g/t over 73 metres or 0.76 g/t over 140 metres
0.94 g/t over 54 metres including 1.42 g/t over 26 metres
1.06 g/t over 22 metres or 0.72 g/t over 55 metres
The Windjammer Central target area is one of five priority target
areas to be drilled in 2012 immediately within and adjacent to
the existing NI 43-101 gold resource open pit shells.
Windjammer Central is located in a similar geological setting as
Windjammer South (0.9Moz NI 43-101 resource) and current
drilling has now confirmed the same style of mineralization. A
mineralization envelope 200m in width and 750m in strike length
has been identified within the sediments along the volcanic-
sedimentary contact, on one of two branches of the prolific
Destor Porcupine Fault Zone that pass through
Moneta's Golden Highway Project.
The Windjammer North gold mineralization, not included in
the current NI 43-101 resources, is found immediately north
of this large mineralization envelope.
For a plan map of the New Mineralized Envelope between Windjammer
North and Windjammer South,
please click on the following link:
http://www.monetaporcupine.com/i/pdf/2012-02-01_NRM1.pdf
Additional drilling is underway to continue to expand the
mineralized envelope east-westerly along strike and southerly
towards Windjammer South.
Drill highlights are summarized in the following table:
Drill hole
From
(m) To
(m) Width (1)
(m) Vertical
Depth (m) Au
(g/t)
MWJ11-51 144.00 154.00 10.00 110 0.70
incl. 144.00 159.00 4.60 0.96
291.00 300.00 9.00 1.05
incl. 295.00 298.00 3.00 1.69
412.00 468.60 56.60 0.72
incl. 412.00 434.00 22.00 0.97
MWJ11-52 107.00 109.00 2.00 85 3.26
181.00 182.00 1.00 6.74
208.00 209.00 1.00 5.86
302.00 313.00 11.00 0.79
318.00 330.00 12.00 0.89
incl. 327.00 330.00 3.00 2.13
MWJ11-53 211.00 351.00 140.00 165 0.76
incl. 211.00 220.00 9.00 1.34
and 270.00 343.00 73.00 1.02
incl. 296.00 320.00 24.00 1.15
incl. 328.00 343.00 15.00 0.96
MWJ11-54 133.70 137.52 3.82 110 1.56
368.00 376.00 17.00 0.71
incl. 368.00 369.00 1.00 5.83
MWJ11-55 139.00 145.00 6.00 105 0.78
212.00 265.55 53.55 0.94
incl. 239.42 265.55 26.13 1.42
incl. 265.00 265.55 0.55 27.67
MWJ11-57 261.00 316.00 55.00 200 0.72
incl. 294.00 316.00 22.00 1.06
incl. 316.00 316.00 1.00 6.61
(1) Drilled widths are currently reported
R. Skeries, P.Geo., is the Qualified Person for the purposes of NI 43-101 and has approved the technical content of this release.
About Moneta
Moneta holds a 100% interest in 5 core projects strategically
located along the Destor Porcupine Fault Zone in the world class
Timmins Camp with excellent infrastructure including access
roads, water, electricity, and mills.
The land position is one of the largest -
after three gold producers -
including the highly prospective
Golden Highway Project which contains 3.1 million ounces gold
(NI 43-101) and covers 12 kilometers of a volcanic/sedimentary
belt along the Destor Porcupine Fault Zone, similar to that
which has hosted the bulk of the 75 million ounces mined to
date in the Timmins Camp.
Moneta's public documents may be accessed at www.sedar.com.
For further information on Moneta, please visit our website at http://www.monetaporcupine.com
or email us at info@monetaporcupine.com.
Assay Reporting: Diamond drill core logging and sampling follows general industry practices whereby logged and sample marked core is sawn in half with one half bagged and tagged for shipment to the assay laboratory and the remaining half of the sawn core returned to the core box for storage and future reference. Pulps and rejects are also stored. Blanks and a range of standards are inserted into the sample steam at regular intervals. Initial assays, metallics, and routine duplicates are completed by Expert Laboratories. Up to 15% of the pulps are submitted to a second laboratory as duplicates and checks. All laboratories used standard 30g fire assay techniques. Additional core sampling and assaying, including second cuts and metallics, may be completed at later dates. Intersections are reported using drilled widths unless specified otherwise with assay values as simple averages of duplicates and gravimetric results.
This news release includes certain forward-looking statements concerning the future performance of our business, its operations and its financial performance and condition, --- we caution against placing undue reliance thereon. We assume no obligation to revise or update these forward-looking statements.
Ian C. Peres, President & CEO
416-579-3040 (Toronto)
705-264-2296 (Timmins)
iperes@monetaporcupine.com
http://investorshub.advfn.com/boards/board.aspx?board_id=5495
Greece is Fixed so Let's Buy Everything By Trader Dan
* Tuesday, February 21, 2012 
Greece managed to secure itself a bailout which takes the problem off the radar screen of hedge fund managers for the time being so it was back to "RISK ON" in a big way in today's trading session. Between China's 50 basis point lowering of its Reserve Ratio Requirements for its banks yesterday and today's money printing to throw at the Greek debt problem, it was "Happy Days are Here Again" as the equity market perma bulls wasted no time in bidding the price of stocks higher while the inflation camp decided to buy nearly anything that moved on the commodity exchanges with the grains being the notable exception to the party.
This buying resulted in copper and silver both EXPLODING higher while gold managed to finally take out both the $1740 level and the $1750 level in one fell swoop. Resistance - forgettaboutit! It evaporated with this rush of hot money into the markets again. This is money that has been sitting on the sideline waiting to see how the European sovereign debt situation was going to unfold. Once that particular stumbling block was removed out of the way, the path of least resistance in this pitifully low yield interest rate environment was higher for risk assets.
Notice on the chart that gold has finally managed that CLOSE over $1750 which it needed to set up a run towards $1780. The trick for the yellow metal will be to see if it can HOLD TWO CONSECUTIVE CLOSES over this important technical resistance level. If we see additional follow through buying in tomorrow's session, gold will go on to test the upper boundary of the zone noted on the chart as "Heavy Resistance Zone". That upper boundary is $1780 where the price capping bullion banks will be ready to attempt to stem the advance. If they fail there, we are going to see a handle of "18" in front of the gold price relatively quickly.
Downside chart support is initially near $1740 followed by $1720.

Let's also look at silver which finally managed to CLOSE ABOVE $34. This is the first signal that the consolidation pattern of the last few weeks is close to resolving itself. If silver can take out the initial resistance level noted on the chart, it will very likely embark on a visit of significant resistance centered between $35.00 - $35.35. I would like to see a close above this level, preferably above $35.50 to indicate that silver is headed to $40.
Downside chart support is at the bottom of the recent consolidation pattern near $33 which is where buyers have been busy accumulating the metal for the last three weeks.

Here is a picture of the fallout coming from this nearly unlimited money printing that seems to be the order of the day (issuing new debt to pay off old debt) - look at what is happening to longer term interest rates. While still low by historical standards, the yield on the 10 year note is now above 2% and moving towards 2.10, the upper boundary of the recent trading range. If interest rates were to break out strongly to the upside, the multiplier effect on the gargantuan amount of US debt would begin having a keen impact on the US fiscal condition. The US monetary authorities want to have their cake and eat it too - by that I mean that they want to be able to artificially keep short term interest rates at ridiculously low levels to encourage consumer borrowing as well as keeping the cost of servicing the US debt load low.
However, if the Central Banks, particularly of the West, are going to keep this insane game of kicking the can down the road by basically adulterating their currencies, then those who lend their respective governments the money are going to demand higher rates of interest to compensate them for the fallout of all this, namely increasing risks of inflation originating from the debauchment of their currencies.

Crude oil has firmly broken out to the upside and is trading well above the key $105 level. Gasoline is going beserk to the upside. It looks like we are going to see $4.50 gasoline in most cities across the nation by Memorial Day and possibly $5.00 at the rate which it is soaring.

Gasoline is at a key crossroads on the long term montly chart. If it pushes through this level near $3.08 - $3.10, odds will then favor it running to $3.40 which will the last level of chart resistance before it revisits its all time high. The American consumer is now reaping the combination of Obama's stupidly inept energy policies along with the fallout from the Federal Reserve's near zero interest rate policy with a wild card kicker of Iranian tensions. What has me extremely concerned is that we are NO WHERE NEAR the PEAK DEMAND period here in the US which kicks in as we near summer and the driving season.
At some point, even the Johnnie one-note equity bulls are going to have to consider the fact that their beloved liquidity dumps are poisoning the well from which they are drinking. Energy prices that soar are a TAX on the entire economy and work to depress growth and confidence and no amount of spin from the
"BUY STOCKS ALL THE TIME" financial analysts that infect our financial media is going to be able to prevent that.

http://traderdannorcini.blogspot.com/2012/02/greece-is-fixed-so-lets-buy-everything.html
George.
Click on "In reply to", for Authors past commentaries.
Rising gold got you down? Call the BIS at 1-800-RIG-MKTS
Submitted by cpowell
on 08:46PM ET Monday, February 20, 2012.
Section: Daily Dispatches
Dear Friend of GATA and Gold:
You never know what sort of compromising documents central bankers will leave lying around, confident that the mainstream financial news media throughout the world have no more curiosity or insight than, say, Kitco gold market analyst Jon Nadler, who maintains with a straight face that central banks have no interest in manipulating the gold market. (See http://www.gata.org/node/8717.)
GATA's main work is to document and publicize that rigging --
http://www.gata.org/taxonomy/term/21
-- and our assiduous researcher R.N. this month discovered more such documentation in a 24-page brochure prepared by the Bank for International Settlements to introduce itself to prospective members at a seminar at BIS headquarters in Basle, Switzerland, in June 2008. The brochure includes an advertisement for the gold market-rigging services provided by the BIS to its 50 or so member central banks. Page 17 of the brochure touts "Our Products," including "Gold & Forex Services -- Interventions."
The BIS brochure is posted at GATA's Internet site here:
http://www.gata.org/files/BISAdvertisesGoldInterventions.pdf
So, is your currency sinking as you borrow and print like crazy, unable to keep up with stupid wars, counterproductive social welfare schemes, and corrupt political patronage? No problem -- let the BIS fix things for you. Just give them a call at 1-800-RIG-MKTS.
CHRIS POWELL, Secretary/Treasurer
Gold Anti-Trust Action Committee Inc.
(received via Email)
Today's PR from Evolving Gold's 37% owned spinoff, Prosperity Goldfields...
Prosperity Goldfields Corp. Kiyuk Gold Project Update; Additional Assay Results, Spring Drill Program
VANCOUVER, BRITISH COLUMBIA--(Marketwire - Feb. 21, 2012) - Prosperity Goldfields Corp. (TSX VENTURE:PPG.V; OTC:PSPGF - News) ("Prosperity Goldfields") is pleased to provide an update on its 100% controlled Kiyuk Gold Project in Nunavut.
Metallic Screen Gold Assays
Prosperity Goldfields has recently received metallic screen assays for select drill intervals first reported in a news release dated September 15, 2011. Metallic screen assay results for the single drill hole (RU11-001) that tested the Rusty Zone show an increase in average gold grade of 11% from 1.70 gpt Au to 1.92 gpt Au from surface to 157.6 meters total depth. The interval 5.2 - 35.7 meters increased 14% from 4.91 gpt to 5.69 gpt Au. Results of metallic screen fire assays for the Gold Point Zone and the Cobalt Zone are more variable, showing both increases and decreases in the gold assay results for the longer assay intervals (greater than 10 meters). Statistical analysis of the metallic screen assays versus initial fire assay data indicates a positive variance of 0.04 grams per tonne Au based on a population of 423 samples. However, the data show a minor, yet systematic, increase in gold captured by the metallic screening process: +0.18, +0.52, and +2.67 grams per tonne gold for samples that register greater than 1.0, greater than 5.0, and greater than 10.0 grams per tonne Au, respectively.
Results for the longer assay intervals (greater than 10 meters) from drill holes at the three zones are shown in the tables below.
Summary of Metallic Screen Results from the Rusty Zone
 ----------------------------------------------------------------------------

                                       Gold     Gold            Gold     Gold
                                     (gpt)-   (gpt)-          (opt)-   (opt)-
                                    Initial Metallic         Initial Metallic
              From      To  Length     Fire   Screen  Length    Fire   Screen
 Hole      (meters)(meters)(meters)   Assay    Assay   (feet)  Assay    Assay
 ----------------------------------------------------------------------------
 RU11-001      0.0   157.6   157.6     1.70     1.92   516.9   0.050    0.056
 including     0.0    52.4    52.4     3.27     3.82   171.9   0.095    0.112
 including     5.2    35.7    30.5     4.90     5.68   100.0   0.143    0.166
 including    16.5    35.7    19.2     6.17     7.49    63.0   0.180    0.219
 including    28.0    31.1     3.1    20.84    30.55    10.2   0.609    0.892
 including    76.8    86.3     9.5     3.31     3.58    31.2   0.097    0.105
 ----------------------------------------------------------------------------
 Summary of Metallic Screen Results from the Gold Point Zone
 ----------------------------------------------------------------------------
                                                Gold            Gold     Gold                                      Gold   (gpt)-          (opt)-   (opt)-
                                     (grams Metallic         Initial Metallic
              From      To  Length      per   Screen  Length    Fire   Screen
 Hole      (meters)(meters)(meters)   tonne)   Assay   (feet)  Assay    Assay
 ----------------------------------------------------------------------------
 GP11-002    102.7   121.0    18.3     1.41     1.54    60.0   0.041    0.045
 including   104.3   108.8     4.5     3.21     3.38    14.8   0.094    0.099

 GP11-003     99.4   104.0     4.6     6.10     4.99    15.1   0.178    0.146
             148.6   212.2    63.6     2.84     2.77   208.6   0.083    0.081
 including   148.6   187.2    38.6     4.15     4.12   126.6   0.121    0.120
 including   151.2   156.6     5.4    11.64    10.58    17.7   0.340    0.309
 including   177.1   182.9     5.8     8.58     8.41    19.0   0.251    0.246

 GP11-005    108.8   122.6    13.8     2.06     2.35    45.3   0.060    0.069
             178.0   191.2    13.2     2.32     2.57    43.3   0.068    0.075

 GP11-006    214.7   222.7     8.0     6.25     5.58    26.2   0.183    0.163
 including   214.7   218.0     3.3    11.95     9.89    10.8   0.349    0.289
             319.2   329.4    10.2     1.56     1.17    33.5   0.046    0.034
 including   325.9   328.0     2.1     4.27     2.50     6.9   0.125    0.073
 ----------------------------------------------------------------------------
 Summary of Metallic Screen Results from the Cobalt Zone
 ----------------------------------------------------------------------------
                                                Gold            Gold     Gold                                      Gold   (gpt)-          (opt)-   (opt)-
                                     (grams Metallic         Initial Metallic
              From      To  Length      per   Screen  Length    Fire   Screen
 Hole      (meters)(meters)(meters)   tonne)   Assay   (feet)  Assay    Assay
 ----------------------------------------------------------------------------
 CS11-002     52.4    84.5    32.1     1.82     1.91   105.3   0.053    0.056
 including    64.1    81.4    17.3     2.41     2.70    56.7   0.070    0.079

 CS11-004     67.7    98.2    30.5     1.20     1.24   100.0   0.035    0.036
 including    84.5    96.6    12.1     2.01     1.98    39.7   0.059    0.058

 CS11-005     90.5    96.6     6.1     2.03     1.63    20.0   0.059    0.048

 CS11-007    104.3   110.4     6.1     4.38     3.46    20.0   0.128    0.101
 ----------------------------------------------------------------------------
 Weighted averages were used to calculate all reported intervals
Hope so. The miners are way past due.
Technical Trading: The Week Ahead - Bulls Seize Control of Gold Again
21 February 2012, 11:49 a.m.
By Kitco News
http://www.kitco.com/
(Kitco News) - Tue Feb. 21—April Comex gold futures shot higher out of the starting gates Tuesday, as the bulls seized control of the short-term trend.
The market had been consolidating over the past couple of weeks in a modest downward fashion, but April gold has rocketed $30 higher an ounce in morning trade Tuesday, putting the focus firmly back on the $1,765.90 resistance ceiling from Feb. 3.
The sideways to lower consolidation in recent weeks failed to harm the overall medium term bullish technical trend and it allowed the gold market to work off some of its overbought momentum readings.
In early February, the 9-day relative strength index (RSI), a widely watched momentum indicator topped out above the 80% mark. Any reading above 70% is considered to be overbought. In recent weeks, the RSI has fallen down to the 49% area, leaving the market in a more healthy state to rally again.
Peter Ruud, technical analyst at Informa Global Markets, monitors the spot gold market. He noted that "gold hit an all-time high versus the yen." Ruud also noted that gold priced in euro was also close to its all-time high levels. He said that the all-time high in gold priced in euros was set in September 2011 at $1,374.71 euros and is now at $1323. "It's 50 points off the highs. When you are near or at new highs against gold in a number of currencies, it buoys gold in general."
Looking at spot gold, Ruud highlighted key near term resistance at the February swing high at $1,760 per ounce level. "If we can clear $1,760 it is a straight shot to $1,800," he said.
Near term, Ruud called the $1,760 area "very important" and gold's action around that resistance zone could be the key to "directional activity for the next few weeks to few months."
Pointing to overall financial market risk sentiment, Ruud said there were a "lot of gaps in forex and equities" from Friday's close to Monday's open on the hourly charts. "Euro/yen, dollar/yen, the euro chart show bullish gaps. If those gaps hold the risk on trade is good and gold could benefit," he explained.
Bottom line? "If we break $1,760 it is off to the races toward $1,800," Ruud concluded.
Meanwhile, May silver futures have probed higher Tuesday, but remain within a multi-week sideways consolidation band on the daily chart. Last week saw a failed downside probe below range-bottom support. Buyers were quick to swoop in on the intraday dip Feb. 16. That bodes bullishly for a near term test of the range top.
Range-top resistance for May silver lies at $34.54 an ounce. The so-called measured move objective on an upside breakout above that ceiling comes in around the $36.00 zone.

By Kitco News
HL is gonna be a monster, especially when silver catches up.
Put the Lucky Friday 3 million ounces back into the equation (in 2013), with Silver presumably over 40 bucks, and we'll be considering some new all time highs.
HL almost covered the overhead gap while Marketwatch has already started bashing the Greece deal as not really being for Greece. Could see some really wild swings coming up.
Failure of the Greek deal will bring metals prices back down. Temporarily.
Seasoned investors know what to do on the dips.

/
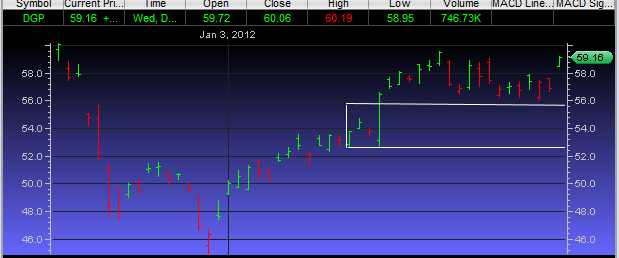
Nice spike but let's use DGP as another example to be cautious here. Notice the huge space left behind as outlined by the box. Then note the long bar on the left. This tends to act as a magnet to draw the price down before the uptrend continues much further. Could be this is the ONE TIME that this theory doesn't not play out but take the chart back at least a year and see that there are NO bars like that left that have not been retraced. Not one.
almost no one is aware of this penny gold mining stock breakout currently in progress ADNT
it is a slow motion breakout in ADNT
http://www.flickr.com/photos/46088927@N00/6881727683/lightbox/
breakout is validated by RSI
|
Followers
|
404
|
Posters
|
|
|
Posts (Today)
|
1
|
Posts (Total)
|
43395
|
|
Created
|
01/21/05
|
Type
|
Free
|
| Moderators NYBob DiscoverGold | |||
GOLDBUGS - I-hub's #1 precious metals board was created for those with an affinity for the yellow stuff.
Gold has a long history as a hedge against inflation, and in these challenging times it seems prudent to have a certain portion of your portfolio in gold and other precious metals.
For the novice or experienced trader investing in mining stocks or NYMEX, bullion or coins, exploration stocks or producers, you'll find others with similar interests.
Whether a technical or fundamental trader, long or short term, your questions and input are welcomed and appreciated.
"The GOLDBUGS board" is the place where Goldbugs live.
Articles, technical analysis, charts, and data of interest to goldbugs are all welcome here. Information concerning currencies and commodities are also welcome as these markets influence the PM's.
Rules of the Road:
1) No insults or bashing of another member.
2) Members will maintain an attitude of humility.
3) Members who find they are able to help another member will do so.
If you find the board useful please let us know by clicking the "Add To Favorites" link.


| Volume | |
| Day Range: | |
| Bid Price | |
| Ask Price | |
| Last Trade Time: |


