 News
News  Market Data
  Discover
Support: 888-992-3836
Copyright © 2023 InvestorsHub Inc.


Register for free to join our community of investors and share your ideas. You will also get access to streaming quotes, interactive charts, trades, portfolio, live options flow and more tools.
RCKS,,,Thanks for another good chart and info. The one guru I watch quite a bit enters a trade then he sells 3/4th of it on the next Rez or Support level. So the market might move 10 points or 100 points but he seldom stay in that type of move.
http://www.pretzelcharts.com/
So, briefly (because I want to get into this next part), SPX invalidated the micro impulse discussed in the last update. This does not preclude a top (near-term or otherwise), it simply means that first apparent micro impulse was invalidated. There's an option here for a return toward 4500-20, but it's mainly speculative at this point.
With that, let's get something out of the way: I am not 100% accurate. I am not 99% accurate, nor 95%, nor 90%. If anyone is under the impression that I'm always going to be right, let me disabuse them of that notion right now. This is not an exact science. If one trades as if it is, or anything approaching one, then one will end up in trouble.
I've written before that my only goal is to be right more often than I'm wrong, and I do believe I've achieved that for many years running. The thing is, even if I tend to be right with some degree of regularity, it's simply never going to be anything approaching 100% accuracy, so properly managing risk in your trades is always the most critical part of the equation.
Let's unpack that a bit using an illustration:
Let's say your system is right an astounding 90% of the time and you earn an amazing 100% return each time you're right. Can't do much better than that, right? The problem is, if you don't manage risk extremely well, you're going to go broke anyway, even with that miraculous prediction system. Here's how: On trade 1, you risk 100% of your account (because you don't manage risk well!) and you're right, so you've doubled your account. On trade 2, same thing. Trades 3, 4, 5, 6, 7, 8, and 9 -- same thing. If you started with only $5K, you have now amassed an impressive $2.5 million.
But on trade 10, it all goes wrong, and you end up like this guy:"

"I've written many times that risk management is more important than any system that attempts to predict future market states, and that is why. If your risk management is poor, then it only takes ONE SINGLE mistake, and your entire account can be flushed.
If your risk management is just subpar, then it might take half a dozen or a dozen mistakes instead of just one -- but you're ultimately headed for the same place, just not as quickly. The best "prediction" system in the world cannot compensate for all the losses that will invariably follow from poor risk management.
Part of risk management is knowing when not to act -- and then having the discipline to do nothing.
Part of it is understanding the nuances of the predictive system itself (one must understand these to understand the relative risk if one does decide to act).
For example, at the October bottom, all my SPX charts were clearly labeled 3/C -- they were labeled that way before the bottom was even reached, when it was reached, and after it was reached. Here's where the nuance comes in: In EWT, the C-wave of a decline marks the very bottom of a correction, and the market rallies back up to new highs from there.
That's a risk, and it's a risk that was clearly illustrated on the charts -- and if one knows the system, then one understands the C-label means there's a risk the market isn't going back down. One understands that risk whether I talk about it repeatedly or not at all. And one must then manage that risk accordingly. Because, really, there's only so much I can do (we'll get to that in a second). In the most recent example: I not only accurately identified the existence of the risk in the first place, but I also accurately identified the exact price point at which that risk markedly increased.
Most systems are hard-pressed to do that much -- much less any better than that. If there's a system out there that does more than that, then I've never heard of it.
The reality is, if you need me (or anyone else) to discuss every detail of managing risk/trading strategy/etc., then you probably shouldn't be trading at all yet. Because I can't do it. Literally. To simply cover all the ins and outs of risk management alone in the depth required each time isn't practically possible. These are not detailed discussions of trading strategy or analysis of each and every risk management strategy and/or how they apply to your account, your finances, and your trading goals, they're just "here's where I think the market might possibly be headed."
Anyway, referring back to the October low again: Yes, I leaned toward the bears eventually "getting it done" in the end and maybe I was wrong about that (TBD), but:
On October 30, I laid out the options and listed the very first option as: "SPX has captured its Wave 5 target and does not need to go any lower. It could form a decent bounce from here (plus or minus a little). If one has been following these updates, then one already has hundreds of points of profit and may not feel the need to get overly greedy (not trading advice). Maybe it's that simple."
At the same time, the charts implied that if 5 of 3/C had indeed completed, then we should be looking for a decent bounce (even the bear count suggested we'd probably get a fourth wave 100-point bounce). Then when we captured that ~100 points, I adjusted everything and was still looking higher.
Around the time I adjusted everything higher, I clearly stated that my "not trading advice" for bears was to take NO ACTION until there was an impulse down. See, to my thinking, bears should not have been heavily short by this point, having closed a bunch of profit on or around October 30, so that would allow them the option of non-action -- so I wrote that because I saw the risk of a meaningful C-wave bottom and was uncomfortable with it. But that's just my approach, and my approach isn't always right. If you took action anyway, then you did your own thing, despite my warnings. Nothing wrong with that, as I said: My approach isn't always right. It happened to be right in this case.
Could I have discussed that potential C-wave in more detail? Obviously -- anything can be discussed in more detail, which is part of the logistics problem I'm getting at here. Should I have? I dunno, but I do regret not discussing it more, because it seems that would have helped people.
The bottom line is: We're all pretty good at assessing potential rewards. Maybe too good at it, since we can become blind to risk by the thought of rewards -- that's exactly the tendency that makes casinos such big business. But one will go broke trying to trade the market without a realistic assessment of the risks and a good system to manage them.
This is one of several reasons that NOTHING I WRITE IS TRADING ADVICE. Because what I write can never and will never be enough information. There are literal books-worth of information that lay the groundwork and serve as important context for even the simplest trade. There's also a big difference between "what I may expect is reasonably likely to happen from an analytical standpoint" and when and how I might actually be willing to execute any trade at all based on that expectation. The "expectation" isn't enough, nor is it the entire picture.
In the end, while Elliott Wave can seem like a crystal ball at times, it is not infallible nor an exact science. Nor is any other form of market analysis or prediction. Every system out there will go off the rails sometimes, and they'll do so with some degree of regularity. Plan around that. Because it's what you do at those times that will make or break your account in the long run.
*****
With that out of the way, let's take a look at three charts. The first is a chart of COMPQ, which I published a couple weeks ago, illustrating what seems like the reasonable bull case. Is it possible for it to be more bullish than this? Obviously. But for many fundamental reasons, some of which I've covered here recently, I presently have a hard time believing in those. I'm not being "stubborn" with that belief; I'm just assessing the data as best I can. (Further, the second chart will add another, more technical, reason.)"

"The next chart is SPX going back to the 1870s, and one of the reasons I have suspected we're either at or approaching a significant bear market. Can that red (5) extend? Sure, always possible. Forget the emotion du jour triggered by the recent rally, and the recency bias that engenders, and think about what you know to be true fundamentally. Then ask: Does an extended fifth rally presently seem very likely to you?"

"Finally, the close up of the chart above, focusing on the move since the 2009 low:"

"The chart above implies that a "double retrace" back toward the 3300s is not an option that should be entirely dismissed. In fact, double retraces retest the prior high (which we're getting into the ballpark of doing), THEN form their second legs down. Can I guarantee that? NO. But it's certainly an option.
Anyway, I'm pretty drained now. Trade safe."
CyclesFan @CyclesFan
SPX:
$SPX - Despite bullish seasonality next week, there's likely to be a pullback in the next 2 weeks but it may get to 4600 1st. The pullback target may be as low as the 10 week MA. Once the pullback is over it's headed higher into the 1st or 2nd week of January to as high as 4819. pic.twitter.com/m9PnCpW6rL
— CyclesFan (@CyclesFan) November 26, 2023
$AAPL - Probably made a short term high this week. I expect a pullback in the next 2 weeks that may retrace up to 50% of the rally out of the October low(179.30). Once the pullback is over it's headed higher into the next weekly high that is due in the 1st or 2nd week of January. pic.twitter.com/ZIQhIZT6O1
— CyclesFan (@CyclesFan) November 26, 2023
$NVDA - In 2020-2021 it consolidated for 27 weeks before starting the 2nd leg of the bull market. The current consolidation should last 28/29 weeks and end in late January around 400. Once its over NVDA will start the 2nd leg of the bull market towards the 2.168 extension at 732. pic.twitter.com/2XobIbiIV7
— CyclesFan (@CyclesFan) November 26, 2023
$MSFT - The rally towards 480 by late 2024 is in progress. There's likely to be some sort of pullback in the next 2 weeks. Once the pullback is over it's headed higher into the 1st or 2nd week of January with the target being the 1.618 extension of the recent correction at 402. pic.twitter.com/vvusUM2ufr
— CyclesFan (@CyclesFan) November 26, 2023
What Are The Chances Of A Market Crash? This Indicator Says ZERO!
NOVEMBER 26, 2023 AT 01:23 PM
Tom Bowley
Chief Market Strategist, EarningsBeats.com
http://stockcharts.com/articles/tradingplaces/2023/11/what-are-the-chances-of-a-mark-360.html
"We can use sentiment indicators for a lot of purposes. I routinely follow the 5-day SMA of the equity only put call ratio ($CPCE) to help spot short- to intermediate-term bottoms. It's not quite so effective at calling market tops, but it does work in that regard many times as well. When I go out on a limb to call major market bottoms, my CPCE work is usually one piece of my analysis in putting together that jigsaw puzzle. I also have studied the Volatility Index ($VIX) a great deal. The VIX is the annualized "implied volatility" of the S&P 500 that helps investors estimate how much the S&P 500 will fluctuate over the next 30 days. The calculation is based on near-term S&P 500 options traded on the CBOE. If market makers are expecting high volatility ahead (normally during market downturns), premiums on these options will be higher and more costly for traders. When market makers are expecting low volatility ahead (normally during bullish market periods), premiums on these options will be lower and less costly. When we see big stock market declines, option premiums skyrocket and the VIX accelerates higher. Historically, the stock market doesn't perform well with the VIX above 20, which is why I watch that level so closely.
Let me illustrate how the S&P 500 has performed when the VIX is at various levels:"
http://d.stockcharts.com/img/articles/2023/11/26/b66e063a-43cb-4a3a-ace9-fcbefac9e8a7.jpg
"This chart goes back to 2013, when the S&P 500 cleared its double top from 2000 and 2007, effectively ending the secular bear market from 2000 through 2013. It's a chart of the VIX, but I've broken it down by value. The red-shaded area highlights S&P 500 annualized returns when the VIX closes above 20. The yellow-shaded area highlights S&P 500 performance when the VIX is in the 17-20 range. The light-green shaded area highlights performance when the VIX closes in the 13-17 range and the dark-green shaded are highlights performance when the VIX closes below 13. You can see that the lower the VIX goes, the better the S&P 500 performs. This performance chart also suggests that we be extremely careful whenever the VIX is above 20. I'd argue it makes sense to be in cash to eliminate stock market risk at that point - or at least take steps to reduce risk.
One thing we can conclude from looking at the above chart. The VIX closed on Friday at 12.46, falling into that dark-green shaded area. Typically good things happen when the VIX is this low. I know there are plenty of people that believe a market crash is right around the corner. Sorry, but the VIX in the 12s indicates that we shouldn't be considering that AT ALL right now.
I'll give you a couple more stats from the research I did. First, you need to know that during the current secular bull market advance, there have been 2677 trading days and the S&P 500 has closed higher 54.2% of those days. I've broken down the chance of the S&P 500 closing higher when the VIX is in each of those shaded areas on the chart. Check this out:
% of days S&P 500 closes higher when VIX closes above 20: 44.81%
% of days S&P 500 closes higher when VIX closes between 17-20: 51.04%
% of days S&P 500 closes higher when VIX closes between 13-17: 55.34%
% of days S&P 500 closes higher when VIX closes under 13: 66.28%
The lower the VIX goes, the more bullish the stock market gets. Embrace this low VIX, don't fear it."
If you enjoy the way we look at the stock market at EarningsBeats.com, then I'd encourage you to sign up for our service using our Fall Special. It's our absolute best deal of the year and our market guidance, research, and education is unparalleled. CLICK HERE for more information. It'll only last a week longer!
If you have any questions, feel free to reach out to us at "support@earningsbeats.com"
Happy trading!
Tom
Stock Market Commentary 11/24/23
By Lawrence G. McMillan
"The broad stock market continues to plow ahead, building on the recent upside breakout over 4400. Even though there are some signs of an overbought market, we are not seeing any confirmed sell signals yet. $SPX has overcome two small resistance levels, leaving the 2023 highs near 4610 as the next area to overcome. Above there, the all-time highs at 4800 might be challenged.
As for downside possibilities, there is still an obvious gap on the $SPX chart down to 4420 or so that could easily be filled. Even if that were filled, it would still leave the bullish scenario intact. As long as $SPX doesn't close below 4400, the $SPX chart is bullish.
Equity-only put-call ratios remain on buy signals as both are declining. There is once again some distortion from equity put arbitrage, especially noticeable on the CBOE, where Tuesday's CBOE Equity-only put-call ratio was 1.10. But that is just "noise" as far as the predictive capability of the equity-only put-call ratios are concerned. They will remain on buy signals for stocks until they roll over and begin to rise.
Market breadth has not been strong. In fact, for a brief moment a week ago, the breadth oscillators rolled over to sell signals, but they have since recovered. At the current time, they are on buy signals, and they are in modestly overbought territory. So, breadth has been disappointing, and even one day of negative breadth could throw the oscillators back onto sell signals.
$VIX has edged lower, although it doesn't seem to want to break below the yearly lows near 13. This has kept both the "spike peak" and Trend of $VIX buy signals intact. The "spike peak" buy signal, however, is about to "expire" on its own. The trend of $VIX buy signal would only be terminated if $VIX closes above its 200-day Moving Average.
There is a new seasonally bullish period about to begin, after Thanksgiving. In summary, we are maintaining a "core" bullish position as long as $SPX is above 4400, and we will trade other confirmed signals around that "core" position."
http://www.optionstrategist.com/sites/default/files/SPX.JPG?v=1700845255939
http://www.optionstrategist.com/sites/default/files/PC21.JPG?v=1700845255939
http://www.optionstrategist.com/sites/default/files/PC21_W.JPG?v=1700845255939
http://www.optionstrategist.com/sites/default/files/VIX.JPG?v=1700845255939
Thanks Glen
I thought the same thing but I never look at Weekly or Monthly charts for direction in the Market and for that reason I don't feel comfortable criticising those longer term views.
Tom's view does fit with Northam's Cycle work
I posted that H&S pattern several days ago. I think he is stretching the shoulder width way too much.. I think the pattern has already reached the target and will turn down some very shortly.
https://schrts.co/jdnQAhmm
Seasonality Points To Higher Prices NOW
NOVEMBER 24, 2023 AT 10:44 AM
Tom Bowley
Chief Market Strategist, EarningsBeats.com
http://stockcharts.com/articles/tradingplaces/2023/11/seasonality-points-to-higher-p-745.html
"I know we're in the midst of a powerful rally that began EXACTLY when seasonality suggested it would - at the close on October 27th. I discussed the very bearish seasonality leading up to that October 27th close in my article, "Odds Favor Further Selling This Week (Maybe a LOT of it)". Check it out if you haven't already. At the end of this article, I pointed out that bullish historical tendencies would soon overpower the bears and we've seen history repeat itself once again as the bulls have dominated the bears during the latter part of October and throughout November.
Technical Price Action
Before I provide more bullish historical tendencies ahead, let's look at the S&P 500 over multiple time frames:
S&P 500 - 1 Year Daily:"
http://d.stockcharts.com/img/articles/2023/11/24/dbaf257e-a8be-4d86-8fbe-ebdca2cf1986.jpg
"Pretty simple. We had a correction. The downtrend was broken. We're now trending higher with approaching price resistance near 4600. To the downside, a gap support zone resides from 4411-4559 and the rising 20-day EMA is conveniently located in the middle of it at 4437.
S&P 500 - 5 Years Weekly:"
http://d.stockcharts.com/img/articles/2023/11/24/61dfcaac-35d6-44e4-a156-a7e80cf9a8f0.jpg
"Sure looks like a bullish inverse head & shoulders continuation pattern to me. The pattern is almost perfectly symmetrical and it follows a very clear uptrend. The beauty here is that the pattern measurement is from the 4600 neckline down to the inverse head just below 3500. That's 1100 points. A breakout above 4600 would measure up 1100 points to 5700. Good luck bears! During uptrends, the RSI tends to hold the 40-50 range. Note the October low was squarely on 40. Now the RSI is back above 60. This is how the RSI unfolds during bull market advances. I also love the PPO reset at the zero line. We're now moving straight up off of that test, and that's indicative of accelerating bullish momentum.
S&P 500 - 40 Years Monthly:"
http://d.stockcharts.com/img/articles/2023/11/24/ab5b6892-d818-4b66-b153-47132458e928.jpg
"Do you see anything other than an uptrend? The red-shaded areas highlight what we typically see during secular (long-term) bear markets. From 2000 to 2013, we saw ZERO meaningful breakouts. It wasn't until April 10th, 2013 that the secular bull market began, making a definitive breakout above the 1550-1575 area. Since then, we've seen cyclical bear markets and corrections, but nothing more. Yet permabears try to call every downturn the beginning of the next collapse. And they're always wrong. We'll have scary times again, but it ain't now - at least not in my opinion. The 2030s could be a much different story, but I see the current trend higher continuing for a number of years. Note that our monthly PPO typically remains above zero and our monthly RSI remains above 40 throughout secular bull markets. Selling doesn't last long enough to take these indicators below the required zero and 40 levels, respectively. But we have to deal with the "sky is falling!" media and permabears throughout. If you need a "default", default as a bull. You'll be right much more often.
Historical Tendencies
We remain in the strongest and most bullish time of the calendar year, which I define as October 27th close through January 18th close. That's based on my 73 years of research on the S&P 500, dating back to 1950. We still have some not-so-bullish periods during November, December, and January, but the overwhelming bias is to the upside. For instance, the November 21st through December 6th period yields an annualized return of +32.97% over the past 7 decades, nearly quadrupling the average annual S&P 500 return of +9.00%. Don't misunderstand me. This doesn't guarantee us higher prices for the next couple weeks. Instead, it's simply providing us a seasonal tendency for stock prices to move higher. I use seasonality as a secondary indicator, much like PPO and RSI. The primary indicator is always price action."
"I'm still offering my FREE PDF, "Bowley Trend Part 1: Long-Term Trends Since 1950". I use it to help guide me in my trading. You probably don't realize it, but there's an 11-day period of EVERY calendar month (THE SAME DAYS EVERY SINGLE MONTH), or roughly 33% of all calendar days, that has provided more than 80% of the S&P 500 gains since 1950. As a stock trader, and especially if you trade options, you MUST know these days to get a leg up on everyone else. CLICK HERE to download your FREE COPY immediately!"
Happy trading!
Tom
Thanks RCKS..I have been reading a few stories about commercial realestate going to be the next big problem for banks..I guess some building owners are just giving the keys to the banks. But how may times havbe we heard wolf and nothing actually happens.One guru I read still looking at 4625 and then a multi month consolidation below that level. I think we need a 200 to 300 down move to reset the indicators...Very OB now on most timeframes...So we see
"....we'll see if this apparent impulse goes anywhere, or if it turns out to be just a speedbump." (Referencing Tuesdays trading as today erased all of yesterdays decline)
http://www.pretzelcharts.com/
"Now did you read the news today?
They say the danger's gone away.
But I can see the fires, still alight,
they're burning into the night."
-- Genesis, Land of Confusion
'In several recent articles, I've discussed some fundamental reasons why a meaningful new bull market seems unlikely, but today, for a change, I'm going to look at this from a completely different perspective and instead present yet another reason why a meaningful new bull market still seems unlikely (ha).
The following comes from a brand-new piece by The Wall Street Journal (link is to MSN's reprint of the story, for those who don't want to mess with paywalls):
The office sector’s credit crunch is intensifying. By one measure, it’s now worse than during the 2008-09 global financial crisis. Only one out of every three securitized office mortgages that expired during the first nine months of 2023 was paid off by the end of September, according to Moody’s Analytics.
That is the smallest share for the first nine months of any year since at least 2008 and well below the nadir reached in 2009, when 47% of these loans got paid off. That share is also well below the rate before the pandemic, when more than eight out of every 10 maturing securitized office mortgages were paid back in some years.
While the numbers cover only office mortgages packaged into bonds—so-called commercial mortgage-backed securities—they reflect a broader freeze in the lending market for office buildings.
Many office owners can’t pay back their old loans because they can’t get new mortgages. Remote work and rising vacancies have hit building profits, making it harder to pay interest. Higher interest rates have pushed debt costs up and building values down. That combination is fueling a rise in defaults. The share of office CMBS loans that are delinquent has tripled over the past year to 5.75%, according to Trepp...
In the first nine months of 2019, for example, 88% of CMBS office loans were paid off when they matured, according to Moody’s Analytics. As interest rates and vacancies rose, that share dropped to 71% in the first nine months of 2022 and to just 31.2% this year.
Okay, so what's the big deal? Well...troubles in the commercial real estate (CRE) sector could potentially contribute to a larger banking crisis. Here’s how:
1. Loan Defaults and Bank Losses: As CRE owners face difficulties in repaying loans due to lower rental income and higher vacancies, the risk of loan defaults increases. If defaults become widespread, banks could suffer significant losses, particularly those with substantial CRE loan portfolios.
2. Asset Devaluation and Balance Sheet Impact: If CRE property values continue to fall, this will lead to a devaluation of assets held by banks. Since these properties often serve as collateral for loans, a drop in value can weaken banks' balance sheets and increase their risk of insolvency.
3. Refinancing Difficulties: Higher interest rates make it more difficult and costly for property owners to refinance existing debt. As loans mature and refinancing becomes harder, more property owners may default, increasing the pressure on banks that provided the original financing.
4. Banking Sector Exposure to CRE: Regional banks, which have a significant exposure to the CRE market, could be particularly vulnerable. If they start to incur losses, this could lead to a loss of confidence in these banks, potentially causing depositors to withdraw their funds and creating liquidity issues.
5. Contagion to the Broader Financial System: Losses in CRE could create a domino effect where concerns about one bank's stability spread to others. This contagion can be exacerbated if investors and depositors begin to question the health of other financial institutions, leading to a broader crisis of confidence and potential bank runs.
6. Regulatory Capital Ratios and Stress Tests: If banks begin to suffer losses on CRE loans, their capital ratios could fall below regulatory requirements. This could trigger intervention from regulators and possibly result in banks being forced to raise additional capital or reduce lending, further tightening credit conditions.
7. Impact on the Economy: As banks suffer losses and tighten lending standards, this can lead to a credit crunch, where businesses and consumers find it harder to get loans. A reduction in lending can slow down economic growth, potentially leading to a recession, which would further exacerbate the problems in the CRE sector and the banking industry at large.
Therefore, while the CRE sector is just one part of the banking industry's portfolio, its troubles can have far-reaching implications, potentially triggering a larger banking crisis through a combination of loan defaults, asset devaluations, and a loss of confidence in the financial system. The interconnectedness of the banking sector means that issues in one area can quickly spread to others, leading to systemic risks.
But hey, maybe everything will work out just fine.
In Centralia, Pennsylvania, deep beneath the surface of the town, there's an old coal mine. In 1962, that mine caught on fire. At first, nothing much happened at the surface and many residents underestimated or ignored the developing danger. Which worked fine for quite a while, actually. It wasn't until the 1980s that people really began to understand the true scope of that heretofore unseen devastation -- after sink holes began opening up and swallowing sections of the town. At which point it was discovered that the ground beneath the entire town was unstable. The town was ultimately almost-completely abandoned. (Incidentally, those fires are still burning, 61 years later!)
Commercial Real Estate is one of several fires raging beneath the surface right now. As is human nature, most people (either don't know about or) are ignoring CRE and will go right on ignoring it until a sinkhole opens up in their own backyard. At which point they'll stampede for the exits. The trouble is, once "everyone" knows something, it's often too late to act. Just like the homes in Centralia, collapsing assets have little or no value once everyone has recognized the true risks.
Ironically enough, the mine fires in Centralia were initially sparked by a raging dumpster fire (essentially; it was a trash dump burn) right after a big celebration, so we can see this story has more than one parallel to today's market.
Anyway, like I said, maybe we can just ignore that and everything will be fine... or maybe the market will suddenly remember that the Fed standing still isn't going to fix this or fix bank balance sheets or fix Treasury oversupply (and so on), and that this rally is trying to launch itself from unstable ground.
If the market suddenly remembers that, the rally could end as quickly as it began. But sometimes it takes a bit of time for the market to get up to speed -- if it didn't, then there wouldn't be a market, as everything would just zip instantly to the correct value, with no zig-zagging in-between.
The big news today, though, is that SPX seems to have formed the very first clean-high impulsive decline we've seen since its target capture back in October:"

"Concurrent with this, SPX has finally cracked its melt-up channel:"

"For people new to Elliott Wave, I do want to stress that this (on the chart above) is a micro impulse down, so it's entirely possible it only leads to a small c-wave down and then resumes moving higher. But I also want to take this opportunity to point out that simply following the two signals above would have saved bears a whole lot of pain.
I want to take a moment to try to pass on a bit of edumacashun in Elliott Wave, as this is what I was attempting to outline on November 8, when I wrote:
In conclusion, there's no quick and easy roadmap in the current position, so we'll just have to watch for potential impulsive declines in real-time and take it from there. Waiting for impulsive turns can sometimes help bears stay out of trouble in the event the "straightfoward bull count" shows up, since that approach prevents one from shorting the entire ride up to new highs. It also gives one a clear stop (against the high where the (pending) first impulse down began), as opposed to the current situation, where the only crystal-clear level is way up at 4607. None of that is trading advice.
So now we have a clear stop -- i.e.- "the high where the [no longer pending, but finally actual] first impulse down began"; in this case, that's 4557.05. This is one of the ways I utilize Elliott Wave in trading (as always, absolutely nothing I write is trading advice, consult with your broker, etc.).
But as a hypothetical: For example, now we have our first impulse down, so if I shorted (for sake of illustration) 4540 with a stop at 4557.05 then (presuming I'm playing ES (e-mini SPX futures) and excepting overnight gaps) my presumed risk would be ~18 points, which is a fair bit better than losing ~450 points. It's not foolproof, and sometimes the apparent impulse is not an impulse -- but the start of the first impulse down gives one a level to act AGAINST, which serves to define one's risk more clearly and may keep one from "holding and hoping" their way into bigger losses.
I've been doing this for a long time, and when I write "there's no quick and easy roadmap in the current position," I'm giving my best read of the market -- and "I have no good read" is, for me, anyway, a signal to step back and be patient. Which is why I tried to convey that it was a good time for "waiting for impulsive turns" in order for bears to "stay out of trouble."
Anyway, this rally has been a solid illustration of why I've developed the rule of waiting for an impulsive decline (or rally, sometimes) when the market turns ambiguous.
Of note, NYA and COMPQ are both in the general ballpark (plus or minus a bit here) of resistance zones:"

COMPQ:

"In conclusion, we'll see if this apparent impulse goes anywhere, or if it turns out to be just a speedbump.
As is tradition, I'll be taking Black Friday off, since it's a half-session anyway and I don't get paid enough to work on holidays. Happy Thanksgiving to everyone! Trade safe."
"As of right now, SPX is still in the melt-up channel:"
http://www.pretzelcharts.com/
Not a lot to add to recent updates, so I'll add an interesting chart today:

"The chart above is yet another argument against any kind of meaningful bull market developing against the backdrop of current valuations. The last time market cap to GDP was this high, the market was boosted by rampant QE and government stimulus, which I believe most people agree (even bulls) fostered a bubble in equities. Is the prevailing belief really that we're headed for another such bubble? What evidence is there that the Fed intends to foster the environment necessary for such a bubble? None that I can currently see.
Chart-wise, no real change from recent updates, though I do want to stress that last update, I wasn't saying we were "for sure" in a c-wave rally, in fact I went out of my way to stress that we could very well not be. I was simply pointing out that it was the best fit for the pattern at the micro level. An interesting twist on that theme might be a WXY, wherein -- IF we are in a C-wave rally -- the next decline is the X wave, then we go on to form another ABC higher.
Anyway, it's too early to worry about that option, and I stand by my "not trading advice" from November 8, where I suggested bears might want to await an impulsive decline before getting involved with this market again. As of right now, SPX is still in the melt-up channel:"

"As a reminder, the reasonable bull count (given that we know fundamentals probably don't support a major bull market) still looks something like this:"

"And as another reminder, the "bullish for a little while but ultimately bearish" count would still be represented by the black "or (2)" above, and the red trend line below:"

"So, as I said out the outset, not much to add. Trade safe."
not lecturing
but if you want to delete my post thats fine
Jerry
Are you lecturing or are you sharing?
astonishing that the market changes so much
inverted yield curve just means little
the market is now solely based on funding
the fed juice is now the major funding tool
but the fed has still been doing qt for a few months
so this market is just incredibly strong
when the fed goes back to qe look out above
Even repo funding as a major tool is not as important
7 stocks mainly comprise the rising market
In the past that was a prescription for disaster
The fed behind the scenes can inject bilions any time they want
the recent banking crisis lasted 1 weekend.
Channeling The Energy From Lower Interest Rates
NOVEMBER 19, 2023 AT 10:21 AM
Tom Bowley
Chief Market Strategist, EarningsBeats.com
"The 10-year treasury yield ($TNX), and its recent decline, is certainly aiding, at least in part, the recent surge in U.S. equities. After hitting 5.0% on October 23rd, the TNX has been in a steady decline. As I see it, we've got further downside in the yield based on the confirmation of a head & shoulders top:"
http://d.stockcharts.com/img/articles/2023/11/19/b57bd1d2-6f8d-4b31-a95d-a5eb515c93ad.jpg
"The setup was there. The confirmation occurred on the breakdown below neckline support. The ultimate measurement beneath the neckline is equal to the distance from the top of the head (5.00%) to the neckline at roughly 4.55%. That would take us to 4.10% or thereabouts. I see a couple yield support levels at 4.00% and 4.10%, so this head & shoulders measurement would take the TNX down to this area of yield support.
This top in interest rates occurred close to one month ago. To understand which areas the big Wall Street firms are rotating to, I simply look at a 1-month summary of our Relative Industry Group ChartList, available to all of our annual members at EarningsBeats.com. Here are the groups most benefiting over the past month:"
http://d.stockcharts.com/img/articles/2023/11/19/e9663f32-6c59-4543-a21c-f2c5c70494b0.jpg
"Trade what you SEE, not what you're hearing. Most of the CNBC rhetoric is worthless. If you want to trade or invest with more success, you need to invest and trust in those interested in helping you succeed. CNBC wants you to watch or click. As brilliant as Jim Cramer is, he ain't a market technician. He waffles more than IHOP. If the stock market goes up 5 days in a row, Jim's as bullish as they get. And then we see a drop of 5 days in a row and Jim thinks the sky is falling. He has little conviction, which makes trading very difficult.
With that brief rant out of the way, look at the last month's leading industry groups. All 10 are part of our three key aggressive groups - technology (XLK), consumer discretionary (XLY), and communication services (XLC). 7 of the top 8 industry groups are in the XLY. Ask yourself one simple question. Why are the big Wall Street firms pouring their resources into consumer discretionary stocks? If you were bracing for the nasty recession that all the talking heads keep yapping about, would you be jumping into discretionary stocks with both feet? This is how we are all brainwashed by the media. WAAAAY too much time is spent on the scary stories to drive up viewership and not nearly enough time is spent on educating the masses. You don't pour your money into the very stocks that would be bludgeoned by a recession. Instead, Wall Street is prepping for a very bullish move and you should too.
The top group, by a mile, is home construction ($DJUSHB). It's somewhat counterintuitive, but you need to keep historical tendencies in mind. While you might think that the colder winter months might lead to an underperforming DJUSHB, the opposite is actually true. Check out the DJUSHB historical performance over the past 20 years:"
http://d.stockcharts.com/img/articles/2023/11/19/97988f21-b4ba-4baa-b467-81c34dbff6c8.jpg
"Now you might understand why Wall Street is secretly moving into home construction stocks. Yes, mortgage rates are dropping, but this is a 20-year history of relative performance. From the above, here are your three best months of relative performance of home construction:
January: averages outperforming the S&P 500 by 3.8%
December: averages outperforming the S&P 500 by 2.7%
November: averages outperforming the S&P 500 by 1.8%
That's total average outperformance for these 3 months of 8.3%. The other 9 months COMBINED average UNDERperforming by 4.8%. I cannot overstate the importance of historical knowledge."
I am still offering FOR FREE critical historical stats of the S&P 500. You're not going to see this on CNBC. I doubt you're going to see it anywhere. But we do A LOT of historical research at EarningsBeats.com and this information will help you trade/invest more successfully. Simply CLICK HERE and download this 7-page PDF. It's yours totally FREE.
Happy trading!
Tom
Jerry
Thanks for both posts.
I don't disagree on anything you or Dalton are saying.
Pretzel is caught in his larger belief that we are in such a deep hole with Debt/Deficit and all that goes with that, that I don't think he sees straight.
He will let go of his Bearish Count once we clear 4607, which I believe will happen before year end.......... We'll see of course in the fullness of time on that one.
Jerry I'm not posting Pretzel as means of expressing my trading beliefs on any basis.
I rarely do short term trades of any kind anymore but I did catch most of the Payroll day of huge gains
dalton week ahead
was there new business buying or just short covering
he is becoming more bullish when looking at fund managers
and he thought weak market structure would lead to selling
instead it lead to balancing
tues is fed minutes
if in doubt about market direction assume balancing unless hard 2 day continuation selling
next week is thanksgiving week
Over the last 50 years, the S&P 500 has experienced an average gain of 0.54% during Thanksgiving week, with 68% of these instances showing positive returns. This is a notable increase compared to the average weekly gain of 0.16% observed throughout the year.
so if you were a fund manager you would add to postions or initiate new ones
knowing all pullbacks are just reaccumulation
dalton
powerful bull market up move
what makes this strong. the fed has been doing minor qt
which normally means the market will have problems with any sustained up move
Inflation which is measured by truflation (2 months ahead of govt data) and is used by the FED
Has been consistently improving
Interest rates have topped and used car sales are dumping and housing is fading a bit.
Market needs to rest and reenergize. But the market will continue to surprise Beartards.
This is not a bear and has not been for months. The crash kids are looking at the wrong data.
CyclesFan @CyclesFan
$NDX - The window for the next daily cycle high is November 22-28. There are 2 possibilities: 1. keep grinding higher and top in the early part of the window, on Nov 22-24. 2. A pullback to the 10 DMA by Wednesday, then a top in the late part of the window, on Nov 27-28. pic.twitter.com/ERkqyTNv3A
— CyclesFan (@CyclesFan) November 17, 2023
$WTI - As I predicted yesterday, a multi week low is in. From here I expect a bounce to at least the 20 week MA(~83), that will be followed by a decline into the next 23 week cycle low in late January with the target being the 200 week MA(currently 68.29).https://t.co/j8h4zCkl5U pic.twitter.com/BPLMgF88YB
— CyclesFan (@CyclesFan) November 17, 2023
$SPX - It looks like the gap at 4422 won't be filled in November. I can still see a pullback to the 10 DMA but the 10 DMA will be inside the gap tomorrow, so an eventual touch of the 10 DMA will probably happen only when its already above the gap. The next top is due on Nov 24-28 pic.twitter.com/hUES4h343c
— CyclesFan (@CyclesFan) November 16, 2023
Californians Caused Late October Dip (and Rebound)
http://www.mcoscillator.com/data/charts/weekly/seasonal_nov2023.gif
http://www.mcoscillator.com/learning_center/weekly_chart/californians_caused_late_october_dip_and_rebound/
November 16, 2023
"The stock market in 2023 has been tracking the Annual Seasonal Pattern (ASP) really closely, that is until a late October 2023 extra dip in stock prices that was not on the ASP's program. Since that dip, stock prices have been rallying hard to get back on track. But why did that dip happen?
Blame Californians. I wrote here back on July 21, 2023 about how the IRS had changed the tax filing and payment deadlines for most of California, because of flooding rains in January on previously burned areas that led to a lot of flooding. This led to disaster declarations, and a ruling by the IRS that taxpayers in 51 of California's 54 counties would get an extension to October 16, 2023 for filing their 2022 taxes. That extension also included a delay in having to pay any amounts owed for 2022, plus all quarterly estimated payments in 2023.
Because of this extension, smart Californians held onto their money and their tax returns until just before the deadline, presumably earning at least money market interest rates on it, but denying those tax dollars to Uncle Sam. California has 15% of the US population, but it also has more than its share of millionaires who have the wherewithal (and the accountants) to do this sort of tax planning.
Why this relates to the stock market is that we have learned from the Fed's QE and QT episodes that having money in the banks is helpful for boosting stock prices. But when a bunch of Californians all wrote their tax payment checks to the IRS in October, that created a sudden drain in the liquidity pool. The result was an extra dip that the Annual Seasonal Pattern did not forecast."
http://www.mcoscillator.com/data/charts/weekly/deposits_comm_banks_nov2023.gif
"Once those checks got cashed by the IRS, the money eventually found its way back into the banking system, resulting in a recovery for deposits in the commercial banks. And that helped to feed a recovery in the stock market, allowing prices to get back on track with the bullish phase of the Annual Seasonal Pattern.
We can see the effect of this in the tax collections data themselves, which are published in the Monthly Treasury Statement."
http://www.mcoscillator.com/data/charts/weekly/tax_receipts_by_month_nov2023.gif
"Much of 2023's monthly tax receipts data have been running behind 2022 levels. Part of that was due to 2022 being a down year for the stock market, so there were not as many capital gains to have to pay taxes on, and 2021 had a lot of capital gains tax payments because 2021 was a nice strong up year for the stock market.
We can see in this chart that the tax collections for October 2023 were much higher than past Octobers, and this is where that extension for California filers can really be seen. The Treasury Department and White House officials were quick to attribute October's strong tax collections to a supposedly improving economy, but it was really just a bunch of Californians taking advantage of the extension that was offered to them.
One positive for stock market investors is that even with October's more robust tax receipts, the U.S. government's total tax receipts are still pretty low as a percentage of GDP, and that is very bullish."
http://www.mcoscillator.com/data/charts/weekly/tax_receipts_monthly_nov2023.gif
"When taxes are running at 16% of GDP or less, the months that follow are historically very bullish for stock prices. By the same token, getting taxes up above 18% of GDP has brought an economic recession (and a bear market) every time it has happened. The mechanism for this is that by leaving a lot more money in the economy, the government is helping to allow that money to do things like lift stock prices. It is a bit of a problem for the escalating level of total federal debt, but that is a different problem.
Now that the California tax extension issue is behind us, the stock market can get back on the task of pushing itself higher as it usually does in November and December."
Tom McClellan
Editor, The McClellan Market Report
Stock Market Commentary 11/17/23
By Lawrence G. McMillan
"On November 13th, $SPX closed above 4402 for the second of two consecutive days, which was enough to dictate a bullish stance since it was an upside breakout over resistance and over the downtrend line, as well as closing the gap from the September breakdown. Then another huge upside gap was formed on November 14th, when there was favorable CPI data.
The next upside targets would be resistance at 4510 (which has already been reached), 4540, and the 2023 highs at 4610. Beyond there, bulls can dream of an assault on the all-time highs above 4800.
On the negative side, breadth hasn't been all that great. But perhaps the biggest problem I see is that there are just too many gaps on the SPX chart. The latest one is the fourth one. It would be filled on a pullback to 4421. That is certainly possible, as the market often retests a breakout level before resuming its uptrend.
Equity-only put-call ratios are finally back on the same page: both are on buy signals now. The standard ratio moved to a buy signal over a month ago -- prematurely, to be sure. The weighted ratio was reluctant to confirm that buy signal, but finally did over the past week.
Breadth hasn't been great. If $SPX is breaking out to new relative highs, one wants to see breadth get very overbought and stay in that condition. But that has not been the case here.
$VIX has generally been staying flat with the stock market rising. The "spike peak" buy signal is still in place. Meanwhile, the trend of $VIX is now on the verge of a new buy signal of its own.
In summary, we are holding a "core" bullish position now, after the breakout over 4400. We will continue to hold that position unless $SPX were to fall back below 4370, which would indicate this whole move was a false upside breakout. That seems unlikely to happen. Meanwhile, we will trade other confirmed signals around this "core" bullish position."
http://www.optionstrategist.com/sites/default/files/SPX.JPG?v=1700245846390
http://www.optionstrategist.com/sites/default/files/PC21.JPG?v=1700245846390
http://www.optionstrategist.com/sites/default/files/PC21_W.JPG?v=1700245846390
http://www.optionstrategist.com/sites/default/files/VIX.JPG?v=1700245846390
Makes his Bear Case
http://www.pretzelcharts.com/
"SPX traded sideways since last update, so there's nothing to add on that front, but I do want to share with readers the reason I didn't immediately jump ship on the bear count.
Maybe the pattern below is NOT what it fully appears to be -- if it's not what it looks like, then bulls are in the clear. But take a gander and see if you agree that the highlighted portion of the move (in red) appears to be three waves."

"The little red abc sure looks like a classic B-wave high -- tell me if you think I'm nuts for seeing that or if you see the same thing? -- which would in turn imply the low was wave C of B, and further imply the current rally is the C-wave of an expanded flat. So that kept me from assuming the best for bulls, and still gives me pause (or "gives me paws"?) -- but maybe that's just not what it is. In any case, readers with a working knowledge of Elliott Wave know that B-wave highs and lows are "false" bottoms or tops and destined to be revisited. We'll find out soon enough if that's the case here or not.
Maybe -- and I can't stress this enough -- maybe it's just not. But I've never been able to ignore what I see, for better or for worse. In this case, the high-precision, low-tolerance nature of this count is one of the reasons why I advised awaiting an impulsive decline before getting too active with it. The bull count is not shown on this chart, but remains as previously stated. Trade safe."
"On the bull side, nothing has changed from November 8, when I wrote that their count was straightforward, that is: "ALL OF C completed at 4103 SPX and it's on to new highs (north of 4607)."
http://www.pretzelcharts.com/
"Last update, I wrote about how there had been no "big surprises" from the market in a while, but I'll readily admit that yesterday's move surprised me. I thought that, even if the rally were ultimately destined to head higher, SPX would at least pause near the 4430-55 zone. Instead, it gapped over it (which is one way that the market sometimes conveniently avoids addressing a resistance zone -- due to leverage, it's much easier to drive a rally in futures than it is to drive one in the cash market).
So, it seems I was indeed "due" for a screw up, and I got that one wrong.
That said, I do want to note that I never backtracked from my piece on November 8, when I wrote:
In conclusion, there's no quick and easy roadmap in the current position, so we'll just have to watch for potential impulsive declines in real-time and take it from there. Waiting for impulsive turns can sometimes help bears stay out of trouble in the event the "straightforward bull count" shows up, since that approach prevents one from shorting the entire ride up to new highs. It also gives one a clear stop (against the high where the (pending) first impulse down began), as opposed to the current situation, where the only crystal-clear level is way up at 4607.
Any bears who followed that "not trading advice" haven't lost a dime on this rally yet, so I hope it helped someone. I'm at least glad I published that when I did -- and even last update concluded by reminding bears that while I was leaning their way from an analytical standpoint, I wouldn't bet the farm on that, because, quote: "we don't even have an impulse down yet!"
Anyway, now we get to try to figure out what the market is actually trying to do here.
The simple answer, if you're a bull, is "run to the moon." If you're a bear, then it's the opposite. And while either of those stances is easy to say for the "perma" crowd, supporting them is the rub.
Let's start with the bull argument, which is tied to the news that became the excuse for the rally: The CPI report was released yesterday, and core inflation rose a bit less than analysts expected (they expected .3% over September, but it rose .2% instead). This, in turn, leads to the hope that inflation will continue moderating (it's a bit confusing/misleading when analysts say inflation is "falling" -- inflation is still increasing month-over-month, just not as quickly as it was before), which in turn leads to the hope that the Fed will stop raising rates, which in turn would take some pressure off the market and the economy, and maybe forestall a recession.
Core Inflation came in at 4% (in September, it was 4.1%); the Fed's target for Core Inflation is 2%. Thus, the bull argument is partially predicated on the belief that Core Inflation will continue moderating until it reaches the Fed target of 2%, prompting the Fed to declare victory and go home.
Overall inflation, which is the rate at which your overalls expand during the holidays, was 3.7% in September, but came in at 3.2% for October, largely because people ate less due to an increase in the price of food, thanks to inflation. Wait. [consults notes...] That's only partially correct (I trust my readers are smart enough to figure out which part!).
Now, the hope for bulls here is that the Fed will see all this and decide that all the numbers are headed in the right direction and thus that they no longer need to raise rates.
But here's the thing: Given the speed of this rally, bulls also seem to be hoping that the Fed will then relaunch QE while consumer debt simultaneously vanishes overnight (thus giving people a whole new clean slate of spending power) and the market will head right back into a significant bubble. Because...
(and this leads us into the bear argument)
...as we've discussed here previously, P/E ratios are not "low" by any means. To the contrary, the current P/E of SPX is now hovering near 25, which is already into "overvalued" territory. "

"For comparison, in October, 2007, at the peak just before the biggest bear market in recent history, the P/E ratio was 23.41.
Can an overvalued market get even more overvalued? Absolutely. We've seen it happen many, many times in the modern era of centrally-managed currency and interest rates. But that doesn't change the fact that the current market is not exactly a fundamentally good value.
No one is buying here because prices are low. Prices aren't low, so they're not scooping up great values in solid, beaten-down stocks.
They're buying because they're afraid that other people are going to buy before they do.
And, whether they know it consciously or not, one could argue that buyers are not only banking on the Fed ceasing their campaign of raising rates, but on the Fed cutting rates fairly quickly and probably stimulating the market again. Because P/Es rarely get much above current levels without either a bubble or a crash (in the case of trailing P/Es, where prices drop rapidly to make past earnings seem massive by comparison).
And hey, maybe that bubble will happen. Wouldn't be the first time. But that's at least part of the bear argument.
Let's take a look at oil. So far, oil is bouncing off its downside inflection zone (usually my identified inflection zones work, unlike SPX yesterday!). Equities bulls probably need to also be oil bears (since bullish oil drives inflation higher), and oil bears probably need to see a sustained breakdown at the rising blue line, for starters -- though I haven't updated the annotation since the prior warning, since I literally can't fit anything else on this chart without deleting something, and that seems unnecessary right now."

"Next, let's look at COMPQ, which outlines the most obvious bull option. The most obvious bull option is a simple straightforward fifth wave to new highs currently underway. This would jive (for a reasonable bull case, that is) with what we're seeing from a fundamental standpoint, suggesting that even if COMPQ makes a new all-time high, it's not the start of a big new bull market, it's the end of one. Of course, that's the most bearish interpretation of the bull count, but also the one that requires the least speculation.
COMPQ seems to be heading toward the "or (2)," which I placed on the chart on October 26, but now regret not discussing in more detail at the time. While I make every effort to remain as objective as possible, I'm human too and am not magically immune from getting swept in by the prevailing sentiment, though I suppose I should see if it even reaches that before browbeating myself too much."

"For SPX, we're just going to look at a simple chart for now. For the past week-plus, I felt confident enough that the market was headed higher to publish the chart with blue ii/4 overhead (above then-current prices), but now that we've passed that zone, we're into a sort of no-man's land as far as I'm concerned. So I'm not going to publish a chart that suggests we're headed to X zone next, because I just don't have that read to offer right now."

"In conclusion, there are still bear options here, but obviously, bears will need to show they have even a little firepower to stop this thing for more than 10 minutes, and thus bears should still continue to await an impulsive decline before stepping in front of this steam train (not trading advice). On the bull side, nothing has changed from November 8, when I wrote that their count was straightforward, that is: "ALL OF C completed at 4103 SPX and it's on to new highs (north of 4607)."
Trade safe."
give tim ord his attaboy
as i posted his video
he said historically 100 pct chance
new high in 5 days
post on 11/10
Thanks RCKS..It sure is tough trading right in this area. I thought today might be a good down day..But another chop whipsaw...or whiplash maybe..Anyway good to have an ewave projection.. I know most of the indicators fail when you actually depend on them.Anyway we may have hit the HOD here...But if I posted this on my sight it would ramp .
"....I'm open to larger bull options here, the market is still operating within the tolerances of "bear" price territory."
http://www.pretzelcharts.com/
"On Friday, SPX made a new high for the move, putting it smack at the blue ii/4 label. We have an interesting situation now. By all rights, this should be an inflection zone (the zone stretches a little higher), so this is going to be the first real test of this rally.
I say that because, while many folks look primarily at indicators (which are often derivatives of price) -- and I agree those can be useful at times -- my philosophy has always been that price trumps everything. And since the current SPX price is not unexpected (as indicated by the label being there before the market was! In fact, one could say this price was largely "expected"), now we have to see if and how the market reacts to this zone. That will give us further information.
So, while I'm open to larger bull options here, the market is still operating within the tolerances of "bear" price territory."

"Next, it's interesting that NYA (representative of the broader market) is still below its high from roughly a week ago, so the broad market is not participating to the same extent so far."

"In conclusion, there have thus far been no big surprises for a while -- the market declined to where it was supposed to, then rallied after capturing its target. That was all expected (though the rally did exceed the expectations I had back before we even started rallying, I immediately adjusted those expectations when they were met) -- actually, before we close this, let's take a quick stroll down memory lane:
While we (myself and my readers) were looking lower (big picture -- near term, we had some upside target captures) for a while before September 22, I had mainly been painting that in broad strokes, and I think that was the first day I published the "official" exact target of 4090-4115 SPX. Which was 300 points lower than SPX:"

"SPX had just about reached that target by late October, so I began warning both verbally and visually. At that point, the visual warning "only" indicated a bounce to ~4340 (~240 points up from the downside target zone -- ~540 points total in both directions now)."

"Then, as SPX reached that upside target, it became apparent it was heading higher, and I changed the label to "ii?" (added the "/4?" two updates later) and raised it to its current zone:"

"And that's where we find ourselves today. So maybe I'm "due" to be wrong (because I am still leaning toward bears, though not in a "bet the farm" sort of way at this point -- we don't even have an impulse down yet!) and this rally will smash records and we'll all live happily ever after. But I do want to see how it behaves here first. Trade safe."
Soaring Semiconductors Carry NASDAQ To Key High; A Solid Trade Off An Earnings Gap
NOVEMBER 12, 2023 AT 12:24 PM
Tom Bowley
Chief Market Strategist, EarningsBeats.com
http://stockcharts.com/articles/tradingplaces/2023/11/soaring-semiconductors-carry-n-265.html
"It was another very solid day on Friday, this time with the S&P 500 powering above 4400 and the NASDAQ 100 busting back above 15500, both clearing key price resistance levels that effectively end the series of lower highs and lower lows from the July high. The best news of all is that growth continues to be the driver behind market strength. On Friday, the Dow Jones U.S. Semiconductor Index ($DJUSSC) jumped another 3.7%, rapidly approaching the July and all-time high of 10430. The DJUSSC needs only another 2.6% gain to break to yet another all-time high:"
http://d.stockcharts.com/img/articles/2023/11/12/3fc0fdc1-7787-4170-9b0c-f2e84cc9b54a.jpg
"Notice that the RSI has now moved back through 60, showing more bull market readings and behavior. The green arrows mark RSI support in the 40-50 range during secular bull market advances. The two bear markets, one in 2020 and the other in 2022, saw the RSI fall well below 40. The behavior in the RSI right now is absolutely bullish.
I do a TON of research during earnings season, highlighting key earnings gaps where we tend to see successful tests and reversals. While we've seen several nice gaps higher in semiconductors, here are two outside that group that occurred recently:
DASH
DoorDash, Inc. (DASH) recently reported the following revenues and EPS:
Revenues: $2.16 billion (actual) vs. $2.09 billion (estimate)
EPS: -$0.19 (actual) vs. -$0.45 (estimate)
After blowing away estimates, DASH gapped up 12% from 75.90 to 85.09. After reaching an intraday high of 93.19 the next day, DASH fell back and tested the top of gap support at 85.09 on Thursday. On Friday, DASH jumped off of gap support to the tune of 3.48%. While a drop to the rising 20-day EMA is certainly a possibility, I believe we'll see DASH breaking out above 93 in the not-too-distant future:"
http://d.stockcharts.com/img/articles/2023/11/12/8ead821f-b2ed-49ff-bbf1-43de80fece82.jpg
"The internet group ($DJUSNS) has been another very bright industry group, easily outperforming the benchmark S&P 500 throughout 2023. So DASH is not only a stock that crushed revenue and EPS expectations, but it hails from one of the best industry groups of 2023.
DASH hasn't had a long history as a public company, but it has performed well in November as you can see from the seasonality chart below:"
http://d.stockcharts.com/img/articles/2023/11/12/3f817cd5-96a3-4627-a219-7ac7538656ed.jpg
"The average November gain is at 14.1%, which is higher than any other month of the year. Again, there's not a lot of history to go on here, but DASH does at least show a tendency to move higher this time of year. December hasn't been all that bullish, but January is the 2nd best month of the year for DASH. I like to see earnings-related technical breakouts line up with seasonal tailwinds. DASH does exactly that."
If you haven't already taken me up on my offer to download my Bowley Trend seasonality PDF, please do so. Learn the long-term historical tendencies so that you can better time your trades. There's one period - the same days - every month that represents roughly 1/3 of the calendar month, but have produced more than 80% of the S&P 500 gains. If you're not taking advantage of this historical pattern, it'll be much more difficult to beat the S&P 500. You can CLICK HERE to download your FREE COPY of my Bowley Trends PDF to better understand history and to improve your trading results. By signing up, you'll also receive my EB Digest newsletter on Monday that features a stock likely to surge higher into its earnings report in December. Be sure to check it out, along with the PDF!
Happy trading!
Tom
market inventory is just so important
market profile101
the job of the news oriented liquidation break is to take out sellers and strengthen the market
Inventory got too short and the market sees this and punishes those
who spout yield curve or bearish EW wave 3 calls
does prechter have any relevance at all. how much money does he manage
the world changes and the past is gone and this is a new world
the old concepts just do not work much anymore
QQQ Breaking Out Again; Watch This Key Component Stock As It Breaks Out Too
NOVEMBER 10, 2023 AT 01:45 PM
Tom Bowley
Chief Market Strategist, EarningsBeats.com
http://stockcharts.com/articles/tradingplaces/2023/11/qqq-breaking-out-again-watch-t-605.html
"I've already pointed out that I believe the July through October correction is over. I'm sticking to my earlier convictions that we'll experience a very strong finish in 2023, breaking out to all-time highs later in Q4 or sometime in Q1 2024. Growth continues to power forward and, after a potential right shoulder forms, I'm looking for the 10-year treasury yield ($TNX) to further support a strong Q4 finish by breaking down out of its topping head & shoulders pattern:"
http://d.stockcharts.com/img/articles/2023/11/10/be6e1edc-c9f9-4eec-8621-569d5db1ee1b.jpg
"A symmetrical head & shoulders topping pattern would print if the TNX reaches 4.80% - equal to the 4.80% top at the left shoulder. A pattern doesn't have to be symmetrical, but if it is, more technical traders will recognize and act upon it. As you can see, the measurement would likely take the TNX back to 4.10%, or thereabouts. Perhaps this is one reason why traders are jumping all over the growth-oriented NASDAQ 100 ($NDX) right now:"
http://d.stockcharts.com/img/articles/2023/11/10/0f5cb0a7-0ed7-41ea-b53a-6ab73468c9c2.jpg
"Today's price action has easily cleared Point 4 price resistance, effectively ending the downtrend since July. This confirms my earlier signals that told me this correction would not last and certainly wouldn't morph into bear market selling to take us back to the October 2022 low. Also, check out the RSI panel at the bottom of the chart. RSI 60 can serve as a brick wall of resistance when we're downtrending, but history tells us that when the RSI pushes through 60, there are much stronger odds that the downtrend has ended and a new uptrend has started.
As the NDX has made a key reversal, I generally find it helpful to see which stocks are showing strength and providing leadership. Over the past month, here are the Top 10 stocks in the NASDAQ 100:"
http://d.stockcharts.com/img/articles/2023/11/10/ac45581d-5a72-4982-86e0-721ee74a47c5.jpg
"The 3rd stock on this list, Broadcom, Inc. (AVGO) is worth discussing further. Recently, I published a PDF that provides anyone interested in the historical pattern of the S&P 500 during the current secular bull market (since 2013) and how 16 individual stocks have fared as well. AVGO is one stock that LOVES the second half of Q4, probably because it runs higher into its quarterly earnings report. Unlike many of the stocks on the NDX, AVGO reports in the 3rd calendar month of each quarter, so their pre-earnings run typically occurs later than others. I believe that pre-earnings run is underway right now:"
http://d.stockcharts.com/img/articles/2023/11/10/ef5d86ad-6b48-45ab-a72b-9b3b54498b80.jpg
"Semiconductors ($DJUSSC) are trying to break out and AVGO happens to be one of the leaders driving prices higher in this industry. Given its historical bullishness into earnings and today's breakout, if it holds, I see AVGO running higher. Seasonal trends, while not my primary reason for buying and selling, do offer us up information that most traders don't have access to. Be prepared."
If you'd like to claim your FREE COPY of my Bowley Trends seasonal PDF, it's very simple. CLICK HERE to provide your name and email address. Be sure to hit that Download button and we'll immediately send you what I believe will be a major game changer. You won't ever look at the stock market the same. Get back at the big, manipulative Wall Street firms and understand their tricks, so that you too can profit from them!
Happy trading!
Tom
Stock Market Commentary 11/10/23
By Lawrence G. McMillan
'The big rally that took place the week of October 30th saw $SPX rise from the lower downtrend line of its current bearish phase to the upper downtrend line. That rally was spurred by oversold conditions and a very favorable seasonal trading pattern. But those are no longer in place, and now the rally has run into trouble. Not only is that downtrend line representing resistance, but there are a couple of other things to deal with: one is the gap that still exists from September. It would be closed if $SPX were to rise above 4401.60. Another is the resistance presented by the highs of October, when that rally ran out of steam at essentially this same place just below 4400. If $SPX cannot decisively break through 4400 (and hold that breakout for two consecutive days), that would be bearish. If the bears take control again, and they may already have, $SPX could retreat to the lower downtrend line, near 4100. Those three small gaps on the $SPX chart that were left in the wake of the afore-mentioned rally would probably all need to be filled the lowest one of which is at 4195. The bottom line on the $SPX chart is that it is still in a bearish mode because of the downtrend lines that are in place. Until the pattern of lower highs and lower lows is broken, this will be a bearish chart.
Equity-only put-call ratios display the disparity in the market as well as anything. The standard ratio (Figure 2), rolled over to a buy signal in early October. That was way too early, but with the recent rally, it doesn't look as bad now. Meanwhile, the weighted ratio correctly refused to roll over to a buy at that time and remained bearish as the market continued lower. However, now the weighed ratio is still on a sell signal, even though the market has rallied.
Market breadth continues to swing wildly from one side to the other. The breadth oscillators were extremely oversold at the end of October, which helped to propel that rally. During the rally, the breadth oscillators reached overbought territory -- which is fine when $SPX is breaking out. Except that the breakout never occurred, and when $SPX began to trade sideways for the last four days, breadth deteriorated badly. Thus, the breadth oscillators are back on sell signals again. That was quick. This deterioration in breadth seems like a death blow to the rally (my opinion only).
Volatility indicators have turned more bullish for stocks. The $VIX "spike peak" buy signal is still in place, and it has a couple more weeks to run. Meanwhile, the trend of $VIX sell signal -- which was registered in mid-October (circle on the chart in Figure 4) has been stopped out, since $VIX has fallen back well below its 200-day Moving Average. This is not a buy signal, though, because the 20- day MA of $VIX would also have to cross below the 200-day MA for that to occur.
In summary, we are still holding a "core" bearish position (albeit with out-of-the-money puts) because $SPX is still in a downtrend. It seems that $SPX is going to make a fairly large move one way or the other. A breakout above 4400 should have traders' eyes set on all-time highs once again (are at least the yearly highs at 4600), while a breakdown should see move below 4200 in short order. Thus, straddle buys might not be a bad idea, especially with $VIX below 15. Meanwhile, we will trade confirmed signals as they occur."
http://www.optionstrategist.com/sites/default/files/SPX.JPG?v=1699643519700
http://www.optionstrategist.com/sites/default/files/PC21.JPG?v=1699643519700
http://www.optionstrategist.com/sites/default/files/PC21_W.JPG?v=1699643519700
http://www.optionstrategist.com/sites/default/files/VIX.JPG?v=1699643519700
want to learn something
tim ord
"..........the market is now flirting with the first bear inflection zone, so it will be interesting to see what happens from here."
http://www.pretzelcharts.com/
"Yesterday, Chairmanpersonguy (apologies to those who are offended by "gendered" language; the proper gender-neutral term is "chairmanpersonguypeople" but it's too long to type all the time) Powell spoke and, while I have no idea what he said (I didn't listen and don't feel like looking it up right now), the market clearly didn't like it. I like to imagine that he harshly scolded the market for being out of touch with reality, but it's probably more likely that he simply mumbled "tools" a whole bunch of times before belching loudly and without apology, and then spun on his heel and left without taking questions.
No change from the past few updates, but a few interesting charts worth looking at, starting with the very long term SPX chart:"

"Next is the near-term SPX chart. SPX is into the lower edge of the first inflection zone for these counts, so a reversal is possible (not guaranteed) anytime in here."

"IT, my broad-strokes view is unchanged for now:"

"Next, NYA rallied straight up to the price zone where I'd originally drawn red 2, though decidedly faster than drawn. If it were to become a two-legged rally, that would stretch it sideways/up and add more time to the pattern (but again, this is "easy as cake" territory, so that's not for certain either and an immediate end isn't impossible):"

"Finally, oil is getting into the general ballpark of three waves down after being rejected at the ~8 month-old red b-wave label, which proved to be both a strong magnet and strong resistance. It's uncertain if the drop in oil wants to become five down or not, but if not, this is the upper edge of the general zone where a bounce could begin:"

"In conclusion, no change from recent updates, but the market is now flirting with the first bear inflection zone, so it will be interesting to see what happens from here. Trade safe.
p.s.- okay, I finally looked it up so you don't have to and Powell was hawkish in his speech yesterday. So, I wasn't far off in one of my guesses about his speech, though I'm still not sure which one."
"For bulls: ALL OF C completed at 4103 SPX and it's on to new highs (north of 4607)."
For Bears, far more complicated...
http://www.pretzelcharts.com/
"SPX rallied a bit more since last update, which is no surprise, but it occurred to me that it might be helpful to spell out the options with a bit more clarity. I've been doing this so long that I sometimes forget to convey information that I take for granted. So let's focus on that today.
The two main options from here are:
1. For bulls: ALL OF C completed at 4103 SPX and it's on to new highs (north of 4607).
2. For bears: The recent decline was a nested first wave and the current bounce is a nested second wave. In full disclosure, the argument against this version of events is that the prior wave extended 1.618 times the A/1 wave, which is common behavior for C waves, not as common for nested first waves. The arguments in favor are more fundamental than technical.
The bull option is straightforward, so there's no need to discuss it further.
The bear option breaks down into a couple of suboptions, which I've attempted to roughly sketch (don't hold me to these, because where we are is not this predictable) on the following two charts.
Bear suboption 1 is simply "run it up as fast as we can, then run out of gas like an unsuccessful test rocket":"

"Bear suboption 2 is to drag things out for a while by forming a two-legged bounce:"

"So bears should keep in mind that even if everything goes their way, the market can always grind along for a while, and could even give bulls something akin to a false Santa Rally.
I also wanted to quickly update the TLT chart. My warning from October 23 proved quite timely:"

"In conclusion, there's no quick and easy roadmap in the current position, so we'll just have to watch for potential impulsive declines in real-time and take it from there. Waiting for impulsive turns can sometimes help bears stay out of trouble in the event the "straightfoward bull count" shows up, since that approach prevents one from shorting the entire ride up to new highs. It also gives one a clear stop (against the high where the (pending) first impulse down began), as opposed to the current situation, where the only crystal-clear level is way up at 4607. None of that is trading advice. Trade safe."
Why We're Going Higher And Two Necessary Steps To Become A Better Trader
NOVEMBER 05, 2023 AT 11:29 AM
Tom Bowley
Chief Market Strategist, EarningsBeats.com
"Trading isn't easy. It requires knowledge, experience, patience, discipline, risk management, preparation, research, and sometimes just old-fashioned good luck! After recognizing several cautious signals back in July, EarningsBeats.com suggested exercising patience to get us through whatever lied ahead. Well, hindsight now tells us that it was a correction. From high to low, here are how our major indices and sectors fared:"
http://d.stockcharts.com/img/articles/2023/11/05/f0eddb6a-ed08-4671-9381-f1805676242d.jpg
"Look at where the relative weakness was found throughout this correction. 3 of the bottom 4 sectors were defensive groups - XLP, XLRE, XLU. These are "safety" sectors. One aggressive sector (XLC) outperformed all others. Two others - XLF and XLK - were "middle of the pack". This correction did NOT see a mass exodus away from aggressive stocks.
Before I go any further, let me show you the difference during the 2022 cyclical bear market. Here's how our major indices and sectors performed from the start of this bear market in early-January 2022 through late-February 2022:"
http://d.stockcharts.com/img/articles/2023/11/05/8baef481-235d-4ad6-8ece-0b8d078f1e44.jpg
"Check out the bottom index and also the 3 bottom sectors. Doesn't that tell us a little different story? There was mass exodus OUT of key aggressive areas. Why? Because Wall Street had no interest in these groups and rotated away from them as the big firms saw further weakness ahead. That same message does not apply to this correction and that's one big reason why I kept saying we were going to see a very strong Q4 once this selling ended.
Could last week have sent a more powerful message? Here's how our 11 sectors performed during that massive buying spree:"
http://d.stockcharts.com/img/articles/2023/11/05/ad87bc3f-ae8e-4f66-a924-d3239ab8ae67.jpg
"So on the way down, the aggressive sectors held their own. But on the first significant rally, our 5 aggressive sectors - XLK, XLY, XLC, XLI, XLF - were all in the top 6 sectors. Only the ridiculously-oversold real estate sector beat these aggressive areas. Again, the story that this relative price action is telling us is that the prior selling episode was temporary is now OVER! It's just a matter of whether you prefer to listen to CNBC or the charts. I'll take the latter, thank you very much.
I wanted to give you the backdrop of the market environment the last 3 months - as I saw it. There are plenty of other signals I use to call likely market direction, but relative performance is a big one. Recently, I shared with members how difficult it's been for me to trade individual stocks since July. I haven't traded a lot, but when I have, it usually ended poorly. That changed in a big way this past week. I stuck mostly with ETFs tracking the major indices, but I re-introduced leveraged ETFs to take full advantage of last week's surge. Patience is key to maximizing returns and outperforming the benchmark S&P 500.
My best individual stock trade last week was easily NVIDIA Corp (NVDA). There were 2 important developments that created an absolutely awesome trading opportunity. The first one was the hammer candlestick that formed on Tuesday:"
http://d.stockcharts.com/img/articles/2023/11/05/bcb4e33c-a699-4441-a9d4-d6397f82d5a6.jpg
"A hammer with an intraday breakdown below key price support is powerful. But perhaps even more powerful is NVDA's seasonality. As most of you probably know, I'm a stock market historian and am well aware of seasonal patterns on our major indices. Well recently, I decided to take it another step further and analyze key trends in many individual stocks. What I found was AMAZING! Perhaps the craziest stat I found on NVDA is that it LOVES its earnings months. That sets it apart from most large cap stocks, because most large companies report quarterly results in the first month of each calendar quarter. So the norm is to report during January, April, July, and October. But NVDA is different and reports during the second month of every calendar quarter. That means its earnings are released during February, May, August, and November (green-shaded areas above). Of all the individual stocks that I analyzed, NVDA had the strongest average annual return at 59.83%. That's amazing in itself, but listen to this. NVDA's annualized return for its 4 earnings months are its 4 best of the year. Check out these annualized returns:
February: +82.25%
May: +117.69%
August: +80.31%
November: +96.89%
Sounds like 4 pretty decent months to own NVDA historically. Knowing this information and then seeing that October 31st hammer at major price support and just before its historical November strength suggested an excellent time to enter this trade. So I entered. NVDA shot up nearly 50 bucks over the past three trading days. That's the potential power when you combine (1) a bullish technical setup with (2) a bullish seasonal period. There are also bullish tendencies for ALL stocks during the early part of calendar months."
Listen, EVERY SINGLE TRADER should know basic historical tendencies regarding the monthly calendar. It will help in your trading. You'll also find these trading patterns to be simply amazing! And many of you have been loyal supporters of mine and EarningsBeats.com over the many years that I've writing here at StockCharts.com. So I'd like to make you a one-time FREE offer to download "Bowley Trends Part 1: Long-Term Trends Since 1950". Keep it as a personal gift from me, a thank you for your readership here in Trading Places. CLICK HERE to immediately download your free copy!
Happy trading!
Tom
Thanks RCKS...Maybe we have too many Bulls right now??
"....a Zweig Breadth Thrust Indicator (was Triggered)"
http://www.pretzelcharts.com/
"On Friday, the market continued rallying. Several members of the forum pointed out that this triggered a Zweig Breadth Thrust Indicator, which is a rare signal that's triggered when the market thrusts its breath so forcefully that it wheezes, which makes a noise that sounds like "Zweeeeeig!" That wheeze is a buy signal. (Or something like that.)
Investopedia defines it slightly differently, stating:
"The Zweig Breadth Thrust Indicator is a calculation that measures the swiftness of market sentiment shifts. It was developed by American stock investor and financial analyst Martin Zweig. The calculation is based on the ratio of advancing stocks to the total number of stocks. It is calculated by dividing the 10-day moving average of the number of advancing stocks by the total number of stocks. The indicator is used to identify major shifts in the primary trend."
Of note, that piece wasn't written over the weekend, but was published April 12, the last time the market triggered this exact same buy signal. Which was of course in the wake of the "Banking Crisis Averted! (for now)" action from the Fed, which suggests the signal can be triggered by short-covering rallies that shift sentiment.
As I noted on the forum, one thing worth noting is that the forward P/E ratio of the SPX is currently 18.62, which isn't exactly low, and which suggests that if the market were to turn into a new bull from here, that would not be based on fundamentals, but would instead be a new bubble. Which isn't unheard of, obviously, we've had plenty of bubbles in the past -- but which may be a stumbling block for the Zweig Breadth Thrust Indicator, as the only other time it triggered with the forward P/E ratio this high was -- you guessed it -- back in April of this year.
So, maybe it's a good signal and we'll be marveling at it a few months from now -- but unlike many of the previous successful signals throughout history, this one seems to lack fundamental support.
Anyway, just one chart today, where I updated the labeling to match the annotation from the prior update. Note that SPX hit the blue resistance line on Friday, so that's its next hurdle."
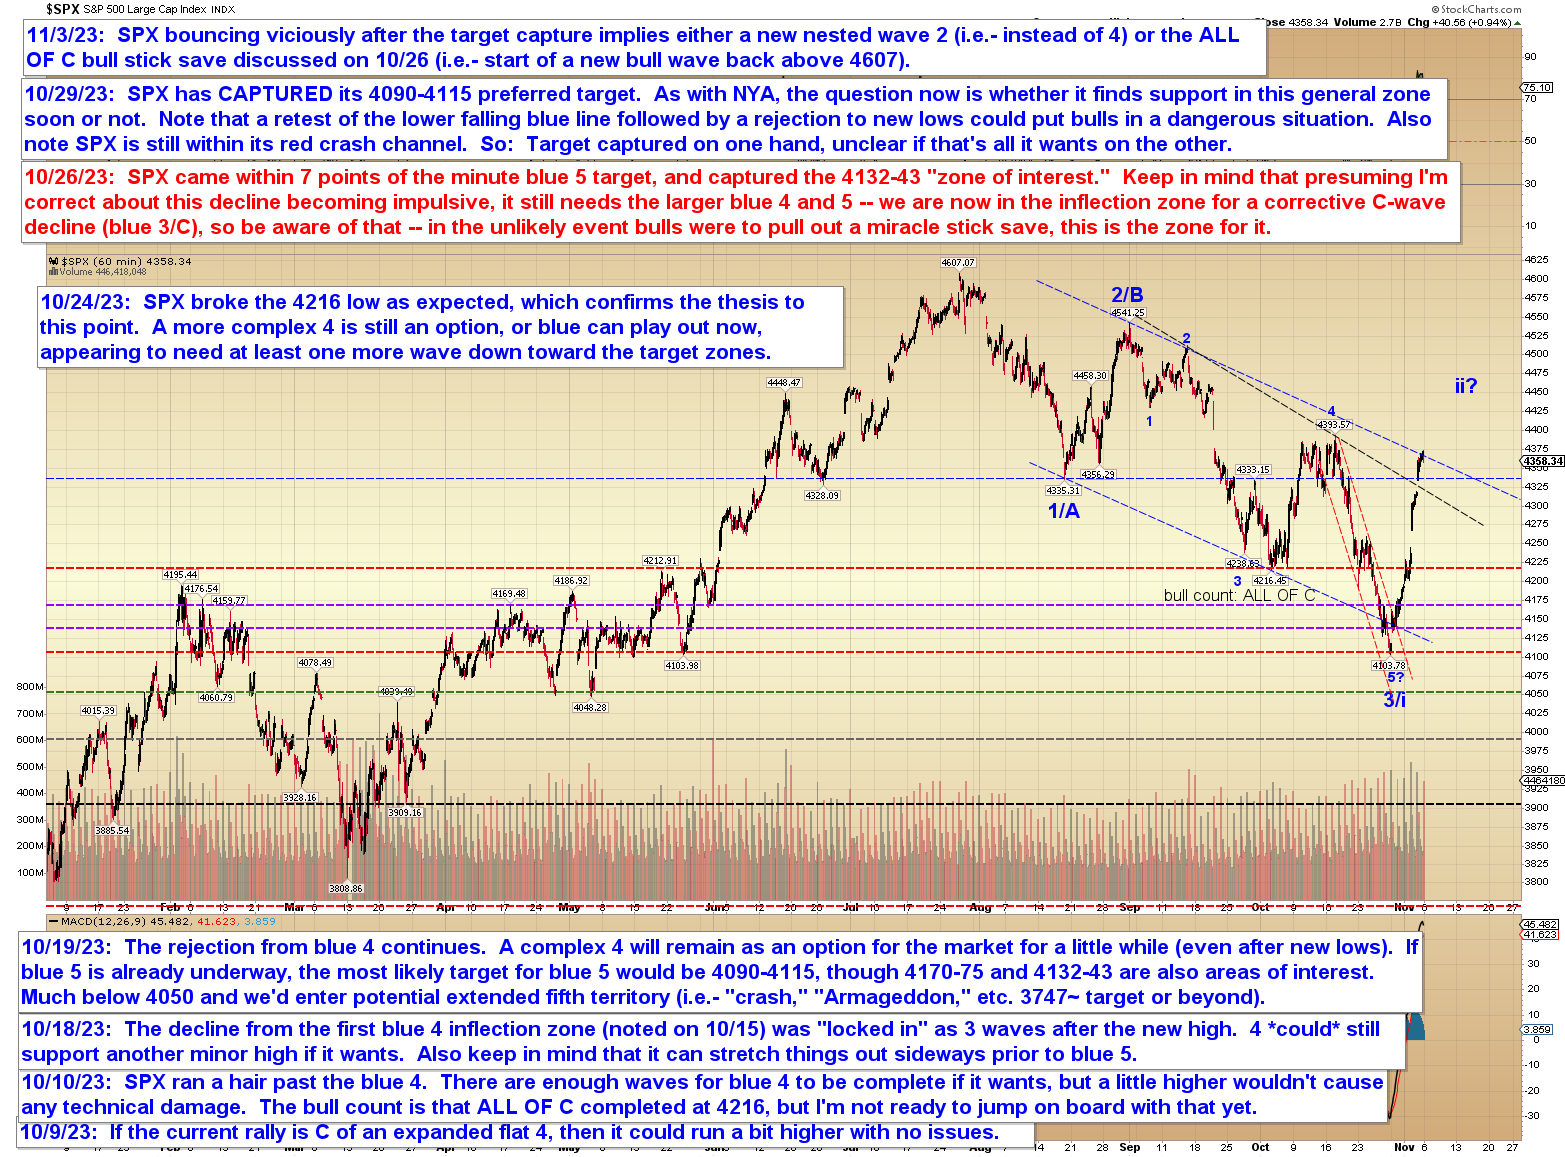
Not much to add beyond that. Trade safe.
Stock Market Commentary 11/03/23
By Lawrence G. McMillan
"Stocks did an abrupt about face this week and have rallied strongly every day. At first, this rally was propelled by some strong oversold conditions and the fact that $SPX had bounced off its lower downtrend line. But as the week wore on, reports from the FOMC meeting and the Unemployment statistics emboldened investors who care about such things. This was all taking place during what is arguably the strongest seasonal pattern of the year.
Some of those things are out of the way now, especially the oversold conditions and the seasonal pattern (it ended at the close of November 2nd). So, what remains is the downtrend line on the $SPX chart. The red lines in Figure 1 still show that the pattern of lower highs and lower lows is intact. There are several factors near the 4400 level that may be important in the coming days. So, if $SPX can break out decisively above 4400 and hold that breakout for a couple of days, that would be very bullish. In fact, it would warrant taking a "core" bullish position and abandoning the bearish one.
Put-call ratios are still somewhat split in their outlooks. First, the standard equity-only put-call ratio (Figure 2) remains on the buy signal it generated in early October. That buy signal was certainly premature, at best, and just downright wrong at worst. Meanwhile, the weighted equity-only ratio (Figure 3) has correctly remained bearish. Of these ratios, we usually value the weighted ratio the most, so we are watching that carefully. A rollover to a buy signal by that ratio accompanied by an $SPX breakout over 4400 would be a very bullish combination.
Market breadth is just the most fickle indicator there is, often being subject to whipsaws. Both breadth oscillators were deeply oversold and took some time getting to buy signals, but they are on buy signals now.
The indicators surrounding $VIX have been interesting to watch. The $VIX "spike peak" buy signal, which occurred on October 24th. It is still in place.
For the time being, we are continuing to carry a "core" bearish position, but would relinquish that if $SPX can decisively break out over 4400. Meanwhile, we will other confirmed signals around that "core.""
https://www.optionstrategist.com/sites/default/files/SPX.JPG?v=1699193206087
https://www.optionstrategist.com/sites/default/files/PC21.JPG?v=1699193206087
https://www.optionstrategist.com/sites/default/files/PC21_W.JPG?v=1699193206087
https://www.optionstrategist.com/sites/default/files/VIX.JPG?v=1699193206087
SPX bouncing viciously can mean a new wave 2 or completed C wave down and we're off to new highs
http://www.pretzelcharts.com/
"Apparently it was "that simple" as SPX finally committed to bouncing solidly after capturing its downside target and inflection zone. In fact, the bounce is now close to wave 1/4 overlap territory, which would suggest the bounce is either another 2nd wave or the ALL OF C bull option discussed on 10/26:"

"Next resistance is fast approaching (blue rising line), so we'll see if that zone can slow the bounce or not:"

"Not much to add beyond that. Trade safe."
"....how the market reacts (to the FED) will probably determine whether a higher-degree bounce plays out now or not."
http://www.pretzelcharts.com/
"Not much to add to the past few updates. SPX and NYA have both continued to bounce from their target/inflection zones. A day late for Halloween, but today is still a Fed day nevertheless, and how the market reacts will probably determine whether a higher-degree bounce plays out now or not.
SPX:"

"NYA has rallied to the lower end of the blue circle:"

"In conclusion, nothing really to add. Trade safe."
A Soft Landing Is Starting To Look Much More Likely
OCTOBER 29, 2023 AT 01:31 PM
Tom Bowley
Chief Market Strategist, EarningsBeats.com
http://stockcharts.com/articles/tradingplaces/2023/10/a-soft-landing-is-starting-to-927.html
"Since the 2020 pandemic, we've seen many relative leaders come and go. I've found the most difficult part of trading/investing these past few years to be trusting the relative strength we see. Rotation is normal as we move through various economic cycles, but trying to zero in on which economic cycle we're actually in hasn't been easy. As a perfect example, look at Q3 GDP, which was just released last week. The first estimate of Q3 GDP was 4.9%, the highest quarterly GDP reading since late 2021. One major fear with regard to U.S. equities is that we were setting up for a "hard landing", or a recession, due to the very hawkish Fed and an expected decline in consumer spending. But with inflation dropping sharply over the past year and GDP accelerating instead of declining, I believe it's difficult at the moment to argue a hard landing. The U.S. consumer is very resilient, despite the series of rate hikes from the Fed. All of this may change the Fed's anticipation of rate cuts in 2024 altogether. If you recall from their latest meeting, they announced only 2 expected rate cuts in 2024, down the previous 4. But now, with the consumer showing resiliency and GDP rising, the Fed will have less reason to cut rates. Let's also keep in mind that inflation continues dropping and remains on a path headed towards the Fed's 2% target. So the Fed could remain on pause, with the path to a soft landing becoming clearer and clearer.
Where does all of this leave us?
Well, a Fed pause in hiking rates combined with falling inflation and rising GDP, could be a catalyst to much higher U.S. equity prices in the weeks and months ahead. That's speculation, however, and we must see the technical conditions of our key indices change for the better. While the soft landing proponents may grow in confidence after last week's GDP, that same confidence has yet to appear in the charts. Here's the S&P 500's daily chart for the past year:"
http://d.stockcharts.com/img/articles/2023/10/29/d9301efc-6f45-4651-8dd4-88609f62fc17.jpg
"Volume has been accelerating to accompany a steep drop in price. Listen, nothing is bigger to me than the combination of price and volume. And it couldn't be any clearer to me that short-term technical conditions are extremely bearish right now. BUT, I have several secondary signals that tell me to look for a bottom, which could be rapidly approaching. A capitulatory-type move could mark a major bottom, especially with the Volatility Index ($VIX) breaking above 20 and stubbornly remaining there. It's never easy to predict where an ultimate top on the VIX might occur, but what IS clear is bottoms do occur when the VIX tops. That's why I believe capitulation will likely be needed to mark that VIX top and S&P 500 bottom. The fact that we're now at the bottom of the S&P 500's current channel says that a market bottom could happen ANY day. I'm awaiting a big intraday reversal on heavy volume where a hammer, doji, bullish engulfing, or piercing candle appears. Until then, it's difficult to risk capital on the long side. Also, a reversing candle then provides a level to keep a stop in place to help manage risk. A reversing candle should not be breached intraday, but especially on a closing basis.
I like to look ahead at upcoming earnings, searching for companies that might be overlooked as they approach their quarterly earnings dates. There will be one very interesting earnings report out this week in the consumer discretionary area. The strong GDP was, in large part, due to a strong consumer. I wouldn't be surprised if there's a HUGE earnings surprise in this discretionary stock and, quite possibly, a very bullish gap higher. I'm featuring this stock in our FREE EB Digest newsletter on Monday morning. If you'd like to receive it, simply SIGN UP here and enter your name and email address. There's no cost and no credit card required."
Happy trading!
Tom
"....SPX captured its preferred target zone for Wave 5 of 3/C, so it's entirely free to bounce in a decent reaction rally now."
http://www.pretzelcharts.com/
"On Friday, SPX captured its preferred target zone for Wave 5 of 3/C, so it's entirely free to bounce in a decent reaction rally now. But -- just in case -- because we're into potential "crash window" territory (not something I say often), today we're also going to discuss some of the "But what if it's not that simple?" options.
Let's start with NYA, which has behaved like a champ (at least, if one has been following the ongoing targets and wave counts listed in these updates, it has):"

"Next, we'll look at SPX:"

"On the NYA chart, I mentioned the option of "just a LITTLE lower," and this is because nailing down the exact end of fifth waves isn't always as simple as "well, it captured the target, we can all go home." So, there's an in-between option that isn't as dramatic as the fifth wave extension, but that still delays bulls from any warm and fuzzies yet. The chart below discusses one such potential:"

"COMPQ hasn't quite invalidated the diagonal from a technical standpoint, but I ultimately continue to favor the bears, as I have for the past few months."

"Finally, the SPX "roadmap" chart continues to track well, and time and price have again collided to keep SPX riding right along the blue line:"

"On the chart above, it's worth a brief mention that SPX has not quite overlapped the a/1 high, which sits at 4101. Overlap there is going to take some of the wind out of bulls' sails, and I would expect once it happens, the previously bullish Elliotticians will get on the bear bus (unless they're hopeless permabulls) -- if they haven't already done so with the overlap at blue b (which is where most of them probably think the wave 1 peak is). This will be annoying, because I hate when everyone agrees with me, especially when it comes to trading. But it's a necessary evil, I suppose, though it may lead to the market throwing some kind of curveball to try to shake everyone again.
I mention this because it's one of the reasons I've been considering the possibility of an extended fifth: An extended fifth wouldn't allow latecomers on board, and it would keep bulls trapped. So those who have only recently woken up to the possibility that the market is in a high-degree third wave won't be able to profit from it. In fact, they will most likely lose money, even with their newfound knowledge, because there's a strange tendency traders have where if they aren't short heading into a steep drop (such as we just had), they will start bottom hunting and buying way too early. Not because they're necessarily bullish, but mainly because they aren't short and they're trying to get in on the action. Or they're trying to recover the losses from their stopped-out longs.
So, if you put it all together, there's some psychological impetus for the market to just keep dropping here. Extended fifths are brutal, some of the worst waves one can encounter because they move very quickly and only come up for air long enough to grab a few stops (on the shorts) and sucker a few bulls -- then they resume their relentless waterfall. They don't bounce hard until they're entirely done (then they bounce fast and brutal, your textbook V-bottom massive "short covering rally" -- which then, after it has stopped all the shorts and lost money for everyone who shorted the hole, retraces and becomes more of a W-bottom to shake the late buyers before bouncing even harder).
Anyway, we'll see how it plays here. The short version is this:
SPX has captured its Wave 5 target and does not need to go any lower. It could form a decent bounce from here (plus or minus a little). If one has been following these updates, then one already has hundreds of points of profit and may not feel the need to get overly greedy (not trading advice). Maybe it's that simple.
Wave 5 still has the option to extend/waterfall if it wants.
There's an in-between option that keeps everyone guessing for a while and which could also satisfy the "burn the former bulls who are now buying too early" scenario discussed at length above.
In options 2 and 3, there could be a short-lived bounce toward one of the noted resistance/inflection zones before the downtrend resumes.
That's about all I've got for today. Trade safe."
Stock Market Commentary 10/27/23
By Lawrence G. McMillan
"The dominating feature of the $SPX chart is the downtrend. Lower highs and lower lows: that's all you really need to be aware of. Don't overthink it. New lows were made again this week. So, we are still carrying a "core" bearish position.
Yes, oversold conditions are beginning to arise again, but they didn't produce much of a rally at the beginning of October when $SPX bounced off the 4200 level and off of the then-rising 200-day Moving Average. That was a typical "oversold" rally meaning that the market only rallied because sellers were out of the way for a short time.
Eventually, there will be a stronger reason for a rally, based on buy signals from internal indicators, but they haven't taken place yet.
Equity-only put-call ratios remain split: the standard ratio (Figure 2) remains on a buy signal, which quite clearly has been wrong. The weighted ratio (Figure 3), however, continues to make new relative highs and thus remains on a sell signal.
Breadth has generally been poor, with only one day of positive breadth this week. Thus the breadth oscillators remain on sell signals, although they are deeply oversold. Oversold does not mean buy, of course, and it's going to take at least a couple of days of positive breadth to generate buy signals here.
Even the volatility complex is taking on a more bearish (or should I say, less bullish?) tone. True, there was a $VIX "spike peak" buy signal last Friday, but there is also an intermediate-term trend of $VIX sell signal. The trend of $VIX sell signal could be in place for a lengthy period of time.
The indicators above are still fairly negative, but there is one positive which is going to begin at today's close, and that is the October seasonal buy signal. The track record for this trade is strong -- even in bearish markets -- and it can even produce a sharp rally in the midst of chaos. But it only lasts for four days.
In summary, we are maintaining a "core" bearish position as long as the $SPX chart is in a downtrend. We will trade other signals around that "core.""
http://www.optionstrategist.com/sites/default/files/SPX.JPG?v=1698427123069
http://www.optionstrategist.com/sites/default/files/PC21.JPG?v=1698427123069
http://www.optionstrategist.com/sites/default/files/PC21_W.JPG?v=1698427123069
http://www.optionstrategist.com/sites/default/files/VIX.JPG?v=1698427123069
".....finally in the ballpark of where a smaller fifth wave could complete and trigger a decent bounce..........."
http://www.pretzelcharts.com/
"Where to start today? Let's start with the near-term SPX chart. Yesterday, SPX came within 7 points of its preferred target zone, which also puts it into the C-wave inflection zone (not that I'm expecting this to be a C-wave, but I'm not always right, so I never ignore things that run counter to my biases):"

"Returning to my bear bias at the moment: Keep in mind that we cannot yet rule out a fifth wave extension -- so this is a little bit tricky, in the sense that we're into "bounce or break" territory. A normal fifth could bounce soon, where an extended fifth will waterfall. My approach at such times is to pay closer attention to near-term trend channels and at least keep a few runners short until such time as the market breaks out of its crash channel. The red channel on the chart above is an example of a crash channel. This approach doesn't guarantee anything, but it does at least sometimes keep one from missing any sudden "whooshes" lower. None of this is trading advice, of course.
The reason I mention runners (as opposed to stubbornly refusing to take any profits at all) is because most of the time, fifth waves end in the ballpark of where they're "supposed" to."

"Next up, let's look at a TRAN chart I drew exactly one year and 8 months ago, published in a piece titled As in December, I Remain "Long-Term Bearish Until Proven Otherwise":"

"We can see in the updated chart (below) that 2/B moved a hair faster than originally drawn, but the price placement of 1/A and 2/B were both pretty decent -- especially considering that insisting the market was entering a long-term bear market back in February 2022 was widely considered ridiculous at the time:"

"When we look at TRAN's chart above, it doesn't take a master's degree in Elliott Wave to recognize what appears to be a pretty clear 3-wave rally. Could it be something weird, such as an expanded flat? Sure. But that's fairly unlikely. It's more likely to be exactly what it appears to be, and that bodes really poorly for the broader market, because TRAN is a leading indicator for both the stock market and the economy. TRAN companies are involved in the business of moving goods and people around the country and around the world -- and an economy moving fewer and fewer goods/people is an economy in contraction.
This is true regardless of what the "spreadsheet economy" guys keep saying. (You know the ones I mean. They love to say things such as, "Why are people so depressed about the economy? GDP was GREAT and unemployment was GREAT and yada yada!" These folks are apparently so far removed from the real world that they think everyone exists only inside their spreadsheets as an easily-comprehended digit, so they can't understand why actual humans who are struggling to feed their families might feel differently.)
Next is a quick update to a very-long-term SPX chart:"

"Finally, COMPQ seems to echo the "bounce or break" theme of the fifth wave (or potential extension thereof):"

"In conclusion, nothing has changed from the past few weeks of updates, but we are finally in the ballpark of where a smaller fifth wave could complete and trigger a decent bounce (which, given that it's expected to be a larger fourth wave, could turn into a sideways grind that burns some time). In the event bulls can't muster a bigger bounce here, we could fall directly into a fifth wave extension, do not pass Go, do not collect $22,867. (Inflation.) Trade safe."
"..........things are progressing as well as bears could have hoped,"
http://www.pretzelcharts.com/
"Since last update, my "against the crowd" lean that The Rally Everyone Was Getting Excited About was nothing more than a corrective fourth wave proved out:"

"SPX isn't tracking my September roadmap perfectly, but it's tracking it well enough. For now, I've left everything as it was originally drawn:"

"SPX over the near-term is a bit unclear -- even under the most bearish scenario, SPX could head lower early, then reverse back up to/beyond yesterday's high to complete a micro 4th wave. Or it could just enter the micro 5th (down) directly if it chooses. As noted, it's not terribly clear on the one-minute chart which option it wants. I'd probably very slightly lean toward the bounce, but waves can get weird if the market is in bad shape, so neither outcome would surprise me.
Oh, and of course that bounce could end up being the start of the bigger complex blue 4 from the first chart, probably shouldn't entirely ignore that.
NYA's chart describes how it could work with the big complex 4 in SPX, were such a thing to occur:"

"Meanwhile, COMPQ is in "bounce soon or break spectacularly" territory:"

"In conclusion, no real change from the last few months of updates, other than to note that things are progressing as well as bears could have hoped. Trade safe."
Sure looks like a simple continuation of the last wave down. in a defined channel and steady on the angle down. Controlled! Timeline seems to be next 2 weeks hitting the lows. Betting against seasonality is a bad idea. The PPT, FED will not allow any real damage leading into holiday season. Best guess 4100 on SPX.
Earnings has such low expectations once again it will beat. ONLY a spike in multiple data points rearding Inflation could turn this into a rout. Not likely. we are getting close to a major reversal however. While is seems we are waiting for GODOT to show up it muight happen early next year. The spike in Bitcoin has a Wyckoff Distribution pattern and that can be proven or disproven easily going forward. A sideways or down move in next one month should hold. The timeline is defined. Anytime between NOW and start of New Year that also should show a deep drop then.
We are getting close. Not yet. Fighting the holiday season is generally a bad idea. BUT we have 2 weeks to develop a low we can climb out of. This as the MAGA crowd will prevent a speaker till TRUMP give the nod and wears the holdouts out. The deadline for government shutdown is around the corner and i believe that is their plan, total disorder with NO ABILTY to pass any agenda or spending hike. It would be suicide for the GOP but heck they can no longer see anything in front of them. Now THAT just might cause a premature crash.
Thanks RCKS..I understand there is 26 points different between Futs and cash. Cash being 26 points below Futs.
" How the market behaves over the next week or so may determine if November 2023 becomes known as "Black November""
http://www.pretzelcharts.com/
"Friday's update concluded with:
Incidentally, if today begins with a little bounce back up over 76, then there's a reasonable chance that the overnight low is a corrective b-wave -- meaning the overnight futures low would be revisited and broken soon after (the overnight low sits down near ~4253 cash equivalent, though this isn't an exact equivalent, so allow a little leeway).
Friday's market found support 3 minutes after the open and bounced up to 76.56, then reversed and dropped below 4253, fulfilling the prediction quoted above. It eventually dropped all the way down to 4223 near the close, so hopefully that was helpful to readers.
Friday's close is into the zone that constitutes a retest of the prior swing low ("retests" are never to the penny and are plus/minus zones above and below prior lows (or highs)), so we'll see if bulls can muster any sort of bounce from this zone. Keep in mind that the complex 4th wave discussed previously stays on the table plus and minus the current zone:"

"COMPQ is also testing its low:"

"I did want to mention that Gold did not sustain a breakdown at its key trend line, and as long as that continues, it will avoid the option of the blue path. The next step for gold bulls would be to attempt to decisively clear the zone around the last three highs."

"Finally, the very-long-term chart of SPX remains interesting:"

"In conclusion, the market traveled, without incident, from the blue 4 inflection all the way down to the zone where it will enter the upper portion of the inflection for a more complex blue 4. I'm not crazy about the idea of a complex fourth, because I think it's too easy on bulls, who ideally should be trapped now -- but it's always possible. How the market behaves over the next week or so may determine if November 2023 becomes known as "Black November" in the future; if it goes directly into a fifth wave, there is potential here for an extended fifth (extended fifths become waterfalls). Trade safe."
Beginning of the Endgame (Mauldin) ...
https://www.mauldineconomics.com/frontlinethoughts/the-beginning-of-the-endgame
Stock Market Commentary 10/20/23
By Lawrence G. McMillan
"The simple fact is that the chart of $SPX is still in a downtrend. The pattern of lower highs and lower lows is still quite obvious on the chart, but I've drawn some red lines in Figure 1 to denote them as well. There were oversold rally attempts and even some buy signals, but so far the rally that began with a bounce off of the 4200 level as well as off of the rising 200-day Moving Average of $SPX, can be classified as a mere oversold rally. It reached the declining 20-day Moving Average and a little more, but that was it. That is a typical target for an oversold rally.
$SPX traded between 4330 and 4380 for six days, but has now broken down below that level. The upside targets that we had established for determination of whether this was a strong rally were not met. The first one was a closing of the gap on the $SPX chart (circled area in Figure 1). That would require $SPX to rally to 4401.60. Next would be a challenge of the downtrend line, which is currently at about 4430. I don't really think it's even meaningful to discuss further resistance areas above that, until these two are met.
There is support at 4200 and at the rising 200-day Moving Average is near there as well. They provided good support in early October, and we may be in the process of testing that support again.
Equity-only put-call ratios continue to be mixed. The standard ratio is on a buy (Figure 2), but the weighted ratio (Figure 3) and the Total put-call ratio (not shown) are making new relative highs, which means that they are still on sell signals. Clearly, that has been the correct call so far. They would need to roll over and begin to trend lower before buy signals could be signaled.
Breadth has been all over the place. From the Table on Page 1, one can see that just recently there have days in which at least 3,000 issues were on both sides advances and then declines. The last two days, they have been on the declining side of the ledger. As a result, two potential buy signals from the breadth oscillators have been registered and then almost immediately canceled out.
Even the "almost always bullish" volatility complex is beginning to show some signs of bearishness. First, the recent $VIX "spike peak" buy signal was stopped out.
However, that's not the only problem on the $VIX chart. A new trend of $VIX sell signal is now in place. It is marked by the circle on the right-hand side of the chart in Figure 4. That signal was confirmed when both $VIX and its 20-day Moving Average crossed above the 200-day MA.
We continue to maintain a "core" bearish position because of the downtrend on the $SPX chart. Moreover, many of the other indicators are generating signals, so we will trade those around the "core" position."
http://www.optionstrategist.com/sites/default/files/SPX.JPG?v=1698018242156
http://www.optionstrategist.com/sites/default/files/PC21.JPG?v=1698018242156
http://www.optionstrategist.com/sites/default/files/PC21_W.JPG?v=1698018242156
http://www.optionstrategist.com/sites/default/files/VIX.JPG?v=1698018242156
Odds Favor Further Selling This Week (Maybe a LOT of it)
OCTOBER 22, 2023 AT 12:01 PM
Tom Bowley
Chief Market Strategist, EarningsBeats.com
http://stockcharts.com/articles/tradingplaces/2023/10/odds-favor-further-selling-thi-109.html
I've been watching the Volatility Index ($VIX) for years and it provides us a number of very important signals. One of those signals is BE CAREFUL when the VIX moves from the teens and into the 20s. In my experience, moving from 13 to 15 isn't the same as moving from 19 to 21. We saw the latter last week and, if history is any guide, we need to be very cautious as we approaching this week.
"History of VIX Moving Above 20
We've had plenty of bouts with fear rising, even during the past 10-11 years of secular bull market action. Yes, I believe we remain solidly in a secular bull market. I've said it repeatedly, because that's what I believe and what I see in my longer-term signals. You may not agree with me, and that's fine, but I do have conviction. Without conviction of the Big Picture, the market's ups and downs will make investing/trading emotionally exhausting. "We're in a bull market! No, now we're in a bear market!" One day, the sky is falling. The next day, we have glorious sunshine. How do you cope with it? Well, it's having a solid grasp of how the stock market works. Fear comes and goes and it's measured in multiple ways. Today, let's focus on the VIX.
The escalation of fear is what drives very rapid acceleration in selling. If you study history, you'll see that every significant selloff this century has coincided with a VIX reading that soars above 20. But not every move above 20 results in a major selloff. Not only do we need to be aware when the VIX moves through 20, but we also need to realize that we're at a very important juncture short-term. In my opinion, the current secular bull market began on April 10, 2013, when the S&P 500 cleared previous price tops in 2000 and 2007. Here's the chart that validates what I believe was the start of the current secular bull market:"
http://d.stockcharts.com/img/articles/2023/10/22/4c269a2c-3912-43fa-a251-8dca140c663e.jpg
"The red-shaded area represents the last secular bear market, where we literally had no new highs on the S&P 500 for 13 years. I believe it's rather obvious to see that we're now in an uptrend, despite several major bumps in the road. Since that 2013 breakout, I count 36 times that the VIX has broken from the teens to above 20, signaling rising fear that we need to be aware of. Of the prior 35 occurrences, 23 resulted in almost immediate bottoms. That is, in roughly 2 out of 3 occurrences, the VIX trip above 20 marked a significant bottom. Let me provide you several 2019 examples in the following chart:"
http://d.stockcharts.com/img/articles/2023/10/22/dad3dcdc-8bde-4a2c-ac94-ffbe1bda9a72.jpg
"The VIX trips above 20 didn't last and, essentially, that initial close above 20 marked the S&P 500 bottom. But, in approximately one-third of these jumps through 20, the VIX signals us something more serious in the near-term. Here's an S&P 500 chart since the trade war days of Q4 2018, highlighting the more serious VIX warnings above 20:"
http://d.stockcharts.com/img/articles/2023/10/22/6edbe319-ed77-4ec4-a783-4078893be955.jpg
"These examples were much more serious and selling escalated rapidly. Avoiding that short-term carnage would make a huge difference in a trader's account. By the way, keep in mind that the current secular bull market has withstood all 35 prior occurrences. On Thursday and Friday of last week, the VIX jumped to close back above 20. But is this latest spike in fear going to result like 23 of the prior such jumps and mark the bottom now? Or will the fear continue to escalate and send prices lower rapidly? Well, there are no guarantees, but I believe it's prudent to believe that the odds of prices tanking this week, at least for a couple days, is stronger than 33%.
I have two reasons that support this notion of lower prices in the week ahead.
Bearish Technical Price Action
We only need to look at the S&P 500 daily chart to see the technical issues present at Friday's close:"
http://d.stockcharts.com/img/articles/2023/10/22/5893ee6a-83e4-4e05-8151-a40584d4710c.jpg
"The VIX breaking above 20 is a warning sign, but I believe it's more important that the S&P 500 closed on its low on Friday on increasing volume. This is NOT capitulation. In fact, it reeks of further selling ahead, until we see capitulation. Selloffs can be MUCH more brutal when price support is lost with a VIX above 20. So technical issues are telling me to be very careful.
Historical Bearishness
Next week is the absolute WORST week of the year historically, dating back to 1950 on the S&P 500. While the S&P 500's average annual returns are approximately +9% over the past 73 years, check out the following annualized returns by calendar day on the S&P 500 over those same 73 years:
October 22nd (today): -90.58%
October 23rd (Monday): -5.14%
October 24th (Tuesday): -32.64%
October 25th (Wednesday): -36.65%
October 26th (Thursday): -56.01%
October 27th (Friday): -24.27%
Those numbers are a far cry from the S&P 500's average annual return of +9%.
And if you think things are better historically on the NASDAQ, think again. Here are the annualized returns by calendar day on the NASDAQ since 1971:
October 22nd (today): -58.57%
October 23rd (Monday): -46.02%
October 24th (Tuesday): -64.64%
October 25th (Wednesday): -25.00%
October 26th (Thursday): -106.39%
October 27th (Friday): -78.14%
Now I'm not providing any guarantees about price action next week. Rather, I'm talking about tendencies and probabilities. The VIX is screaming at us to be very careful, price action is suggesting lower prices ahead, and history shows very bearish tendencies in the week ahead. Personally, I do not ignore those warning signs.
The Silver Lining
The primary silver lining for me is that every important signal I follow says this weakness will be short-lived and that the current secular bull market will return stronger than ever. The track record of these signals has been very strong for a decade. The other silver lining, however, is that historical tendencies will soon flip to the side of the bulls. I'll be providing some of those bullish historical clues in our free EB Digest newsletter over the next few weeks. EVERYONE should know these tendencies. And if you'd like IMMEDIATE access to a special FREE Money Flows report and receive additional clues in our EB Digest newsletter, CLICK HERE to download this report right now!"
Happy trading!
Tom
Pretzel :
(1) Pretzel presents both a Bull and Bear case.
(2) Pretzel gives both Triggers and Targets


| Volume | |
| Day Range: | |
| Bid Price | |
| Ask Price | |
| Last Trade Time: |


