 News
News  Market Data
  Discover
Support: 888-992-3836
Copyright © 2023 InvestorsHub Inc.


Register for free to join our community of investors and share your ideas. You will also get access to streaming quotes, interactive charts, trades, portfolio, live options flow and more tools.
"........it pays to continue to consider both sides of the trade (especially given the ambiguity we observed in real-time at the 4100 high). Blue 2 is still on the table, but we should not forget about the possibility of a trip to (or beyond) red 2."
http://www.pretzelcharts.com/
"Over the past couple months, we've witnessed the market turn down at the blue 2 inflection zone, then turn up at the next downside inflection zone (which was the inflection zone for a corrective ABC expanded flat decline), then turn down yet again at the next inflection zone (which was/is the inflection zone in the event the low was not the aforementioned expanded flat)... and SPX has since rallied back up to test that last inflection again, which is where it sits as of the time of this writing.
There's really no change to anything I've written for the past several months, but I wanted to again drill down a bit into the details to refresh everyone's memories.
The bigger picture chart previously pointed higher toward either blue 2 or red 2. We reached blue 2, and the market reversed -- but right from the start, we were immediately cautious about that reversal, for reasons I discussed on December 16 (and several times since):
SPX was again rejected smack at 4100, the price point I've been watching for more than a month and a half, but the market has left a less-than-clean top in its wake... the most recent tops in SPX and INDU are not ideal, leaving open the possibility of a B-wave high expanded flat pattern.
As of today, we still have yet to get any confirmation that said reversal was anything more than that previously discussed expanded flat (often referenced as "to B or not to B" in past updates).
For reference, here's the big picture chart again, with blue 2 and red 2:"
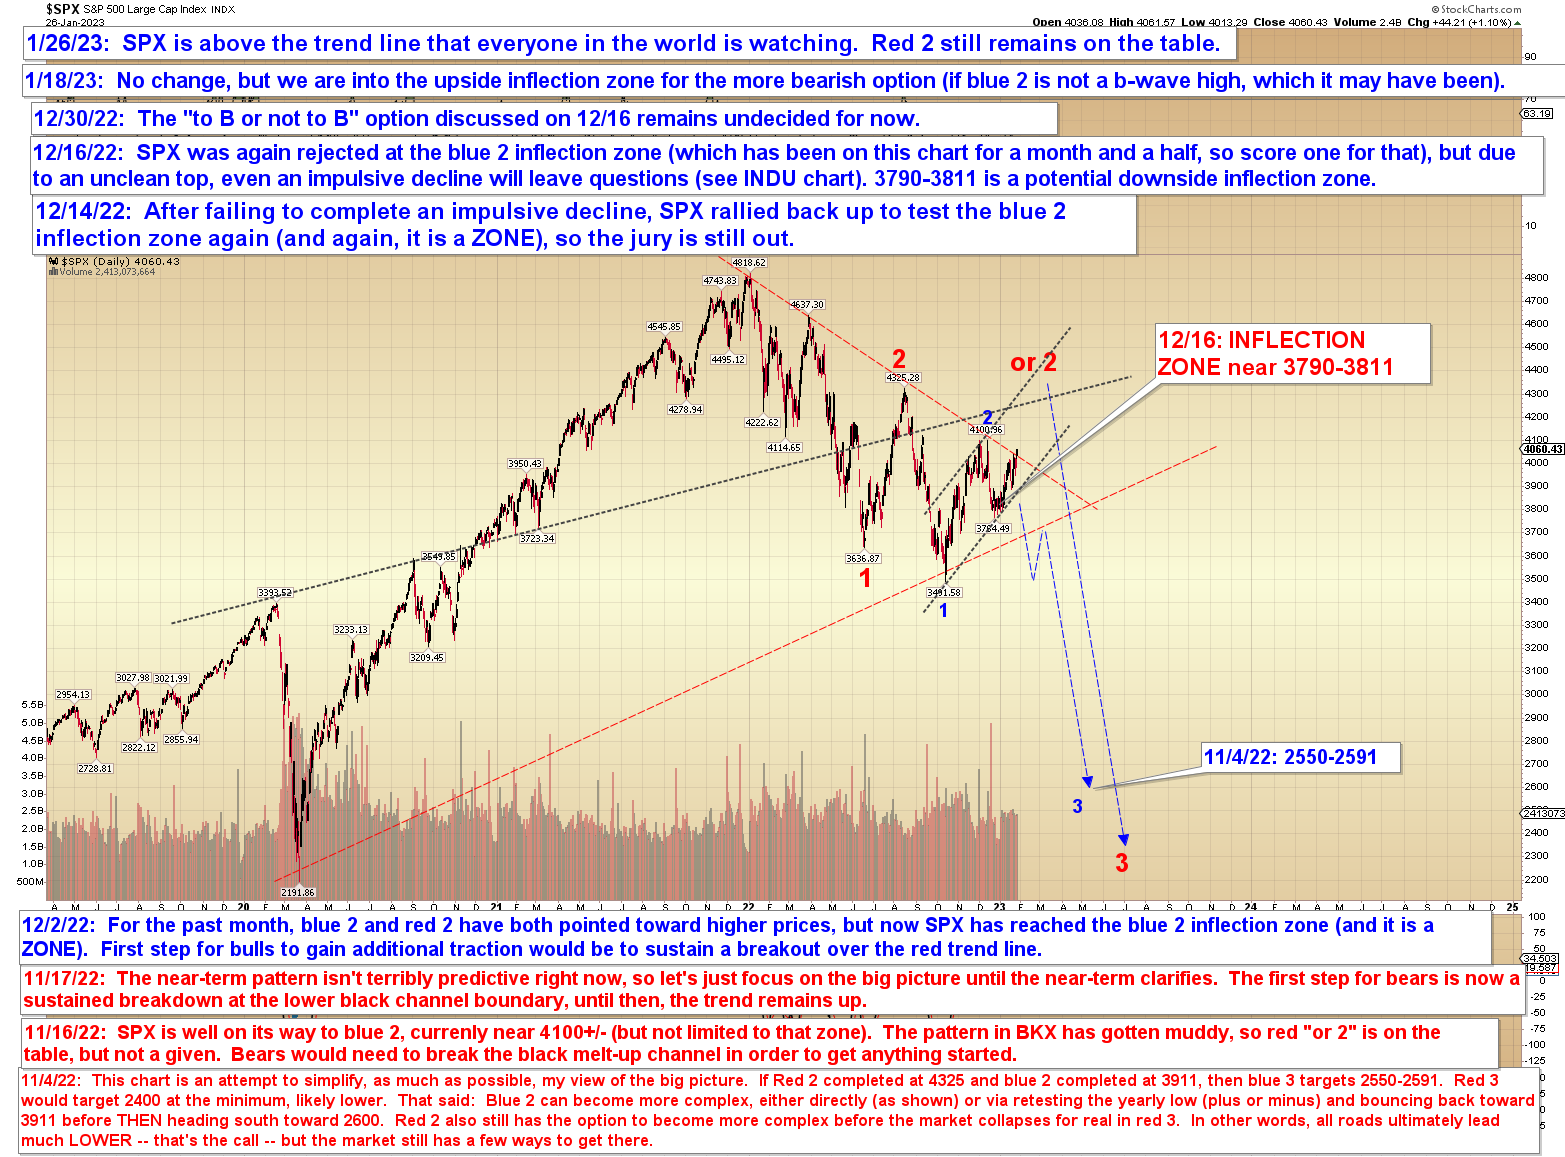
"Beyond that, I also want to talk about the near-term, because I've seen some interpretations of this pattern that are only looking at one side. Over the near-term, SPX has formed a rising wedge. Rising wedges are not necessarily bearish patterns -- they can also be "pending launch" patterns (bull nests, which are a series of first and second waves pointed higher, sometimes take the form of a rising wedge)."

"For the above pattern to become bearish, bears would need to whipsaw any breakouts of the upper trend line, then break and hold the lower trend line. Until that happens, it pays to continue to consider both sides of the trade (especially given the ambiguity we observed in real-time at the 4100 high). Blue 2 is still on the table, but we should not forget about the possibility of a trip to (or beyond) red 2. Trade safe."
This market gets no respect! The Crypto Guy is ignoring his own chart because he is CONVINCED we drop hard and fast right here and now.
He even concludes that the bullish indicators can only produce SIDEWAYS action. Lets talk about BIAS. We ONLY have till February 3rd to determine longer term trend. WHY? three reasons: 1 - most wave structured within a larger wave has a 3 month maximum target till it ends. Hardly ever seen one that breaks that rule. We already breached the 3 month target. 2 - BITCOIN broke out! 3 - Earnings season would already have the bulk of releases by then.
I even read an article explaining why the resilient job market is actually good for this economy and market. they actually see a slower inflation because of it. I guess they didn't see the other argument? you know WAGE PRESSURE!
Bias is in the air and the street is desperate to spin this in a positive light. It just might work this quarter. There is a reason you keep blinders on horses so they don't get spooked.
BTW the longer and stronger this current move shatters the wave count and MOST will conclude the bear is over. Me, I conclude this sucker hasn't yet started on the downside.
Thanks RCKS...Today may be a Trend day and we just keep going down...That should save the market by posting this..::)
SPX Update
http://www.pretzelcharts.com/
"SPX is still in the noise zone for the possible blue 2 (and worth noting that blue 2 would remain technically possible, in a slightly different iteration than shown, even if SPX broke a bit above ~4100)"

"Thus, there's still not much to add. Trade safe."
I'm hesitant to accept that.
Whatever the cause (or reasoning) that would trigger a huge number of stock and option trades, which are mostly done by computers now (and not by floor traders).
Look at NCLH, for instance. I would be trading that but haven't touched it for a few days (AKA staying in cash). I use 1-min charts intraday all the time so not much gets by me. I also use Medved Trader for my charting and it's been very reliable. What I see at end of day just doesn't make sense. There is no correlation between its intraday data (including before and after close) and the daily candle, yet they both utilize the same data.
Rimshot from SI
heads-up Alert: do not trust today's count at any source for
# of new 52-week price highs or 52-week lows ... the morning
glitch at the NYSE which created a Halt for many stock symbols
has resulted in busted trades and the temporarily high prints or low
prints are going to be with us forever on charts and data services, even
though the trades went to busted
the Wall Street Journal on-line subscription may be providing a more accurate
identification of which symbols are actually printing real new highs and new lows today ...
based on my quick survey so far
many chartists are complaining about this today
JLS
Did a little search and I think the chart reflects the problems NYSE had at the start today with bad trades which ended up busted and led to many charts having bad prints, The Carnival chart did the same thing.
That was earnings fallout correct?
It opened $3+ above previous close and then traded $3 below the previous close only to close today almost even with the previous close,.09 below
crazy
A little off topic ...
... but this chart just blew my mind. I trade this and have made a good income from it with little effort. Just lucky I wasn't in it when this happened ... I think my eyes might have popped out!
The only way to explain this is that somebody with too much money in their pocket, and little gray matter it their head, paid too much for this stock. Or ... an intelligent person was at the keyboard, then he had to go take a piss then his toddler came into his room and pushed a few buttons on the keyboard!
Otherwise, it boggles my mind -- I'm not posting the chart as that ruins the surprise:
OOPS, I was laughing so hard I hit the send button twice (and I can't delete the copy).
https://tinyurl.com/4amat6b8
A little off topic ...
... but this chart just blew my mind. I trade this and have made a good income from it with little effort. Just lucky I wasn't in it when this happened ... I think my eyes might have popped out!
The only way to explain this is that somebody with too much money in their pocket, and little gray matter it their head, paid too much for this stock. Or ... an intelligent person was at the keyboard, then he had to go take a piss then his toddler came into his room and pushed a few buttons on the keyboard!
Otherwise, it boggles my mind -- I'm not posting the chart as that ruins the surprise:
https://tinyurl.com/4amat6b8
I already gave my assessment. Pretzel ONLY confirmed my BIPOLAR view. EW has so many paths it could take from a stratospheric move to an earth shattering crash all in the same chart.
I use Rick Ackerman the mega bear for momentum play. According to him we already BROKE OUT! I assume YOU read my post. the one where i got chastised for. The one that came out BEFORE Pretzels.
Forget about the January effect. nonsense. No One Believe we already broke out. Everyone sees dark clouds. As for the full year forgetaboutit! Will go down as the worse year in decades depending on when the drop starts.
This move is likely only wave 2 of a huge mega wave 3 that either starts soon or stretches almost 6 months out. I was the ONLY one that stated a month ago this looks looks consolidation for a big push up. I gave the EXACT same assessment as Pretzel without the EW counts. i used Common Sense and past pattern recognition. I always get slammed for it but no one can actually show data that proves theirs works better than a dart throwing contest.
I already gave my TELLS so I will NOT rehash them. BTW I don't blame Pretzel for his analysis, only the fact that it is useless when a major move is about to take place. It's like trying to decide if an active volcano will explode or remain calm. TODAY we have much better ways to determine. WHY NOT WITH ALL THE PROGOSTICATORS using various techniques? Surely a disparity of that sort should be easily determined. A dramatic drop in earnings or a favorable return? Only talking about 2023 yet no one seems to know. Astonishing.
TELL ME am i nuts or did "I" get slammed for giving the EXACT same argument tht Pretzel gave? Hmmmm. Shows you what a fool you listen to. I can prove it with every single major reversal period. Me, why i am ALWAYS early on my calls dumbfounded that the street is so obtuse in making it's mind. TODAY i know the path we are headed for but not the timing. Before the year is out 2200 on SPX will be hit. An outrageous statement. I have my bias for when but refuse to share what i look for or why. I love getting ridiculed for getting the pandemic and inflation drop right. Now this? how absurd.
As I stated before first week in February (no later than 2/3) we have a great idea short and intermediate term move. Buckle up!
"The S&P 500 Showing More Bullish Signals, Watch This Key Level"
Tom Bowley | January 22, 2023 at 02:38 PM
http://stockcharts.com/articles/tradingplaces/2023/01/the-sp-500-showing-more-bullis-302.html
"Say what you want, but January has proven to be a very reliable predictor of U.S. stock market action from February through December since 1950 and, with just a little more than a week left to go in January 2023, market action is suggesting that we're going to have a very strong year. It's just one more historical fact that suggests higher prices are ahead of us. I've also mentioned recently that of the previous 13 bear markets since 1950, excluding the 2022 cyclical bear market, 6 ended during the calendar month of October. If October 2022 proves to be the ultimate low, that'll make 7 out of 14, 50% of all bear markets. That's another piece of compelling evidence that the bear market low is IN.
If I step away from historical tendencies, however, and simply look at the S&P 500 chart, the downtrend line since the beginning of 2022 is what nearly every technician is watching:"
http://d.stockcharts.com/img/articles/2023/01/22/1a6258dc-c182-4484-be9b-96dc177984d9.jpg
"The downtrend line currently intersects at approximately 4000, depending on how you draw your trend line. In my view, that's the first critical level to clear in order to confirm the end of the bear market decline. Check out the subtle difference that we're seeing in January 2023, though. After the last 3 death crosses and bearish PPO centerline crosses, we saw selling accelerate and new lows quickly reached. We're seeing something entirely different this time. The PPO has turned back above centerline resistance in bullish fashion and we've also seen a bullish "golden cross" just a few weeks after the death cross suggested we'd head lower. What's happening? Well, I can tell you what I think is happening. We're chopping in preparation for a solid year ahead. Many are waiting for price action to confirm what's been taking place beneath the surface for months. I told our members and the entire investing public that June 2022 had the characteristics of a major market bottom and that it was time to concentrate on long positions, letting go of the bear mentality that was appropriate during the first six months of 2022. I don't think I could have been much clearer:"
http://d.stockcharts.com/img/articles/2023/01/22/1f338fd7-4482-4b23-9102-2b9ffa1f2667.jpg
"Did we eventually move slightly lower in October? Yes we did. I'm still pretty happy, though, with my signals that suggested shorting the S&P 500 at the beginning of the year and moving to a long position in mid-June 2022. The S&P 500 closed lower than 3636 on 5 separate trading days from September 30th through October 14th. Since my bottom call, the S&P 500 has closed higher on 143 different trading days. I think I've been on the right side of the market since June and 2023 will prove that the October 2022 low was THE ultimate bear market low. Waiting for further signals, in my humble opinion, will result in lower returns, but I suppose time will tell. I remain very bullish and said throughout 2022 that the bear market was of a cyclical (short-term) nature.
Another critical technical component that tells me the worst is behind us is that we're seeing buying with bad news. The October low saw a massive reversing candle after a much-worse-than-expected September CPI inflation report. After a gap lower, buying was intense ALL DAY LONG. Check it out:"
http://d.stockcharts.com/img/articles/2023/01/22/d8d64817-9594-46d8-8c86-61a0cbd9dfe0.jpg
"Another very positive development is that after a brutal 4th quarter for many growth stocks, the sun is suddenly shining in 2023. The 10-year treasury yield ($TNX) set a new recent low and this time, growth is performing much better than value. That's a very important change in market character, because many of these growth stocks have large market cap valuations and can much more easily move our benchmark indices like the S&P 500. Check out the sudden improvement in growth stocks in 2023:"
http://d.stockcharts.com/img/articles/2023/01/22/38403884-4960-48c4-9154-3dc88fd12226.jpg
"The drop in the TNX in November/December didn't have quite the same bullish effect on large cap growth stocks (IWF) that the June/July drop had. Growth vs. value (IWF:IWD), however, is moving solidly higher in 2023, clearly benefiting from the lower TNX. I have highlighted in red the months of negative relative momentum that growth stocks have experienced. While things have certainly improved, we haven't seen any significant confirmation of long-term renewed strength. The bulls still have work to do.
An encouraging part, however, has been key individual stocks' resilience to bad fundamental news. Take Salesforce.com (CRM) as an example. It downtrended throughout 2022 and was the Dow Jones worst-performing component stock for the year. But then, after announcing 8,000 layoffs, or 10% of its work force, CRM rallied strongly:"
http://d.stockcharts.com/img/articles/2023/01/22/21d0b918-3816-4da1-958e-1e55a3a211c8.jpg
"The green arrow highlights the successful 20-day EMA test the day that the layoffs were announced and you can see the subsequent rally. CRM has now broken above its recent downtrend channel and is on the verge of clearing important relative strength resistance vs. its software peers ($DJUSSW).
Last week, at our quarterly "Sneak Preview: Q3 Earnings" event, I highlighted Netflix (NFLX) as one of my favorite companies heading into earnings season. NFLX absolutely loves the month of January and January 2023 has been no exception. Check out this seasonality chart:"
http://d.stockcharts.com/img/articles/2023/01/22/0d3ced1f-4107-4d5e-b516-a3dcf630e261.jpg
"Over the last 20 years, NFLX has averaged gaining 15.7 during the month of January. That's incredible and is the reason why NFLX was our favorite seasonal stock for January 2023 and passed along to our EB.com members to open the month. Those bullish thoughts proved to be correct as NFLX is currently higher by approximately 17% this month. Quarterly results were reported on Thursday and were solid, as expected.
Tomorrow, I'll be hosting our "Q4 Earnings" event at 4:30pm ET and I'll be providing my favorite 10 companies that will report earnings over the next 2-3 weeks as earnings season really heats up. I'll also disclose the 10 companies that I'd completely avoid heading into earnings. I'll discuss dozens of other companies reporting quarterly results as well. I use a key technical indicator to evaluate companies prior to their quarterly earnings report and it's proven to be extremely effective in predicting reported results. If you'd like to join me tomorrow, simply CLICK HERE and sign up for a FREE 30-day trial. You can check out our entire service at no cost for an entire month! I hope to see you tomorrow!"
Happy trading!
Tom
Good morning Glen
I'm with you on the market digesting this climb up to 4033
I think we need to back test the falling trend line we just climbed over which is in the 4000 region right now but falling...... so I could see the back test arriving tomorrow and tagging 3990 realm jmho
http://stockcharts.com/c-sc/sc?s=%24SPX&p=60&b=5&g=0&i=p97160086684&a=223825916&r=1674496455814
Thanks RCKS...We could possibly get a down signal on the 60 min chart at the next update in 16 mins...We do have a down signal now on the 30 min chart..Target is the 10EMA now at 4002...We just have to see.. CCI10 needs to drop back below +100 on the 60 min chart.
https://schrts.co/RsRrIHca
gdl
Why don't go over tp Pretzel's site and give him a piece of your mind, much as you are doing here?
http://www.pretzelcharts.com/
"Worth noting that a break of the obvious falling trend line on the way to red 2, were it to occur, would go a long way toward convincing many people that the bear was over (I currently believe this would be a fake-out, though):"
http://www.pretzelcharts.com/
"No change since last update, or since mid-December (though, really, for longer if we refer back to the macro chart, which has been largely unchanged since early November), so I'm going to keep today's update short and sweet. The question is still unresolved on "blue 2 vs red 2." Worth noting that a break of the obvious falling trend line on the way to red 2, were it to occur, would go a long way toward convincing many people that the bear was over (I currently believe this would be a fake-out, though):"

"In conclusion, there's not much for me to say that I haven't already said in 20 ways already over the past few months, so... trade safe!"
Your explanation that EW has multiple paths it can follow doesn't help the investor one bit. In fact your analysis states we can either have a new bull market or fail here and plunge longer and deeper than most would think. GREAT! After over a month "I" could have and did say the same thing. In that tine NO ONE has come out and placed ODDS on which path we take. WHY? is there nothing that anyone can do to determine if our economy is at a crossroads or about to launch into the stratosphere? Ridiculous. Seems ILLOGICAL that a trillion dollar market based on purely economic projections on earnings can't decide if we are about to fall into the abyss or nirvana.
I presented this exact dilemma many months ago. How is it so impossible to "see" what is right in front of us? You would think that the slew of data points and technical analysis would be able to determine such a simple understanding at such a critical level. is it our own bias and emotional misdirection that prevents us from answering this question?
let me put it in more stark terms. Rowing down a river and we come to a fork in the path where we determine one will lead to smooth waters for miles and miles while the other leads to a waterfall. is there really no way to tell which is which? In fact there are. we can determine the current of both paths, the strength of each path, the turbulence coming closer to each path.
So what are the CURRENT clues. It is not as if the past has no bearing on the future.
Excerpts from Pretzel:
"Keep in mind that the most bearish count here is exceedingly bearish, because if blue 1/A is 1 (and not A, or C of an expanded flat; too early to say for sure, hence the "?" from Dec. 16), then the market is at the beginning of a nested third wave decline that's likely to become the most significant and rapid sell-off this bear market has yet seen. Third waves are often "crash" waves."
Million dollar question: What or when can we know besides after the fact. if we break above 4120? nope. If we break below 3765 is that the "TELL"? EW alone can't tell us. I have MY theory that dates back a while.
A nested third wave here? if so how high can this go and how long? What finally determines which chart to follow?
"Bears want to hold the 4016 high, bulls want to hold the 1/A low. Keep in mind that the most bearish count here is exceedingly bearish.............."
http://www.pretzelcharts.com/
"On December 16 (and a bunch of times since), I published the following chart, suggesting that the market would decline toward the 3775 zone, find support, then reverse and rally up toward 4010, where it would encounter the next inflection zone and have a decision to make:"

"As it turned out, the market bottomed at 3764, then topped at 4016. Here's how that chart looks now (I haven't updated this chart since January 11, because Stockcharts always deletes all my annotations and makes me start over, which is annoying and time consuming and it's just not worth it anymore -- the chart served its purpose):"

"This (along with a million other examples that long-time readers are familiar with) is why, when people on Twitter act like Elliott Wave is some sort of mystical voodoo, I usually don't even bother to argue with them anymore. I didn't publish 5 SPX alternate counts and eventually get a hit (nor do I generally count anything but the preferred count as a "hit" anyway), I published this one chart for more than a month straight, and it was so accurate (though I did have to nudge the labels a hair, of course) that I almost could have stopped publishing on December 16 and just waited for it all to play out (don't give me any ideas!).
So, the lines seem pretty clear from here. Bears want to hold the 4016 high, bulls want to hold the 1/A low. Keep in mind that the most bearish count here is exceedingly bearish, because if blue 1/A is 1 (and not A, or C of an expanded flat; too early to say for sure, hence the "?" from Dec. 16), then the market is at the beginning of a nested third wave decline that's likely to become the most significant and rapid sell-off this bear market has yet seen. Third waves are often "crash" waves. Trade safe."
"So far, no signs that bears have jumped back in."
http://www.pretzelcharts.com/
"Not much has happened since the last update and the long weekend. NYA, as noted Friday, did break its prior high:"

"NYA's break does at least weakly suggest that perhaps SPX will ultimately do the same:"

"In conclusion, all of this was worked out a month and a half ago, and the market has finally done what it was expected to do -- so now it's just a matter of how it handles this current inflection. So far, no signs that bears have jumped back in. Trade safe."
Good choice. This market refuses to accept a possible long term trend change in disinflation. A 40 year trend. We will hit an era worse than the 70's where stock betting would be whispered in alleys.
Just as the political arena has collapse where most still don't see it, the stock market is in the same position. Dismantling of both the republic and Stock Market is running in sync. On the stock market we have a defined target of 2200 in the SPX as the first major support. that will result in a huge fake out but eventually we drop even further. I can extrapolate from the political path we are already in that really bad times have not even started yet.
I had hoped i was wrong 7 years ago when i presented the path we have already taken. NOW, well lets just say we are like a chicken that just got it's head chopped off and we run around not realizing it yet.
Being up in the air is ...
the foundation of being nasty.
"The funny part is this whole thing is that a majority was convinced, bull and bear alike, that we would see some nasty drops the first half of this year and now it is all up in the air".
For that reason, I'm sitting on cash.
SO basically WTF is going on? No bets no direction frozen in place till it becomes obvious. The funny part os this whole thing is that a majority was convinced, bull and bear alike, that we would see some nasty drops the first half of this year and now it is all up in the air.
This market has achieved the ultimate in confusion. Only thing you have to do is watch the inflation gauge and when it spikes up the initial shock will freeze the market. that's the opportunity. The inflation spike will resume, only a matter of when. China alone has gone from lock down to fully open in a matter of weeks. this happened only a month ago. Can anyone guess what that means for inflation? To ignore the rules of nature such as known defined cycles is to forever be on the wrong ide of the trade. 40 year disinflation cycle is DEAD!
"SPX is now dead-on the red inflection zone shown in December, so we'll see how it reacts"
http://www.pretzelcharts.com/
"CPI gave the market whiplash yesterday, but a few interesting things happened in the process.
First, SPX finally reached the red "?" to the [I want to say "to the letter," but ? isn't a letter, at least not in the English alphabet].
I haven't updated this chart because Stockcharts will delete all my annotations and I'll have to start over. The annotation from 1/11 contains an extra sentence, which I had edited out (via Photoshop, due to the aforementioned Stockcharts bug) when I first published this chart."

"Took a little longer than shown, but here's how that chart looked on December 28:"

"Second, NYA finally made a new high (though still short of its "textbook" target, which, again, does not necessarily need to be hit on the button):"

"In conclusion, SPX is now dead-on the red inflection zone shown in December, so we'll see how it reacts. Trade safe."
Plscraig
I am only reposting pretzel's charts.
I will say that using the NYA chart to give hints of what someone thinks is happening is fine but until the SPX breakouts, I would treat it has a hint only.
Getting above and holding above the falling trendline on the SPX daily chart is crucial for the Bullish case.
http://stockcharts.com/c-sc/sc?s=%24SPX&p=D&b=5&g=0&i=p43596574256&a=222820108&r=1673933518301
Thanks, Ricks
is the breakout up on the NYA the same as on the SPX
Could this be from the FED pivot?
Can we break the C line and more
Love your charts, Man
And yet Not a single word since then? YOU expected a reversal didn't ya? Look at Bitcoin, already breaking out beyond expected ceiling.
Fake-out or a real jumping Bull. Will YOU make the call?
Sea Pea Eye (CPI)
http://www.pretzelcharts.com/
"SPX finally headed into the zone of the red "?", which is actually something of a hit, given that the projection chart I've been publishing for the past several weeks showed two options, both of which pointed higher off of the blue 1/A inflection. The bull options simply keeps going, but even the bear option implied we'd run ~this high."

"Tomorrow is CPI, which will likely be the catalyst for the market to finally reveal the answer to the weeks-old question that has plagued mankind ever since William Shakespeare first took up trading: "To B or not to B." Trade safe."
This Sentiment Signal Is Solid And Says We Could Soar Short-Term
Tom Bowley | January 06, 2023 at 11:32 AM
http://stockcharts.com/articles/tradingplaces/2023/01/this-sentiment-signal-is-solid-635.html
"Late yesterday afternoon, I sent out a quick update to our EarningsBeats.com members, suggesting that we could see a sudden surge higher in equities. A bullish signal emerged in the Volatility Index ($VIX), one that doesn't appear very often. Typically, the S&P 500 and VIX move inversely to one another, but when they move in the same direction for a period of time, it can be a solid indication of an impending reversal in the S&P 500. Yesterday's positive correlation between the S&P 500 and VIX was an indication (not guarantee, of course) that a reversal of the recent downtrend was much more likely:"
http://d.stockcharts.com/img/articles/2023/01/06/b83a8acc-a2bc-4e38-95d7-7f1b2663a0aa.jpg
There have only been 3 times in 3 years where the correlation coefficient turned positive by 0.25 or higher. The first signal of that magnitude was received in early-September 2020 and was identified and published right here in my Trading Places blog at that time. You can check out that article HERE. That signal was bearish, because the VIX and S&P 500 were moving higher together. I interpret that to mean that, as the S&P 500 kept advancing, fear was growing. All it took was a stumble and the bears quickly gained control. The second signal occurred in November 2021, just as money began rotating more defensively. That signal proved quite useful as well. Now we have the opposite. The S&P 500 finished December and began January on a sour note. But the VIX is declining, suggesting that fear is dissipating. In this case, any bullish news could quickly put the bulls in charge. It may be temporary, however, so stay tuned."
Happy trading!
Tom
"Well, the market finally broke out of that sideways range! So, today's update will break with recent tradition and say... "no real change." Yes!"
http://www.pretzelcharts.com/
"Back on December 16, I wrote that the (then recent) top in SPX was less than ideal and had left open the possibility that that high was the b-wave of an expanded flat. After declining into the inflection zone, the market traded sideways, leaving me to publish update after update saying "no real change."
Well, the market finally broke out of that sideways range! So, today's update will break with recent tradition and say... "no real change." Yes! Still. The main changes are that SPX has finally moved toward the red "?" shown, for a while now, by the blue projection line (incidentally, that's a wider zone than it may appear; there are no hard rules for a 2/B wave (represented by the "?"), if that's what this even is, other than that it stay below the start of the first wave) -- and that the 3764 low has become more important."

"NYA may be a bit more interesting, inasmuch as it's bouncing out a clear 3-down:"

"Bigger picture, NYA's "textbook" target is still hanging out in space:"

"In conclusion, while there's no real change, it does at least appear that I correctly identified the 3/C inflection zone a couple weeks ago. The main change is that zone has now become something of a "must hold" zone for bulls, particularly in NYA, as any sustained break there could now imply a bear nest. However, we have to take it for what it is, and right now, it's still just "3 down." Trade safe."
2022: The Year in Review -- and the Big Picture Heading Forward
http://www.pretzelcharts.com/
"First off, let me dispel the rumors and officially announce that, yes, it's true: The rhyme in the title is intentional. With that bit of unseemly dirt out of the way, since the near-term market has been rather bland lately (dragging the updates along with it), this seemed like a good time to review the big predictions I made during 2022 and see where we stand now.
Technically, though, this story begins two years earlier, in 2020, when I began publicly stating that I believed America was approaching the end of a Supercycle rally, and published the following chart:"

"Here's how that chart looks today, updated "only" with the last ~3 years of price action:"

"The market has tracked that projection well, and I still remain of the opinion that this is the start of a Supercycle collapse, meaning that the worst is yet to come. Despite how some investors are undoubtedly feeling, in my view, things haven't even begun to get "bad" yet. We're still in the stage where bears are having fun (!). We'll know we're getting closer to the bottom when even bears are hoping and praying for good news and rallies, because everything will be teetering on the brink of complete destruction -- and not even bears want to see that.
I likewise remain of the opinion that the current collapse is not solely a financial event. I believe our financial woes are, in fact, the superficial symptoms of a much deeper problem. As I wrote in the above linked piece from 2020:
Our country was founded on solid principles. Those principles led to our success. They predated it; they created it. As we grew in stature, we began to forget the underlying principles, but we continued to live in the systems those principles created, so we continued to grow stronger: We were embodying the core principles, whether we understood them or not.
But over generations, we've drifted further and further from those principles. Few in the modern world seem to even understand those principles -- and we certainly won't value what we don't understand. And... some are actively rooting for destruction though they do not and cannot realize that's what they're rooting for; they bear destruction in the name of "progress" (because they truly believe in what they're doing).
We have, in essence, discarded the very principles that brought us success in the first place.
Since we, as a nation, are (as with all entities) merely the sum total of our ideas, this deterioration of our core principles cannot and will not continue without consequence. The center cannot hold. This, I suspect, is the last thing we see as a Supercycle Peak approaches.
What principles am I talking about? Too many things to list, but to name just a few: Principles such as personal and institutional integrity, equal justice for all under the law, free speech without censorship, honest open debate of "consensus" science, personal freedom and the accordant personal accountability burden that must be borne along with freedom (though it's worth noting that freedom/accountability intertwine and the consequences of diminishing either run in both directions: remove the burden of accountability from people and you have removed their agency; someone presumed to be without agency, by definition, cannot be free -- thus removing accountability does not free people, it enslaves them), and basic goodwill for our fellow humans taking precedence in our hearts and minds over our political "tribes."
Again, to name just a few of the areas where I believe America is losing, or has lost, its way.
But I digress.
After publishing the chart above in 2020, I continued to look for higher prices (one can see that the projection points higher out of the 2020 low) until December 2021, when I warned readers that we were likely in the final wave of the final wave of the final wave higher; that we were approaching, quote: "the final high of this 12+ year bull market," and that it was thus, in my opinion, time to sell the rallies.
So, just for context for new readers, I wasn't a "perma-bear who finally got it right"; I was bullish when we were in a bull market. Even into the March 2020 Covid crash low (incidentally, I predicted both the crash and the recovery).
Anyway, from there until January, I was unsure if we'd get one more small wave up, but in the first update of January, I wrote that I liked the idea of a move toward 4495 -- then on January 7, I projected that if SPX broke below 4671 it was almost certainly heading for that 4495 target (which it did).
While I was unsure if we'd see a slight new high, I remained bearish on the big picture throughout January, and published this chart (below) several times:"

"As I wrote in February:
I keep trying to drive home the idea that the near-term just doesn't matter much here. As I mentioned elsewhere, it's probably not wise to get too hung up picking up pennies on the track when a freight train is bearing down on you at full speed. So once again, as clearly as I can state this: Since December 2021, I have been, and remain, bearish until proven otherwise.
On April 8, in a piece written with very bearish undertones, I published the following intermediate projection:"

"That mid-3700s target was later captured.
I originally started this piece mainly wanting to look at the predictions from April's magnum opus, but realized some context was needed, which I think we've gotten through now -- so let's look at the predictions from April's Are Stocks Headed Toward a Generational Bear Market? in the order they appeared, starting with Treasury yields/interest rates.
In this regard, I published several charts highlighting a major trend line and wrote:
This trend line has contained yields for 40 years. 40 financially-prosperous years for the United States, we might add, in a largely low-inflationary environment. A sustained breakout might thus signal a sea change from those conditions
That "sea change" line was at ~2.8%. Given the spike in rates/yields since then, I think we can all agree this prediction was a major hit.
Heading forward, I believe the longer-term trend for Treasuries remains down (meaning higher interest rates). If the right conditions were met, my view can, of course, change, but so far bulls have not done anything to change it.
I then discussed inflation, citing what I originally wrote back in July of 2021:
This means that, regardless of what they tell us, inflation is likely here to stay (for as long as market forces will allow, anyway)
Speaking of, I went to the grocery store yesterday and saw that, in the course of only one week, the price of one of the items on my list had risen from $3.50 the week prior to $5.39 now! So yeah, I think we can call that a hit.
Then we talked about oil, and I wrote:
When the Fed says they need to control inflation, in one sense, what they're really saying is that they need to bring down the price of oil. At face value, oil prices impact the cost of shipping, which bleeds over into everything that has to get from one place to another (in other words: everything), including most of our food. And of course, it impacts the cost of electricity, which again impacts the cost of everything, including the refrigeration needed to preserve our food.
[Insert long discussion about the flaws in current domestic oil policy, culminating with:]
And it is by this road that it has now fallen to the Federal Reserve to attempt to bring down the price of oil, and thus to quell inflation, by tightening monetary policy. This is the wrong tool for the job, akin to using a hammer to fix a leak. You might be able to pound the leak closed, but you're going to do a great deal of collateral damage in the process.
Sounds about right. While I didn't give any immediate projections for oil prices, my long-term view is that oil based a massive Supercycle decline in 2020 (incidentally, back in 2011, I predicted that oil was headed to 25 and didn't waver from that until we hit bottom in March 2020), which means that after the current correction is over, oil is going to trend higher for the long-term.
After oil, I discussed the stock market and presented long-term charts projecting a major bear market, and wrote:
I'm bearish because of what I see in the charts, but I'm also bearish because of what I have seen developing in our nation itself, and in our leaders. This has been a long time coming.
Obviously can't say with complete certainty that it's been a hit regarding the "Supercycle bear" yet, but I think we can say unequivocally that my bearish stance on equities has been the correct one.
Finally, I discussed Real Estate, where I think I surprised some readers, as I was not yet bearish on the housing market. There, I wrote:
I wouldn't be surprised to see housing prices ultimately start falling in certain local markets (housing is, in the end, always "local") -- but I'm going to go out on a limb here and state that I suspect overall, real estate will hold up fairly well for the foreseeable future.
Bottom line: It wouldn't surprise me if prices level off somewhat as mortgage rates rise, with potentially some corrections along the way, but I don't believe we're in a bona fide housing bubble the way we were 15 years ago, so I don't believe we'll see a real estate "crash" from current valuations.
So as of December, I'm a major equities bear, but I think real estate will not suffer the same fate yet (this analysis of real estate is not intended as a super-long-term prognostication, only "the foreseeable future" as things will likely change somewhere down the road, of course. For example, if unemployment hits 26% in 2025, obviously that would become a new input in the equation).
Below is the current chart of home sales prices:"

"From the time I published in April, prices continued to rise until July, then declined, making prices roughly a wash from April until present. Thus I think it's not unreasonable to say my April analysis that "real estate will hold up fairly well for the foreseeable future" has borne out, and certainly my prediction that housing would not crash the instant rates rose has held up.
On this market, I haven't done the legwork to analyze where we are now (I don't track real estate developments on a daily basis the way I do with equities -- April 2021's update was the result of several weeks of detailed analysis). So, I don't have a strong opinion where we go now in real estate, but perhaps I'll look into it in more detail and do a larger piece on it if people are interested.
Trade safe."
January 6th anniversary says more about our countries delusional detachment from reality and also the markets participants. BOTH in a state of promise that change is here. BOTH can't see beyond their personal greed. Like the 11 years of Hitler's reign that tragically got shorted on the 12th.
Great promise by both Hitler and the GOP. BOTH rely on hate fear and scapegoating. BOTH ignore the path we are headed for.
Wait for the GOP to flex it's muscle as the insurrectionists have taken over. The economy and political dismantling of our system is one and the same with exactly the same outcomes.
Bitcoin will rally BIG, to perhaps 20K or even higher. SPX will rally to 40K or higher. No data point this month will mean anything till earnings season is in force. Buckled up!
Thjis is a bipolar market. Never know who is going to show uip.. Thanks for the update
"....we're still in the noise zone, so there's little to add....."
http://www.pretzelcharts.com/
"Last update mentioned:
NYA has formed a potentially interesting bi-modal near-term pattern (though there is the option of a complex flat that finds a bottom south of 15033 but north of 14866).
And since then, the market reversed and NYA declined to just shy of 15033:"

"SPX remains basically unchanged:"

"In conclusion, we're still in the noise zone, so there's little to add to the past hundred days (or whatever it's been -- seems like a hundred days) of updates. Oh, but Happy New Year to everyone! Trade safe."
This is a recap of Tom's past Market Forecasts and you would have to tune in January 7th to get his 2023 view
Tom Bowley | January 01, 2023 at 11:43 AM
http://stockcharts.com/articles/tradingplaces/2023/01/my-2023-stock-market-forecast-362.html
I have not met any bullish or bearish minded individual that isn't declaring the end of this bear cycle in the first quarter of 2023. Unanimous. ALL see the later half of 2023 as extremely bullish. if we are indeed in a super cycle decline what are the rules for a counter trend after say 3200 on SPX is hit? Short term we should have a gap up move and maybe all done in first trading day of new year?
Brutal disguised patterns since October.
Money Is Pouring Into These 3 Industries Right Now
Tom Bowley | December 30, 2022 at 08:03 PM
http://stockcharts.com/articles/tradingplaces/2022/12/money-is-pouring-into-these-3-859.html
"I've been watching critical areas like semiconductors ($DJUSSC), software ($DJUSSW), and internet ($DJUSNS) underperform vs. the S&P 500 throughout 2022. But the good news is that, since June, money rotating out of the three aforementioned aggressive sectors is finding a home in other industry groups. That's allowing the S&P 500 to remain afloat and significantly outperform the more aggressive and growth-oriented NASDAQ 100. Three industry groups, in particularly, are benefiting mightily from this rotation. In no particular order, here they are:
Aerospace
I don't know if you've been watching Boeing Co. (BA), but after a very difficult period from April through June, BA has soared more than 50%, lifting aerospace stocks ($DJUSAS) much higher in the process. Check out this chart:"
http://d.stockcharts.com/img/articles/2022/12/30/a39d9722-da77-4055-b11b-dbb5a3d7f675.jpg
"That DJUSAS relative breakout in the last two months corresponds inversely to the weakness that we've seen in leaders like Apple, Inc. (AAPL), Tesla, Inc. (TSLA), and Alphabet, Inc. (GOOGL). If you're wondering why the S&P 500 still remains well above its lows from June and October, well the above chart is one reason why. Money isn't leaving equities. It's rotating and keeping the hopes of a shorter-term cyclical bear market intact.
Commercial Vehicles & Trucks
Commercial vehicles & trucks ($DJUSHR) is another industry within the industrials sector (XLI) that is flying high - so much so that it's recently set an all-time high. Yep, that's right. All-time high!"
http://d.stockcharts.com/img/articles/2022/12/30/cf5cfd87-722f-47bf-84df-e7eb7d9bddea.jpg
"You can see the clear breakouts in terms of both absolute and relative prices. Currently, RSI is down at 53, so the DJUSHR is nowhere near overbought and very likely has further to run.
Medical Equipment
A lot of other industries, particularly those in financials, industrials, and energy, have been outperforming the medical equipment group ($DJUSAM) over the long haul, but I don't know if any are seeing the surge in bullish momentum that the DJUSAM is. The first chart below is the absolute price chart, showing that the 2022 downtrend has now been broken:"
http://d.stockcharts.com/img/articles/2022/12/30/104deb90-69bc-4853-a261-fe40eb6854d6.jpg
"Because this uptrend is not nearly as established as the other two I showed above, it probably makes sense to keep a close eye on the rising 50-day SMA and the short-term up channel. If both are lost, then it would be necessary to re-evaluate the group.
Next is the relative price chart, showing that the relative PPO has sailed through centerline resistance and continues to gain steam:"
http://d.stockcharts.com/img/articles/2022/12/30/878136a9-7197-4b1d-af5a-6a59966c11fa.jpg
"This is just the tip of the iceberg in terms of sector and industry rotation. It's extremely important to keep track of groups that are in favor, especially if you like to trade in the near-term. Lots of folks are writing this market off and anticipating big declines in 2023. I'm not so sure and I will be dissecting a number of market signals next Saturday at our fourth annual Market Vision event. This will be a FREE virtual event and you're invited. Seats will be limited, however, so make sure you register NOW!
For more information on MarketVision 2023 and to save your seat, CLICK HERE. David Keller, Julius de Kempenaer, and Grayson Roze - all from StockCharts.com - will be joining me to deliver timely information as we look ahead to a brand new year. I hope you join us! And of course....."
Happy New Year and happy trading!
Tom
"....no change to either the big picture or the near-term yet. So: Here's wishing everyone a safe, healthy, and prosperous New Year."
http://www.pretzelcharts.com/
"So it's the last update of 2022, and 2022 looks like it wants to go out with the near-term remaining ambiguous but with the market's longer term bearish intentions still, I believe, relatively clear:"

"Near-term, SPX still hasn't done anything but trade in a range, leaving the questions of the past couple weeks still unanswered:"

"NYA has formed a potentially interesting bi-modal near-term pattern (though there is the option of a complex flat that finds a bottom south of 15033 but north of 14866):"

"In conclusion, no change to either the big picture or the near-term yet. So: Here's wishing everyone a safe, healthy, and prosperous New Year. Let's hope 3588 is a good one! Trade safe."
Just got a down signal on the 60 min SPX chart...Target is the 10EMA now at 3834. However today seems to be a Trend day so we could reverse back up later.
https://schrts.co/SFMigkjH
"So Bulls probably don't want to see SPX much below 3784...."
http://www.pretzelcharts.com/
"Since last update, SPX made a slight new low, however NYA and INDU did not. This leaves everything in roughly the same position it was last time. I'm not crazy about the current wave pattern, because there just isn't much to say about beyond what I've already said over the past couple weeks."

"In conclusion, I wish I had more to add since last update, but the market is simply playing its cards close to the vest right now. Trade safe"
"........to rehash what I discussed on Friday: If the recent high at SPX 4100 is a b-wave, then that would make the impulsive decline (from 4100 to 3795) wave c of an expanded flat........"
http://www.pretzelcharts.com/
"It's always a little amusing when the market moves for several days, but there's still nothing to add to an update published 5 days ago, except "inflection target captured" or similar. And that's where we are. Since Friday's update, SPX did exactly what I suspected it would, which now puts us in the "to B or not to B" zone that I (preemptively) discussed then."

"The IT chart is likewise unchanged:"

"In conclusion, to rehash what I discussed on Friday: If the recent high at SPX 4100 is a b-wave, then that would make the impulsive decline (from 4100 to 3795) wave c of an expanded flat, and from here, the market could rally up to retest/break that high. If 4100 is a clean high, then we now have our first impulse down, and the next bounce will be wave 2/b and then lead to another 300 point or larger decline in 3/c. The next upside inflection will come once there are three complete waves up off the 3795 low -- more generically, 2nd waves typically retrace 50-62% of the prior decline. Of course, the market always reserves the right to whipsaw a bit near inflection zones before moving for real, so we can't rule out another low just yet, but for now, we'll presume that was it.
On another note, the bond market closes early on December 23 and there's a reasonable chance it will be a relatively light session for equities, so I'm going to forgo this coming Friday's update in order to spend more holiday time with my family. Which makes this the final update before Christmas, which in turn means it's tradition to link to a non-market piece I published 9 years ago: A Christmas Story -- Reflections on What Matters. And also, to wish everyone a safe and happy holiday, and a very Merry Christmas! Trade safe."
Glen
Enjoy your time away from the Markets this week.
Not that it matters, but I am taking a break from trading this week. I will not be posting any targets or charts...Hope everyone has a great Christmas
Glen
"...the market has now formed three waves down."
http://www.pretzelcharts.com/
"There's almost nothing to add since last update, except to note that the market has now formed three waves down. Last update discussed the possibility of SPX and INDU forming an impulsive decline and the "to B or not to B" conundrum that would place us in, but this is the first hurdle (three waves down) before we get to that place. So it's wise to at least be aware of that."

"In conclusion, there's very little to add to the last update, except as noted above. Trade safe."
"BKX might lean me slightly toward the more bearish option, as this chart does not look particularly good for bulls:"
http://www.pretzelcharts.com/
"Since last update, SPX was again rejected smack at 4100, the price point I've been watching for more than a month and a half, but the market has left a less-than-clean top in its wake, so today we're going to examine the options from here. Let's start with INDU:"

"We can see on that chart where a simple 3-wave decline might end, but I'm somewhat presuming that this will go on to become an impulsive decline for maximum ambiguity. I've drawn up the most straightforward bull and bear versions of this on the SPX chart below:"

"I've also noted this first near-term downside inflection on the SPX IT chart (presuming this does go on to become an impulsive decline, of course -- see INDU for the "3 down" option). Again, do note that this is simply the most straightforward version of this, not the "only option." If this decline does become impulsive, either as wave 1/A or as the C-wave of an expanded flat, it does not need to end in that inflection zone and is well within its rights to terminate on either side of it.
[NOTE: Typo in annotation; should read 3790-3811, not 3890-3811]"

"BKX might lean me slightly toward the more bearish option, as this chart does not look particularly good for bulls:"

"In conclusion, BKX looks a bit sickly, but the most recent tops in SPX and INDU are not ideal, leaving open the possibility of a B-wave high expanded flat pattern. Hopefully everything above helps readers to navigate this with a bit more understanding as it unfolds. Trade safe."
This market has no room for an impulse drop. the window has just about closed. Seems another month is needed. Perhaps more data on the economy and PPI/CPI next month. The PPT would near allow such a drop till past New Year celebration. the lagging CPI against the surging PPI makes no sense in the long run. there will be catch up. I suspect we get shocked starting January.
All i have to do is look at the Tulip stock, Bitcoin, and see only strong support levels and a resistance to test that support.
Holiday cheer and drink up. We managed to destroy completely all branches of government as the so called checks and balances have been tossed aside as easily as our laws. Imagine 4 Supreme Court judges taking up the argument that states can discard the will of the people in federal elections. Trump had the unfortunate timing problem. had he waited he would be deemed king today.
And yet the world continue to revolve around its axis and around the sun. We treat these earth shattering political events with a yawn. As long as the White Christian Man stands tall we worry about nothing. The 40 year cycle of disinflation is dead. Seems it might take a while to realize we are walking zombies.
We just hit by a hair the 7th wave up on this wedge pattern on SPX that started 20 days ago. It hit a wall so far but nothing dramatic on the downside. TILL we break below 3900 on a closing basis we are still in the Bulls stampede.
: "Thus, this is a neutral zone... It's not bearish until we see an impulsive decline, but neither is it a zone where one would want to initiate new long positions."
http://www.pretzelcharts.com/
"So the last two updates noted that we had three waves down but had not yet completed the required impulsive decline to indicate a trend change -- and although the wave had the overall appearance of something that might ultimately become impulsive, the market had other ideas and elected to bottom right at the inflection zone:"

"Yesterday, SPX bounced back up to tag the blue 2 inflection, but was then rejected again, which continues to leave things up in the air for now. "

"TLT has continued to rally nearly straight up since the 10/24 warning, and has now cleared next resistance:"

"In conclusion, over the past few weeks, I've probably written at least half a dozen variations of "I'm still awaiting an impulsive decline before getting too aggressive on the bearish side," and yesterday was a good example of why I take that approach during ambiguous rallies: The decline simply ended at the ALL OF C inflection and bounced furiously, illustrating why front running an impulse can be risky.
As I've also written in basically every update since December began, there is still no change to my stance, which was probably most succinctly articulated in the piece linked above, as: "Thus, this is a neutral zone... It's not bearish until we see an impulsive decline, but neither is it a zone where one would want to initiate new long positions." Trade safe."
"....we remain on the cusp of an impulse." [Down]
http://www.pretzelcharts.com/
"Since last update, while the market has technically done nothing, INDU has continued its rejection from the first blue 4 inflection:"

"I added some detail to the SPX chart, since I don't want the straight line pointing downward to be taken as an actual nuanced projected path. SPX does not need to follow the exact path shown below and probably won't, but this is more reasonably representative of the type of path SPX could take if we have already seen the start of blue 3"

In conclusion, no change from last update, and we remain on the cusp of an impulse. Trade safe.
The window for any dramatic drop has only till Friday. After that we rally thru holidays. The Monday rally will cushion somewhat a bad CPI. I still do not believe we are in a new bull cycle nor do I believe we can continue much past New Year. The street i down right giddy today making bold optimistic assumptions for 2023.
I am perplexed how the dollar and bond yields are still so low. the street is obsessed with the notion of a slowdown. Inflation has already seeped into wages. Once that happens with a tight labor market it is impossible to break the inflation trend anytime soon.
I am still waiting for that 4 day crash scenario. Like waiting for Godot. the timing and mass psychology is ride here but once the holiday spending period kicks in the FED will never allow a drop like that. It starts tomorrow or not at all.
Keeping 2022 In Perspective Will Help You in 2023
Tom Bowley | December 11, 2022 at 11:58 AM
http://stockcharts.com/articles/tradingplaces/2022/12/keeping-2022-in-perspective-wi-815.html
"At our MarketVision 2022 event on Saturday, January 8, 2022, I said stock market bulls would need patience, a lot of it, because it was going to take some time for sentiment, which was ridiculously bullish, to reset. I also said at the time that we should expect a minimum of 3-6 months of cyclical bear market action to unwind the frothy conditions that resulted from the largest 22-month gain since the 1930s. Below is an S&P 500 chart that dates back 100 years. It's a daily chart that includes a bottom panel, highlighting the 450-day rate of change (ROC). 450 trading days is approximately the equivalent of 22 months. Check this out:"
http://d.stockcharts.com/img/articles/2022/12/11/470bf958-6d70-4c3e-b7b5-3d428bb23af2.jpg
"Sometimes calling the stock market direction is just plain common sense. The 22-month gain that we saw at the end of 2021 was topped only during the 1930s (vertical red-dotted lines) as we tried to rebound from The Great Depression. These types of (nearly) 2-year rallies ONLY occur after a MASSIVE decline. The ensuing drop in the next year is quite predictable (red circles above). Since 1950, the S&P 500 has averaged gaining 9% per year. So a normal gain over 2 years would be roughly 18%. A 115% gain in 2 years is simply UNSUSTAINABLE. Those believing that the stock market would just keep flying higher in 2022 were ignoring history AND reality. It just doesn't happen. Calling a top is never easy, but understanding the risks of remaining long at the end of 2021 was quite simple. That's what I said back at MarketVision 2022. I didn't guarantee a cyclical bear market ahead, though I indicated it was certainly possible that we'd see one. Rather, I pointed out all the warning signs and then let the bearish price action CONFIRM all of those warning signs.
So what about the NASDAQ? The cyclical bear market gripped NASDAQ stocks even harder during 2022. When we began 2022, the NASDAQ's 22-month rate of change was topped only by the dot-com bubble in 2000:"
http://d.stockcharts.com/img/articles/2022/12/11/94a5a970-9090-41e6-b68d-a3a111363f63.jpg
"Can we look at these two charts and at least agree that the picture from the end of 2021 and now has completely changed? The above ROCs are telling us very different stories at the end of 2022. For only the 7th time since the late-1970s, the NASDAQ's 22-month rate of change has reached a -15 to -20%. In the secular bull market cases in the 1980s, we rebounded very quickly, generating substantial gains.
Now the question is "when is enough ENOUGH" in terms of the selling? Some might look at the NASDAQ chart and think that we have a lot further to go lower. And that's fine, if that's what you believe. We're all entitled to our opinions. I would, however, point out that the MASSIVE rally in 1999 and into 2000 occurred at the tail end of a 20-year secular bull market.
Let me show you the difference between 1999 and 2022 using a 240-month rate of change (20 years equals 240 months):"
http://d.stockcharts.com/img/articles/2022/12/11/61797320-3212-47cc-afdf-881e354494bb.jpg
"Over the 20 years ended at the end of 1999, the 20-year rate of change was 3400%, or approximately 17% per year. That is 20 years of performance WAY ABOVE the average annual return on the NASDAQ, which is roughly 11%. That type of extended outperformance is what triggers SECULAR (long-term) bear markets. At the 20-year ROC peak in 2021, we were at 850%. That equates to an average return of 4.25% over the past 20 years. That's WAY BELOW the average 11% annual return of the NASDAQ. That's one reason why I don't buy into the secular bear market argument. While our 22-month ROC was extremely high, resulting in the 2022 cyclical bear market, the 20-year ROC is nowhere near the high it will reach in another 10 years. I believe we'll see it reach 2500%-3000% in a decade.
It's been a brutal 2022, but, if we were objective at the end of 2021, it was easy to see it coming. Now it's time to pick up the pieces and OBJECTIVELY evaluate what's likely to transpire in 2023. I have confidence and conviction that I'll nail 2023 as I nailed market action in our 3 previous MarketVision events. If you'd like to join me and several of the StockCharts.com team at MarketVision 2023, here's the best news of all. It's once again FREE to everyone and there is no credit card required. You simply have to register, because I can promise you that we will reach capacity. SAVE YOUR SEAT NOW! CLICK HERE for more information and to enter your name and email address. We'll give everyone plenty to think about as you strategize in the new year!"
Happy trading!
Tom
Wages, Employment, Spending, PPI is much higher than expected. Street obsessed with a reversal, a recession yet the exact opposite is happening, revamping a heating market. The dollar and yields are no where near where they should be. On the technical we have a one month rising wedge pattern very defined in the SPX. We also have in that wedge 5 distinct waves. The major support is around 3920 area. Most bear Market last a full year, around 330 days. This one was way short (IF) the current rebound is going to continue. In other words we need to see around 3000 or 3200 on the SPX and quickly to satisfy an average bear. Holiday around the corner and the PPT would NEVER allow such a crash between Christmas and new years. it has to occur this coming week or NOT AT ALL!
the ONLY thing that holds me back declaring such a crash is here is the daily candlestick patterns for the Q's. they have had multiple bullish ones form over last 2 days. The Tuesday CPI has already been projected upwards based on the latest PPI. I am looking for a crash that started Friday and lasts FOUR trading days. Monday thru Wednesday should accelerate the drop each of those days. The wedge pattern should be destroyed on Monday.
Granted this is a HUGE wild bet and assumption. Monday has to start the big drop rolling in.
Well the jobs market was hotter than they wanted..So not going to quit raising rates..And I doubt inflation will drop much. Everybody is marking up their old stuff to new market price..So greed is going to drive some of the price too. We always made a lot of money when prices were going up..When we got the new stuff in, we just changed price on the old stuff and brought it up to current.. Grocery stores do very well during inflation..Then they try and stall price declines as long as possible.
Pretzel :
(1) Pretzel presents both a Bull and Bear case.
(2) Pretzel gives both Triggers and Targets


| Volume | |
| Day Range: | |
| Bid Price | |
| Ask Price | |
| Last Trade Time: |


