 News
News  Market Data
  Discover
Support: 888-992-3836
Copyright © 2023 InvestorsHub Inc.


Register for free to join our community of investors and share your ideas. You will also get access to streaming quotes, interactive charts, trades, portfolio, live options flow and more tools.
Good call, I did nothing also for SPXL or TQQQ. I do have small positions in IJR and IWC.
#natgas retreated because Freeport had a hiccup...NG May had a new recent low today...I'm thinking this will go through until Friday when the future months rollover...I'll be outa $KOLD with either a little loss or a little gain...commodities follow macroeconomics until the price becomes really cheap and then it's a free for all...look at the price of Cocoa...all time high because there's an issue with production in West Africa...you can keep doing what you do which is working for you...I consider myself a scientist so I use all the data I can gather to make my decisions from various sources, experts like you and others on this board and other boards, articles and news, and whatever else I can find...not a limited viewpoint...each to there own...GLTY...
META shares are tumbling 13%, wiping out some $135BN in market cap..>
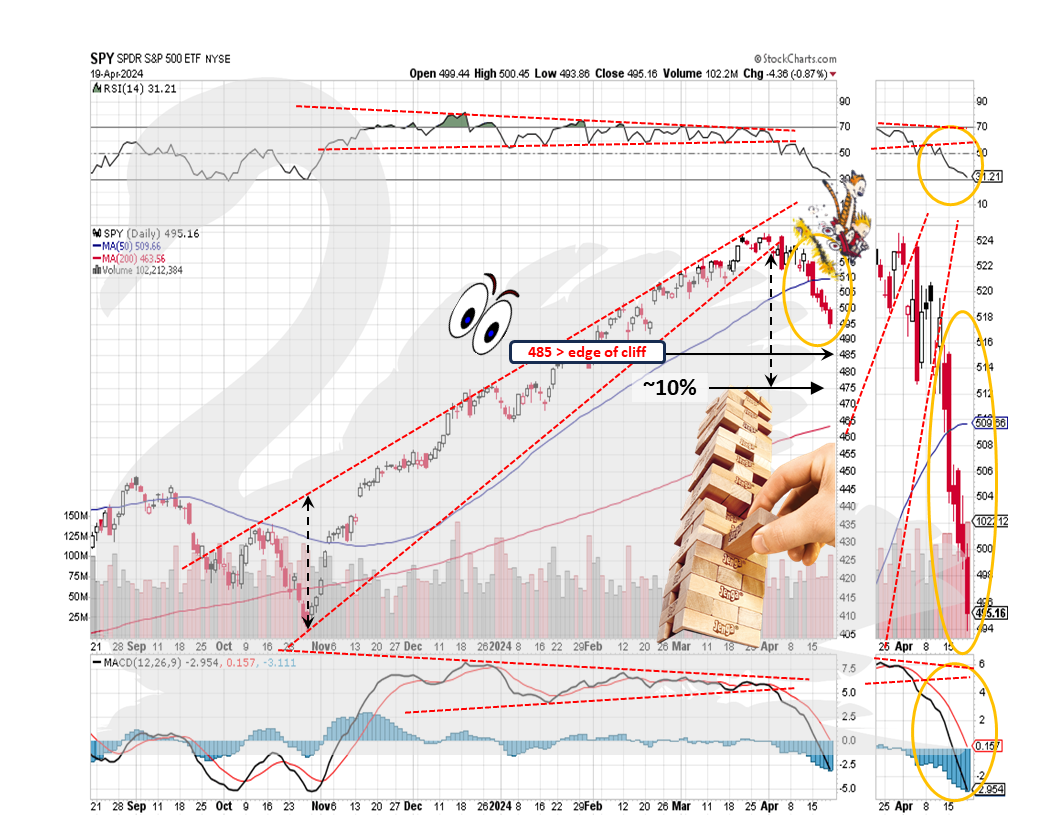
Only $135 billion > OK where is that money moving to ? > and this is only the start
Yep > block was pulled > tower is wobbling
The charts I watch are all over the place this week. Last week too.
The market didn't like META's after hours report just now. META down ~10% in AH trading.
META up ~40% for the year. 1/4 of that gone in minutes. GLTY
I bailed out of BOIL today for a -6% haircut. $NatGas is a fickle bitch. GLTY
I'm going to pass on today.
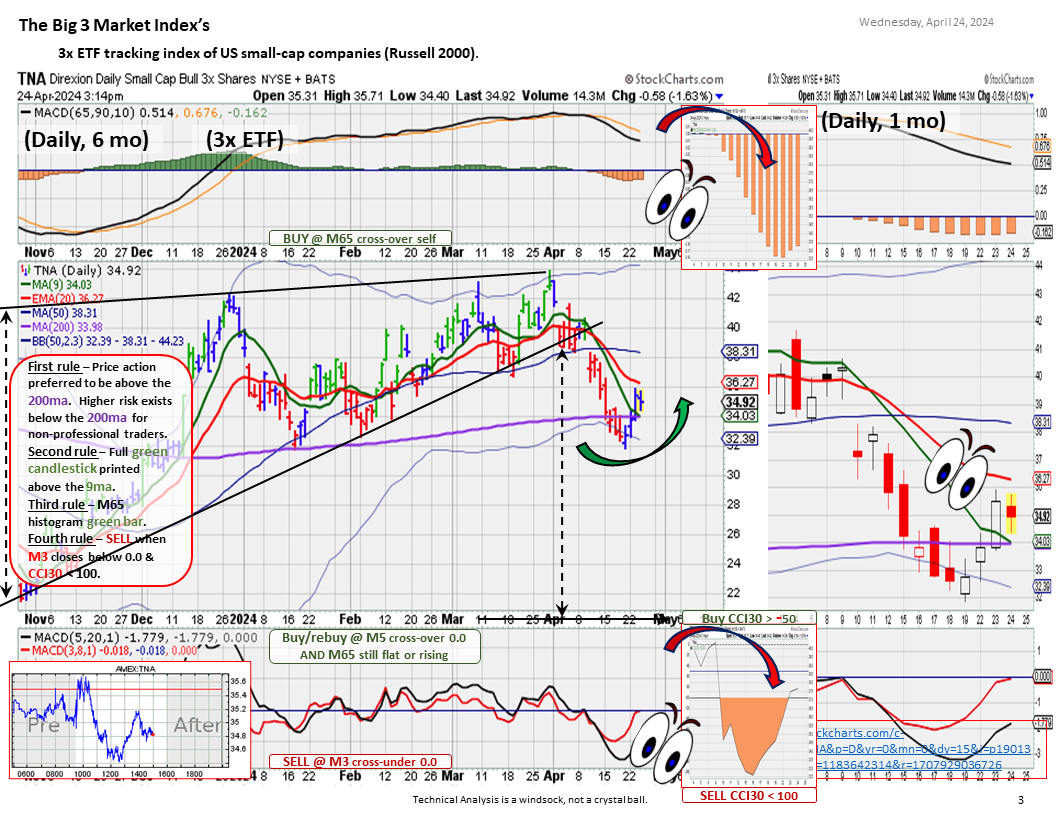
SPXL and TNA both have red candles. TQQQ, while a black candle, shows a likely closing below the 9MA. Also, M3 still below 0.0 on all three.
I will wait to see what tomorrow brings. GLTY
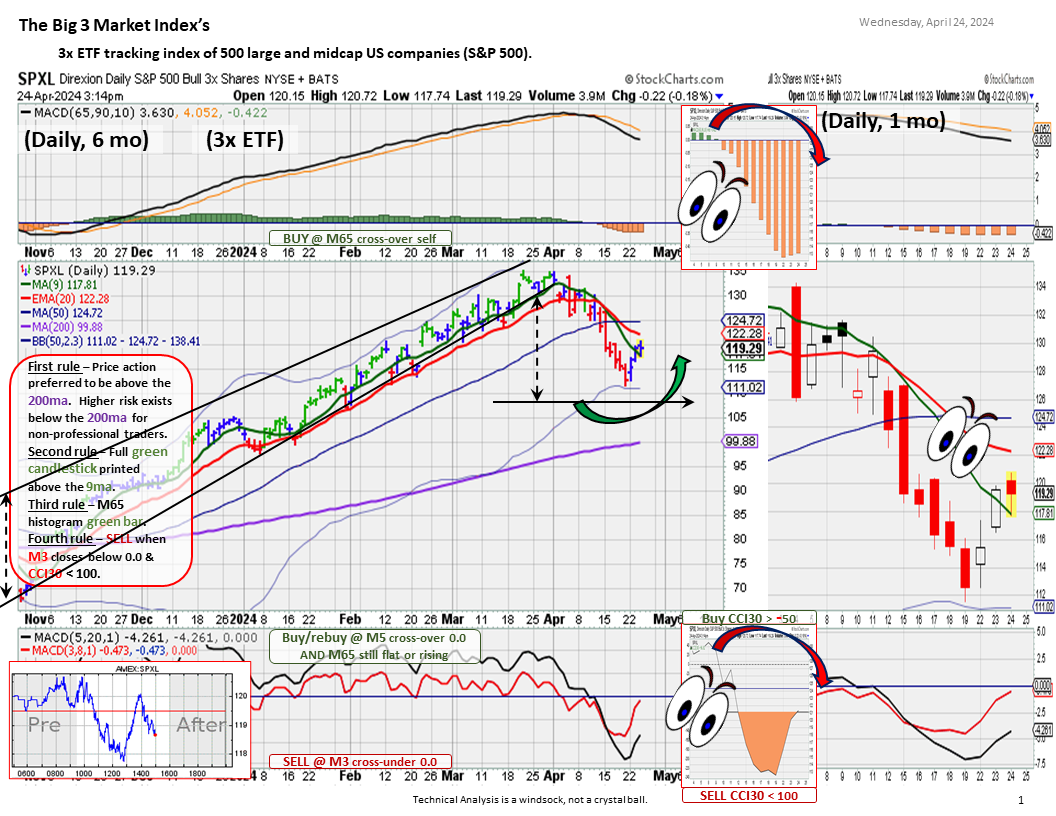

Above is above, so technically it is a buy signal.
However when its red, I usually wait an additional day for confirmation.
Sometimes I will look at the 1 hr chart for additional clarity, but to be on the safe side I wait one more day.
I would rather miss a day of gains to gain clarity than scramble to cut losses. GLTY
so far today's bar is above 9ma, but could be red. Then what?
No clue what happens from here to EOD. Just have to wait.
Mixed bag today. Market not as strong as Mon and Tue. Will likely wait one more day for confirmation, but will decide near EOD. GLTY
RE- $BOIL....10........D.. Trend LL..
https://schrts.co/DzNyhMzT
I decided not to wait. I had never heard of graphene, but the possibilities are huge. This is going to change everything having to do with computers. It has been in development since 2001 so they are a long way down the path of understanding and they have successfully made a semiconductor. I think we will be hearing a lot about this in the future. Thanks for the heads up.
I will watch later
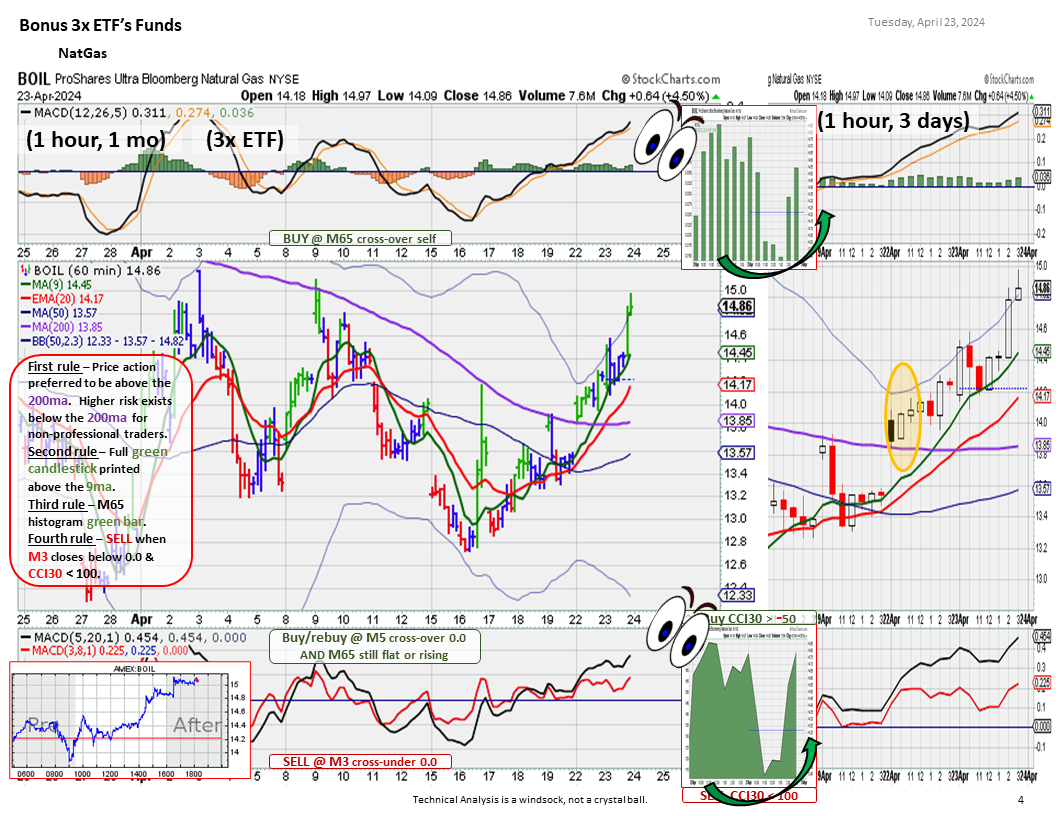
For BOIL it seems to me that that buy signal is coming pretty late. BOIL is already up 16%+. I am still not trading it, but I am watching again. Of course if it runs up another 20%, then no problem.
Good chance that is going to happe today.
I'm guessing one of the first applications for this technology will be bitcoin miners...
Macroeconomic news and events are ancillary to my trading decisions.
I find trading charts to be much more profitable. Much more. GLTY
#natgas is gapping up AHs so you should make some $$$ with $BOIL but what goes up comes down...I am still holding $KOLD after I saw this gap up...only reason NG popped is that Freeport is becoming operational again and NG is being exported again reducing the glutted supply...an example of how macroeconomics moves the price up...I saw how the price dove this morning and went back to sleep...then it popped suddenly...nothing I could do about it now i wait to limit my losses...it puts me back to where i started watching NG weeks ago...waiting for a dip...I'm going to experiment with futures instead of buying $BOIL...
BOIL signal - I got a buy signal on the 60 min chart yesterday. See yellow highlighted area on below chart. Full bar printed above the 9MA, and above the 200MA.
I waited until today for confirmation. I bought BOIL towards EOD today. GLTY
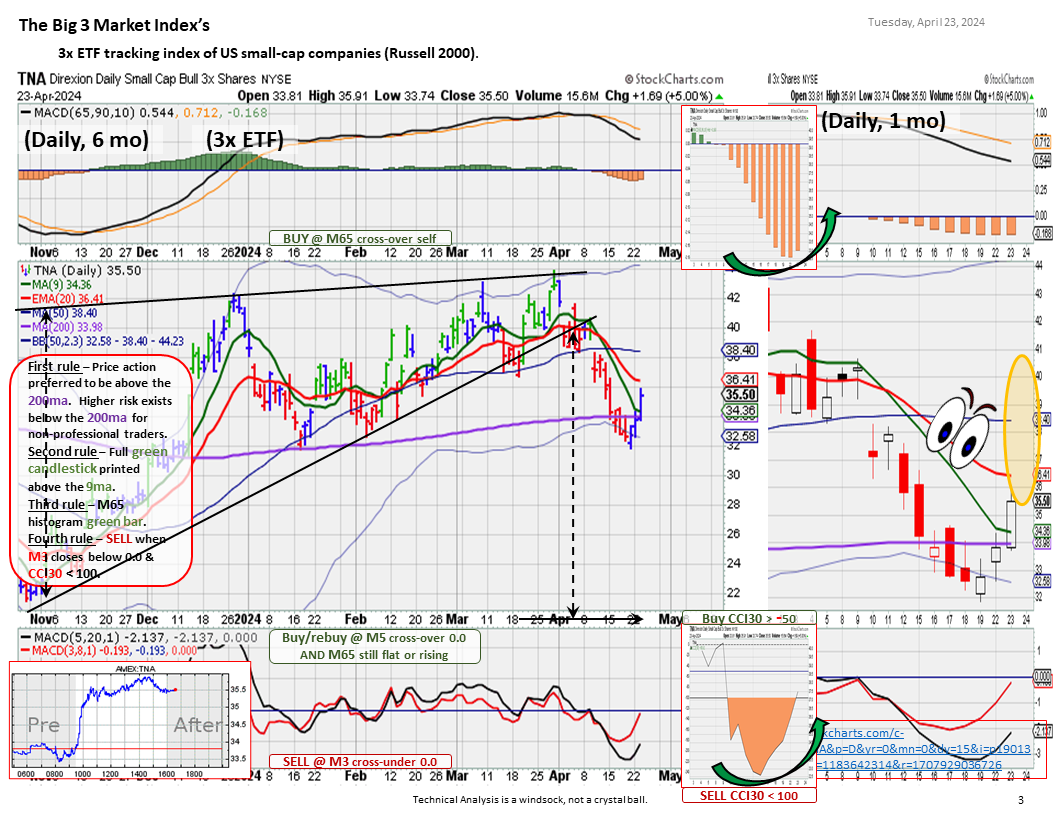
I'm with you. If we have another day tomorrow like yesterday and today, I will look for a full candle to be printed above the 9MA on all of the Big Three.
I highlighted the target areas in yellow on below charts. We will see what tomorrow brings... GLTY


D > are you relying on SC charts only?
$UCO.......Daily......ABV... R1..=BL-3UP...
https://schrts.co/WeYACWBv
$SVXY......10...30....+ ..2xD...TREND HH With TWO ( 2) GAP UP OPINION..BY charts....experience . ....
10.....
https://schrts.co/drzKXWVg
30...With Two GAPs DN.. ..heard before one cancel other...????..
https://schrts.co/ViWiZddS
[1]Dailly.......MET ...RESISTANCE MA50 RED DOTS
https://schrts.co/AQBRRTmR
[2] daily ZIG ....Look to me wave 3up in progress...
https://schrts.co/wmSQzFbN
11:54 > Out SVXY 50 @ 54.13
4/15
18:29 > In SVXY 50 @ 51.14 > small load >
I am less than 1% away on my SPY chart from a long trigger. Have set up buy stops.
QQQ is still about 3% away.
Being more aggressive in my SmAcc with 60m buys.
ARKK .....10...+D...Trend HH now....
https://schrts.co/ezXjZuVm
URTY....10.....+D...trend HH NOW....
https://schrts.co/tpXIHuUE
TNA 10......+ D...TREND HH NOW...
https://schrts.co/tpXIHuUE
WGMI 10.......Daily trend HH.
https://schrts.co/bNAwxvtc
BOIL ....10.......+ Daily tend HH..
https://schrts.co/NuzNcAeG
see what happens this week >
Page 10
Market Punishing Negative EPS Surprises More Than Average
To date, the market is rewarding positive earnings surprises reported by S&P 500 companies less than average and
punishing negative earnings surprises more than average.
Companies that have reported positive earnings surprises for Q1 2024 have seen no change in price (0.0%) on average
two days before the earnings release through two days after the earnings release. This percentage is smaller than the 5-
year average price increase of +1.0% during this same window for companies reporting positive earnings surprises.
Companies that have reported negative earnings surprises for Q1 2024 have seen an average price decrease of -6.1%
two days before the earnings release through two days after the earnings. This percentage decrease is much larger than
the 5-year average price decrease of -2.3% during this same window for companies reporting negative earnings surprises.
https://advantage.factset.com/hubfs/Website/Resources%20Section/Research%20Desk/Earnings%20Insight/EarningsInsight_041924.pdf?hsCtaTracking=31d0f488-5c02-4193-b93b-f1708067f4fa%7Cb994622e-6b82-4c98-ad34-76c848088314
SVIX.... ..Daily......trend HH today above R1...means bears at driver sea today tomorrow ??
means VIX bull at sleep today....OPINION.....
SVIX daily (BR) ABOVE R1. today
https://schrts.co/mIipSxEZ
UVIX Daily (BL) under S1...today.
https://schrts.co/PWcPqbvc
I understand you now thanks ...wish you good luck
I do the majority of my buying EOD (end of day), the close.
RIOT is the leading candidate. Looking at my Bitcoin miner matrix, it has the strongest momentum today.
WGMI is a rather new Bitcoin miners 1x ETF if you want to play them all together. GLTY
I was not expecting the bitcoin miners to turn positive so soon after the halving, but they are today.
I will look them all over near EOD and likely pick one. GLTY
SQQQ....Daily.......looking for market under Support (1) print..#..
daily O/B..look like
https://schrts.co/mgieAJnN
TSLL TSLS....Daily......
TSLS 1X BEAR..O/B
https://schrts.co/BMikVBMr
TSLL 1.5 BULL O/S
https://schrts.co/cPnMgxnY
WGMI It is ETF.....NASDAQ not EOD
TSLA is now down 46% from the recent high. I would say that is not good at all for MUSK. EV market is fading fast. Seems everyone is shifting to driverless EV market, which I have my doubts about also. I am not about to get into one.
Was not aware of WGMI. By my charts it is a daily buy EOD.
RE-WGMI 30.....+ Daily....trend HH....not find daily... R1..yet...
30.
https://schrts.co/PYijbrAC
Daily...
https://schrts.co/qAQnpbbQ
N > Thanks I read that a while ago >
This also comes / came into play > a lot of those levels hit >
posted this a few hours before 2.5 started >
=======================================
Low was 4963.25
Thursday, April 18, 2024 7:11:51 PM
NQ > looking for some possible clarity after this OpEx >
I have these CTA numbers marked >
And it's not just the Nasdaq: for the S&P emini, the next 5 sell triggers are as follows
5031.07 (MT -0.5%), 4980.29 (ST -1.5%), 4962.0- (ST -1.9%), 4950.21 (LT -2.1%) and 4937.63 (MT -2.3%)
Remember this from March?
https://investorshub.advfn.com/boards/read_msg.aspx?message_id=174051931
Well, the consequence of that expiration is beginning to show itself here in the chart below. This will get much attention in the coming weeks as small banks start to have visible difficulties similar to SVB a year ago. GLTY
https://fred.stlouisfed.org/series/WLCFLPCL
https://fred.stlouisfed.org/graph/fredgraph.png?g=1eFCh

Putting it all together, we can conclude that while CTAs will remain a source of selling pressure this week, it will be far less than entering last week - where the latest hostilities between Iran and Israel helped accelerate the triggering of bearish positions and removed much of the selling overhang - while risk-parity and vol-control may even buy. That said, if we get continued selling that pushes the S&P below the 4855 level that flips dealer gamma from positive to negative, then all bets are off... or at least they are until this coming Friday, when the buyback blackout window ends (according to the latest Goldman buyback tracker, available to pro subs)...
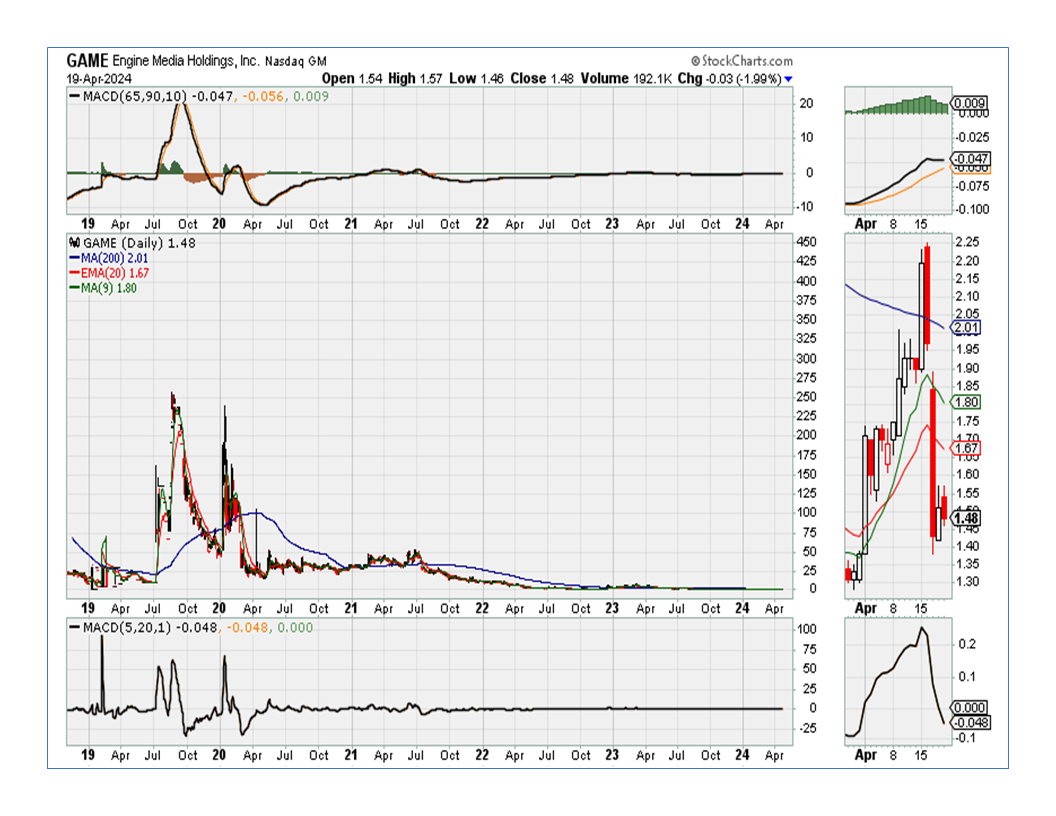
oh I just discovered $GAME...looking at 1.3 for a buyin...
Block pop-up ads http://www.adfender.com/
Dividends http://www.nasdaq.com/symbol/spy/dividend-history
Three X ETF's http://www.3xetf.com/ETF_List
| Volume | |
| Day Range: | |
| Bid Price | |
| Ask Price | |
| Last Trade Time: |


