 News
News  Market Data
  Discover
Support: 888-992-3836
Copyright © 2023 InvestorsHub Inc.


Register for free to join our community of investors and share your ideas. You will also get access to streaming quotes, interactive charts, trades, portfolio, live options flow and more tools.
China Is Not Going Away. The Energy Report
By: Phil Flynn | February 9, 2023
I do not want to burst your balloon, but China and its oil demand is not going away. Oil price shook off what you might call a somewhat bearish Energy Information Administration (EIA) as it is becoming clear that these short term increases in crude and product supplies are still not sufficient against a backdrop of the Chinese economy reopening.
Oh yes, there were naysayers and doubts about the China lifting of covid restrictions. Admittedly there have been some false starts. The fears were that rising covid cases would force China to reverse course. Yet based on recent data it is clear that China has crossed the Rubicon and for oil demand that means no turning back. Javier Blass of Bloomberg pointed out that the mobility indicators in China are soaring. He says the number of passengers using the metro in Beijing rose yesterday to 1-year high of nearly 1 million. Anecdotal data on traffic jams point to much higher gasoline demand. Tim Dallinger also pointed that Chinas domestic airline travel hit an all-time high over the Lunar Day holiday season. Perhaps there is pent-up demand to say the least. Yet while international flights still lag, one would expect they will start rising as China’s reopening of its economy gains steam.
That may be another reason why Saudi Arabia felt confident enough in Asian demand to raise its crude prices with little fear of losing market share.
It may be why traders took little comfort in EIA data that showed that total commercial petroleum inventories increased only by 3.4 million barrels last week. The EIA reported that U.S. commercial crude oil inventories (excluding those in the Strategic Petroleum Reserve) increased by 2.4 million barrels from the previous week. At 455.1 million barrels, U.S. crude oil inventories are about 4% above the five-year average for this time of year. Yet while many bears tout that based on official data crude supplies have yet to draw in the new year, there are strong signs that this is about to start changing and perhaps in a big way.
The reports showed that US crude imports were up and our exports down and that will change after refiners start to reopen. The EIA showed refiners are starting to make a slow comeback as they reported U.S. crude oil refinery inputs averaged 15.4 million barrels per day which was 448 thousand barrels per day more than the previous week’s average. Refineries operated at 87.9% of their operable capacity last week. Gasoline production decreased last week, averaging 9.1 million barrels per day. Distillate fuel production slightly decreased last week, still averaging 4.7 million barrels per day.
And while the EIA did report that total motor gasoline inventories increased by 5.0 million barrels from last week, they are still 6% below the five-year average for this time of year. The EIA said that distillate fuel inventories increased by 2.9 million barrels last week but are 15% below the five-year average for this time of year. Some say that crude supply is above average but keep in mind that SPR stocks are a whopping 215.9 million barrels below a year ago.
Gas prices may stop rising at the pump, but we are still poised for another retail gas increase as we head into summer. The EIA reported that a Colorado refinery outage is leading to higher gasoline prices in the Rocky Mountain region. On December 24, Calgary-based refiner Suncor shut down its 103,000 barrel-per-day (b/d) oil refinery in Commerce City, Colorado. Suncor announced that extreme cold weather earlier in the month had damaged equipment and that the repairs would require a full shutdown of the facility and delay operations until the end of the first quarter of 2023. The refinery outage may complicate the supply of gasoline and diesel in the Denver area and, more broadly, the Rocky Mountain region.
Oil Price reported that India gets a pass when it comes to buying Russian oil. Asia News International reported that in a tweet, citing a U.S. Assistant Secretary of State. The U.S. official was commenting on calls from Ukraine to impose sanctions on India for continuing to buy Russian crude. “We’re not looking to sanction India. Our partnership with India is one of our most consequential relationships,” Karen Donfried, Assistant Secretary of State for European and Eurasian Affairs, said. Even so, according to Geoffrey Pyatt, Assistant Secretary for Energy Resources, the purposes of the price cap are being served.
“Even though India isn’t a participant in the price cap, it has effectively used its negotiating leverage which it derives from the price cap and the fact that large portions of the global market are no longer accessible to Russia, to drive down the price of Russian crude,” he was quoted as saying by ANI.
The US is denying a report by Seymour Hersh from the New York Times that they blew up the north stream to pipeline. Russia, for their part, is calling for retaliation and an investigation. in the meantime, we may put to the test the EU price caps on Russian oil in a few months. I predict it will not be pretty.
Natural gas is back to falling like a knife mode. While the market is tempting to buy because it’s historically cheap, the fundamentals in the short term look extremely bearish. It’s a shame that the natural gas does not have liquidity in back month options because that would be the way to play this. The market does not have any open interest so it’s going to be a tough trade. Either you wait for an absolute bottom or have deep pockets to ride it out which could be a very long sell off. Today the EIA has its report on natural gas inventories, and we expect to see a pretty good 210 BCF withdrawal but that won’t be enough to overcome the warm weather forecast that we’re getting for much of the country.
Read Full Story »»»
 DiscoverGold
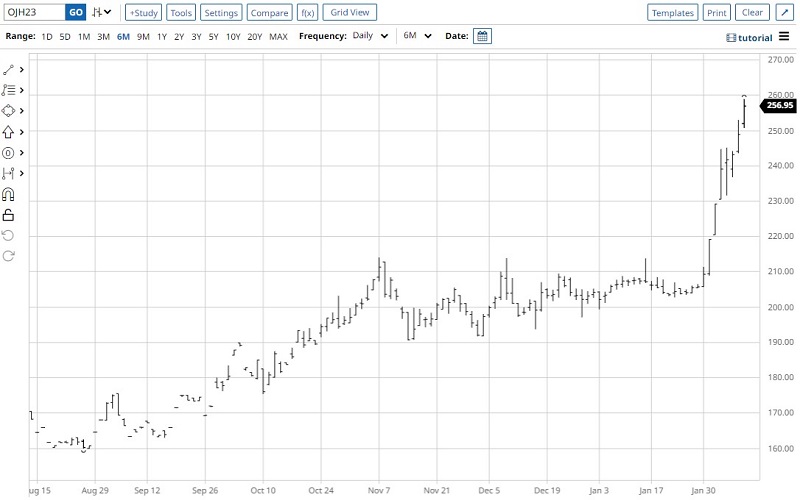
Orange juice likely racing towards a blow-off top
By: Jay Kaeppel | February 9, 2023
• Orange juice futures have soared to a new all-time high in a near-textbook example of a parabolic advance. It is impossible to predict when this advance will end. But like most previous advances of its kind, it is not impossible to predict what will follow. Even for those who will never trade orange juice, there are important lessons here to be learned.
Read Full Story »»»
DiscoverGold
OJ hits all-time highs again
By: Markets & Mayhem | February 8, 2023
• OJ hits all-time highs again.

Read Full Story »»»
DiscoverGold
2-Year Business Cycles Matter in Commodities
By: Mish Schneider | February 8, 2023

This week, we have featured the 23-month moving average, or 2-year business cycle, and its significance to the indices.
In particular, when speaking about the S&P 500, we wrote:
• There was a bullish run in 2021 based on easy money.
• Inflation ran hotter than most expected.
• The Central banks were caught off guard...and by 2022, the party was over.
So, that really begs the question of why is this year's 23-month moving average one of the most important indicators for equities.
Now, what about for gold? Anybody who has followed us, and particularly Mish, knows how bullish we are in the metal. And, after hearing the State of the Union Address Tuesday night, we are even more bullish now. Those thoughts will be published over the weekend as an addendum to the 2023 Outlook.
Let's look at the monthly chart of gold. The charts of the SPY and the Russell 2000 (IWM) both showed how they stopped rallying right under the 23-month MA. That could change, of course. Gold on the other hand, is above the 23-month MA and the 2 year business cycle. It cleared the major moving average in December, saw follow through in January 2023, and, thus far in February, is holding the gains. In fact, should gold get closer to around 168-170, that would look like a low risk buy opportunity.
If SPY and IWM cannot clear their 2-year cycles, while gold already has--watch the charts. They tell you everything.
Read Full Story »»»
DiscoverGold
Agriculture Master Report
By: Bill Moore | February 8, 2023
MAR BEANS

A Chinese surveillance balloon was shot down over the Atlantic on Saturday heightening trade friction between China & the US – forcing the CBT commodities to retreat today – as issues are sorted out! Of course, we’ve had a history of trade problems with China most recently over Taiwan. State Dept Secretary Blinken cancelled his trip to China this week! In addition, Brazil’s record bean crop is 10% in with high yields so far reported! And rain is forecast for the drought-ravaged Argentina this W/E! However, Monday inspections were solid again at 1.8 MMT (lw – 1.9) & the mkt very impressively is congesting over the $15.00 mark regardless of the many negatives! Historically, a very high price for now!
MAR CORN

Despite pressure in beans & wheat, Mar Corn is only marginally lower today – maintaining its recent 20 cent trading-range (670-690) – which it has inhabited for the past 3 weeks! Helping to support today were two flash sales at 8am – 200,00 MT to Mexico & 111,800 MT to Japan! These further corroborate an “export story” which promises a much better export scenario into the 1st Qtr of 2023 – due to the plummeting dollar & the re-opening of China! The gulf price of US corn is at parity with Brazil & Arg prices as well! The ongoing drought in Argentina seems to support the mkt on breaks! With all the negativity in the past 6 months – a looming US recession, a record Brazilian crop & the opening of the Russian-Ukraine grain corridor, the mkt’s ability to hover just under $7.00 – an historically elevated price – is garnering a lot of attention among grain traders & producers!
MAR WHT

Since the beginning of the year, Mar Wht has been confined to a 75 cent range (720-795) – supported by smaller crops in Russia & Ukraine and continued drought conditions in the central US but pressured by Russia’s relentless assault on the global wht mkt – continuing to inundate the mkt with very cheap exports – a luxury they can well afford after their recent record harvest! But a quick gander at the above bar chart shows the wht mkt a whopping $5.00 off its May highs! With any kind of export improvement & possible rally in its sister mkts, the current price should be cheap enough for the S/D fundamentals!
APL CAT

Every time, you look at the livestock complex, you have to rub your eyes! The disparity is mind-blowing. On one hand, you have cattle – a stalwart supply Bull that keep chugging along -being the beneficiary of a sharp reduction in production from the 4th to the 1st Qtr! Also, average weights have been lower & the recent Cattle Inventory Report showed #’s down 3-4%! On the other hand, is the bottomless pit that is the hog mkt – the polar opposite of the cattle – making new contract lows most every day – languishing under the weight of too much production – with 4th to 1st Qtr Production going way up! In addition, demand for hogs is lackluster, feed costs are high & the premium of Apl Hogs to cash is $7-8 higher than the average! You’d think, eventually the consumer would opt for cheap pork chops over expensive steak? Maybe, the worm is finally turning! Today, for instance, Apl cat are down $.90 & Apl Hogs are up $.50!
APL HOGS

The Apl Hogs are egregiously oversold & recently displaying extreme volatility often linked with a market turn-around! After rallying $4.00 last week, the mkt gave all that back in one day on Mon! Then, today the mkt is back up $.50! The brutal supply/demand fundamentals have been well-chronicled – over-production, meager demand & a too-high premium to cash by Apl Hogs! And the bargain-hunters have swooped in – saying “enough is enough” – thinking the consumer will finally opt for the lower-priced meat source!
Read Full Story »»»
DiscoverGold
Today's Futures Heat Map direction • Strongest: Sugar, Orange Juice, Lean Hogs, Pork Cutout
By: Barchart | February 8, 2023
• Today's Futures Heat Map
Strongest: Sugar, Orange Juice, Lean Hogs, Pork Cutout
Weakest: Natural Gas, Lumber, Nasdaq 100 E-Mini, Copper

Read Full Story »»»
DiscoverGold
Deliveries on Gas Oil/Currencies/London Sugar/Can$
By: The PRICE Futures Group | February 8, 2023
• Fri Feb 10th is Last Trading Day for Feb Gas Oil.
• Mon Feb 13th is Last Trading Day for Feb Currencies and March London Sugar.
• Tues Feb 14th is Last Trading Day for Feb Canadian Dollar.
Read Full Story »»»
DiscoverGold
Midday Wheat Prices Trading Higher
By: Barchart | February 8, 2023
Front month wheat quotes are in the black after a quiet USDA report. Chicago prices are 5 3/4 to 8 3/4 cents higher so far. KC HRW futures are trading with midday gains of 3 3/4 to 8 cents. Spring wheat quotes are up by as much as 9 cents, though new crop is only gaining a nickel. Wheat markets were stronger into the report’s release. The new cash average price is $9/bu, a dime weaker than the Jan figure.
USDA essentially left the domestic S&D tables UNCH from Jan, save for a 2 mbu lighter food use, 1 mbu more seed use, and a 1 mbu looser carryout. The average trade guess was to see a 12 mbu looser carryout.
USDA’s global S&Ds showed a 2.5 MMT production boost, mainly from Australia (+1.4) and Russia (+1). Trade was raised by 2 MMT with a 1 MMT boost for China. Carryout was 950k MT higher on net from January, which was slightly above the trade average guess going in.
Read Full Story »»»
DiscoverGold
Corn Gaining After Report
By: Barchart | February 8, 2023
The report reaction has corn futures working a penny to 4 3/4 cents in the black so far through midday. Going into the report, the corn market was fractionally mixed. The cash average price forecast for corn was UNCH at $6.70.
USDA reduced their ethanol draw in the corn balance sheet by 25 mbu to 6.69 bbu, but left exports UNCH at 1.925 billion. That upped the carryout by 25 mbu to 1.267 bbu – the trade was looking for a 1.273 bbu carryout on average.
Globally, USDA cut production 4.5 MMT, mainly from Argentina. Argentina was forecasted with a 47 MMT crop – compared to the average trade guess of 48.5 MMT. Brazil was UNCH at 125 MMT. Despite the lost production, USDA raised global trade by nearly 3 MMT, mostly via a transfer from Argentina to Brazil and a 2 MMT increase for Ukraine. Global carryout was reported to be 295.28 MMT, from 296.4 last month and 294.9 MMT expected.
Brazil’s CONAB data showed a 1.32 MMT reduced corn crop compared to their January report. The major shift was via an area reduction for second crop, down 2% to 16.97m HA (41.94m acres). They are now below USDA’s 125 MMT. The Rosario Grains Exchange estimates Argentina’s corn crop at 42.5 MMT, down by 2.5 MMT from their prior estimate and now 4.5 MMT below USDA.
EIA data released this morning showed producers averaged 1m barrels per day during the week that ended 2/03. That was down from 1.028m barrels per day during the previous week, but marked the 4th consecutive week of +1m barrel per day production. Ethanol stocks dropped 25k barrels to 24.417 million.
Read Full Story »»»
DiscoverGold
Midday Cattle Prices Mostly Red
By: Barchart | February 8, 2023
Wednesday’s cattle trade has price mixed within 25 cents of UNCH through midday. The in-delivery Feb contract is higher so far, but the other front months are lightly red. The Wednesday FCE auction sold 1 pen of 212 TX steers for $159, with the rest going unsold between $158-159 bids and +$160 asks. USDA reported some light cash trade in KS at $159. Front month feeder cattle are trading 32 to 45 cents weaker through midday. The 2/06 CME Feeder Cattle Index was $182.23 up by 94.
USDA revised their Q1 outlook for beef production to 6.83b lbs, up by 140 million. Q2 was trimmed by 90m for a net yearly increase of 50m lbs to 26.495 billion. Last year’s beef production was 28.290 billion lbs.
Wholesale Boxed Beef prices were 7 cents stronger in Choice but $3.38 weaker in Select. USDA estimated Tuesday’s FI cattle slaughter as 126,000 head. That set the week to date running total at 246k, a 2k lag from last week and 3k below the same week last year.
Read Full Story »»»
DiscoverGold
Hog Prices Higher Through Wednesday’s Midday
By: Barchart | February 8, 2023
The hog market is gaining ground so far. The summer months are leading the way with triple digit gains, as Feb and April are up by 70-75 cents so far. USDA’s National Average Base Hog price was $3.23 higher to $75.45. The CME Lean Hog Index was $73.51 on 2/06, up by another 22 cents.
USDA’s quarterly pork production estimates showed lighter output for Q1 and Q2 of the ’23 calendar year. The full year’s output is now forecasted at 27.435b lbs, 45m lighter compared to Jan’s outlook, and still 440m lbs above last year.
Pork cutout futures are mixed at midday on thin volume and OI. USDA’s National Pork Carcass Cutout value was back up by $3.76 in the AM report to $82.32. USDA estimated Tuesday’s federally inspected hog slaughter at 479,000 head. After revising Monday 7k head lower, the week to date running total is 959,000 head. That compares to 958k last week and 948k during the same week last year.
Read Full Story »»»
DiscoverGold
Midweek Cotton Market Red Through Midday
By: Barchart | February 8, 2023
Cotton futures are trading with midday losses of 32 to 96 points. The March contract is about 40 points off its low through midday, but was also in the red prior to the report. The cash average price was left at 83 cents.
USDA made essentially no changes to the domestic cotton balance sheet, with just a 100k bale lighter domestic use and looser carryout. The ending stocks figure is now shown at 4.3m bales. Global S&Ds saw a 1.03m bale production trim – mainly from India. The global carryout was 850k bales tighter to 89.08 million.
USDA’s Ag Attaché reduced the Pakistani cotton import forecast to 4.5m bales from 5 flat citing importer financing. Their total use was unchanged at 9m bales such that the 500k supply cut came out of their ending stocks. In the WASDE report, USDA had Pakistan’s cotton import at 4.5 million, also lighter by 500k bales, with a 1.44m bale carryout.
CONAB increased their cotton production outlook by 19.2% to 13.97m bales – USDA has their updated forecast at 13.3 m bales as of the WASDE update.
The Cotlook A Index was 98.80 cents/lb on 2/07, which was 190 points lower. The AWP for cotton is 75.24 cents for the week.
Read Full Story »»»
DiscoverGold
Oil Oxymoron President Biden. The Energy Report
By: Phil Flynn | February 8, 2023
Joe Biden was apparently off script and addressed the Biden administration’s oil oxymoron. No I am not talking about Occidental Petroleum or any other derivative of that word but the fact that the Biden administration loves to bash oil companies for not producing more oil but at the same time vowing to end fossil fuels.
In the prepared script, Biden, as he always does, slandered oil companies by saying, “You may have noticed that Big Oil just reported record profits. Last year, they made $200 billion in the midst of a global energy crisis. It’s outrageous. They invested too little of that profit to increase domestic production and keep gas prices down. Instead, they used those record profits to buy back their own stock, rewarding their CEOs and shareholders.”
Yet this is the industry he vowed he would put out of business, vowing an end to fossil fuels. He also failed to acknowledge that just a few years ago these companies took losses of billions of dollars and shareholders should be rewarded for sticking it out especially with the most hostile openly anti-fossil fuel President in history. If Biden is truly a capitalist like he says his is, then he should realize that you should be rewarded for taking big risks especially when the fruits of that risk benefits humanity as it does with energy production that touches and improves everyone’s lives.
Yet in a very lucid moment Biden went off script telling one of his stories that when he was pressing oil executives to invest and produce more oil, claims they said that, “We’re afraid you’re going to shut down all of the oil wells and all the oil refineries anyway so why should we invest in them?” “We’re going to need oil for at least another decade, and beyond that.” That shocked the radical green energy legislature that booed Biden for speaking the truth. Even BP that said it was moving “Beyond Petroleum” had to switch course by saying that, “There is much more conversation about energy security, energy affordability. You need to invest in today’s energy system” .
You think! What good is energy if you can’t afford it? Every major reporting agency, even the International Energy Agency (IEA) which should change its name to the International Green Energy Agency, says that, “Global Oil demand will still be at 80 million barrel a day 25 years from now. This is the same agency that has massively underreported demand for the last decade and just had to raise their demand forecast this year to acknowledge that demand will hit a all-time record high of 101.7 million barrels per day, up 200,000 bpd from their last forecast.
The Energy Information Administration also raised their crude oil demand and price forecast yesterday. The EIA said that global liquid fuels consumption will increase by 1.1 million barrels per day (b/d) in 2023 and by 1.8 million b/d in 2024, driven primarily by growth in China and other non-OECD countries. The outcomes of our demand forecast remain uncertain as China shifts away from its zero-covid-19 policy and global economic conditions evolve. They said they expect the EU’s ban on seaborne petroleum products from Russia that began February 5 will cause refineries in Russia to reduce crude oil inputs, which will disrupt crude oil production.
Prices are also getting a boost this morning and the fact that the American Petroleum Institute showed the first crude oil drawdown this year. That was not expected and it could be a sign of things to come in future weeks. The API reported that crude supply fell 2.18 million barrels. Cushing, OK increased by 178,000 barrels. Gasoline inventories were surprisingly up 5.26 million barrels and the distillate inventories were up 1.109 overall a positive report.
Oil is also getting support from increasing Chinese demand that we said would not be a question of if but when. That is now. Saudi Arabia is taking full advantage raising its prices for oil and slowing production. Petrologistics reports that Saudi Arabian crude exports in January fell to the lowest level in over six months as the Kingdom reins in production to abide by OPEC quotas.
Biden also touted Electric cars but failed to point out that the vast majority of lithium-ion batteries—about 77% of the world’s supply—are manufactured in China, where coal is the primary energy source. Coal emits roughly twice the amount of greenhouse gases as natural gas, another fossil fuel that can be used in high-heat manufacturing according to MIT. Not to mention the horrid conditions in Africa as children are being exploited to mine for cobalt to make those batteries.
The EIA for natural gas according to Reuters said that, “U.S. natural gas production will rise to a record high in 2023, while demand will fall, the U.S. Energy Information Administration (EIA) said in its Short Term Energy Outlook (STEO) on Tuesday. EIA projected dry gas production will rise to 100.27 billion cubic feet per day (bcfd) in 2023 and 101.68 bcfd in 2024 from a record 98.09 bcfd in 2022.The agency also projected domestic gas consumption would fall to 87.04 bcfd in 2023 and 86.10 bcfd in 2024 from a record 88.63 bcfd in 2022.
Read Full Story »»»
DiscoverGold
Coffee Closes Moderately Higher On Reduced Colombia Coffee Supplies
By: Barchart | February 7, 2023
March arabica coffee (KCH23) on Tuesday closed up +1.35 (+0.77%), and Mar ICE robusta coffee (RMH23) closed up +44 (+2.16%).
Coffee prices on Tuesday settled moderately higher. Smaller coffee exports from Colombia are bullish for arabica prices after the Colombia Coffee Growers Federation reported Tuesday that Colombia Jan coffee exports fell -19% y/y to 835,000 bags. Coffee exports from Colombia have declined recently as Colombia's 2022 coffee exports fell -8% y/y to 11.1 mln bags. Colombia is the world's second-biggest producer of arabica coffee beans.
Another supportive factor for arabica is heavy rain in Minas Gerais, Brazil's largest arabica growing region, which has kept farmers out of fields and delayed the application of fertilizers and pesticides. Also, the heavy rain has led to an increase in coffee rust in some trees. Somar Meteorologia reported Monday that Brazil's Minas Gerais region received 81.3 mm of rain last week, or 116% of the historical average. Minas Gerais accounts for about 30% of Brazil's arabica crop.
Last Wednesday, arabica posted a 3-1/2 month high, and robusta last Tuesday posted a 3-3/4 month high on concern about smaller global coffee supplies. Rabobank cut its global 2023/24 coffee surplus estimate to +1.6 min bags from a November estimate of +4.0 mln bags. Also, Volcafe said because of weak flower blossoms on coffee trees in the Minas Gerais coffee-growing region, it cut its Brazil 2023/24 arabica coffee production estimate to 40.5 mln bags from a July forecast of 49.8 mln bags.
A bullish factor for robusta coffee is the tightness in global supplies. Vietnam's General Statistics Office reported last Monday that Vietnam Jan coffee exports sank -30.9% y/y to 160,000 MT. Also, robusta coffee inventories are shrinking as ICE-monitored robusta coffee inventories Tuesday fell to 5,965 lots, the fewest since contract rules changed in 2016.
Smaller global coffee supplies are bullish for prices after the International Coffee Organization (ICO) reported last Thursday that Oct-Dec global coffee exports have fallen -2.8% y/y to 30.27 mln bags. Also, Cecafe on January 16 reported that Brazil's 2022 green coffee exports fell -2.7% y/y to 35.6 mln bags, the lowest in 4 years.
Robusta has support after coffee trader Volcafe forecasted that the global 2023/24 robusta coffee market would see a record deficit of 5.6 mln bags as Indonesia, the world's third-largest robusta producer is expected to see its 2023/24 robusta coffee production fall to 9.1 mln bags, the smallest robusta crop in 10 years due to damage from excessive rainfall across its growing regions.
In a bearish factor, ICE arabica coffee inventories have risen steadily since falling to a 23-year low of 382,695 bags on November 3 and posted a 7-1/4 month high of 887,378 bags Tuesday. Also, Conab on January 19 forecasted the 2022/23 Brazil arabica crop would rise +14.4% to 37.4 mln bags.
Increased coffee exports from Vietnam, the largest robusta producer, are bearish for robusta prices after the General Statistics Office of Vietnam reported last Tuesday that Vietnam's 2022 coffee exports were estimated at 1.78 MMT, up +14.1% y/y.
On the negative side, U.S. green coffee inventories are plentiful after the Green Coffee Association on January 17 reported that U.S. Dec green coffee inventories rose +9.3% y/y to 6.38 mln bags.
The USDA, in its bi-annual report released on December 23, cut its global 2022/23 coffee production estimate by -1.3% to 172.8 mln bags from a June estimate of 175.0 mln bags. In addition, the USDA cut its 2022/23 global coffee ending stocks estimate by -1.7% to 34.1 mln bags from a June estimate of 34.7 mln bags. Meanwhile, the USDA's Foreign Agriculture Service (FAS) on November 22 cut its Brazil 2022/23 coffee production forecast by -2.6% to 62.6 mln bags from a prior estimate of 64.3 mln bags. This year was supposed to be the higher-yielding year of Brazil's biennial coffee crop, but coffee output this year was slashed by drought.
Read Full Story »»»
DiscoverGold
Sugar Moderately Higher As Prices Consolidate The Recent Rally
By: Barchart | February 7, 2023
March NY world sugar #11 (SBH23) on Tuesday closed up +0.18 (+0.87%), and March London white sugar #5 (SWH23) closed up +8.80 (+1.60%).
Sugar prices Tuesday closed moderately higher as they consolidated below last week's significant highs. Last Wednesday, NY sugar posted a 6-year high, and London sugar posted a 4-3/4 month high on reduced sugar output and smaller sugar exports from India. Last Tuesday, the ISMA cut its 2022/23 India sugar production estimate to 34 MMT from an Oct estimate of 36.5 MMT and cut its India 2022/23 sugar export estimate to 6.1 MMT from an Oct forecast of 9 MMT. In addition, the ISMA said that it sees India's sugar mills diverting 4.5 MMT to 5.0 MMT of sugar to ethanol production in 2022/23.
Reduced sugar production in Europe is a supportive factor for sugar prices. The European Association of Sugar Manufacturers on Dec 8 forecasted that EU 2022/23 sugar output would fall -7% y/y to 15.5 MMT.
A bearish factor for sugar was last Thursday's report from the Indian Sugar Mills Association (ISMA) that showed India's 2022/23 sugar output from Oct-Jan was up +3.4% y/y at 19.35 MMT. India is the world's second-largest sugar producer. Also, the Thai Sugar Mills Corp last Wednesday projected Thailand's 2022/23 sugar production would climb +14% y/y to 11.55 MMT. However, Thailand's 2022/23 sugar exports are projected to decline -17.7% y/y to 9.05 MMT. Thailand is the world's second-largest sugar exporter.
A negative factor for sugar was the Jan 11 report from Unica that showed Brazil's 2022/23 sugar production through December rose +4.4% y/y to 33.462 MMT. Brazil is the biggest sugar producer in the world.
In a bearish factor, the International Sugar Organization (ISO) on Nov 22 projected that global 2022/23 sugar production would climb +5.5% y/y to a record high of 182.1 MMT. Also, ISO projected that the 2022/23 global sugar market would be in a surplus of +6.2 MMT.
Read Full Story »»»
DiscoverGold
Cocoa Prices Post Modest Gains As ICE Cocoa Inventories Tighten
By: Barchart | February 7, 2023
March ICE NY cocoa (CCH23) on Tuesday closed up +4 (+0.16%), and March ICE London cocoa #7 (CAH23) closed up +14 (+0.69%).
Cocoa prices Tuesday posted modest gains on tighter cocoa inventories. ICE-monitored NY cocoa inventories held in U.S. ports fell -9,903 bags Monday and are just above the 9-1/2 month low from January 3. Also, ICE-monitored cocoa stockpiles held in EU ports fell to a 10-month low Monday of 112,820 MT.
Gains in London cocoa accelerated Tuesday after the British pound (^GBPUSD) fell to a 1-month low against the dollar. The weaker pound boosts cocoa priced in sterling.
Cocoa prices have seen support from concern about the quality of some West African cocoa crops. Cocoa farmers continue to struggle with the lack of fertilizer and pesticides as the war in Ukraine has limited Russian exports of potash and other fertilizers worldwide.
On the positive side for cocoa are smaller cocoa exports from Nigeria after the Cocoa Association of Nigeria reported on January 24 that Nigeria's Dec cocoa exports fell -0.7% m/m and -73% y/y to 36,571 MT. Nigeria is the world's fifth-largest cocoa bean producer.
Ample supplies from the Ivory Coast are bearish for cocoa prices. Monday's government data showed that Ivory Coast farmers sent a cumulative 1.62 MMT MT of cocoa to Ivory Coast ports for the 2022/23 marketing year from October 1 through February 5, up +5.2% y/y.
Global cocoa demand is tepid and is a negative factor for prices. On January 19, the National Confectioners Association reported that Q4 North American cocoa grindings fell -8.1% y/y to 107,130 MT. Also, the European Cocoa Association reported on January 19 that European Q4 cocoa grindings fell -1.7% y/y to 359,577 MT. On January 18, the Cocoa Association of Asia reported that Asia Q4 cocoa grindings fell -0.2% y/y to 230,806 MT.
The quarterly report from the ICCO on December 1 was bullish for cocoa prices after ICCO said global 2021/22 cocoa production fell -8.0% y/y to 4.823 MMT as unfavorable weather and disease hampered cocoa yields. ICCO revised its 2021/22 global cocoa production figure downward by -419,000 MT from the September figure. ICCO also raised the 2021/22 global cocoa deficit to -306,000 MT from a Sep forecast of -230,000 MT. In 2020/21, global cocoa production rose to a record 5.242 MMT, and the global cocoa market was in a surplus of +209,000 MT.
Read Full Story »»»
DiscoverGold
Today's Futures Heat Map • Weakest: Lumber, Soybean Meal, Pork Cutout, U.S. Dollar Index
By: Markets & Mayhem | February 7, 2023
• Today's Futures Heat Map
Strongest: Heating Oil, Cotton, Palladium, Crude Oil
Weakest: Lumber, Soybean Meal, Pork Cutout, U.S. Dollar Index

Read Full Story »»»
DiscoverGold
The Corn & Ethanol Report
By: Daniel Flynn | February 7, 2023
We kickoff the day with Balance of Trade, Exports, Imports at 7:30 A.M., Redbook YoY at 7:55 A.M., IBD/TIPP Economic Optimism at 9:00 A.M., Fed Chair Powell Speech at 11:40 A.M., 3-Year Note Auction at 12:00 P.M., Fed Barr Speech at 1:00 P.M., Consumer Credit Change at 2:00 P.M., and API Energy Stocks at 3:30 P.M.
On the Corn Front we rallied going into the close in yesterday’s action. The March contract had an inside day with traders keeping their cards close to their vest as we head into tomorrow’s Crop Production USDA Supply/Demand and WASDE data. We have forecasts of hot & dry weather in Argentina this week. China has threatened retaliation for the US for downing the so-called weather research balloon. This should only add to market volatility. US corn Export Intentions were down again keeping pace for the marketing year well behind last year. The USDA said export inspections totaled 480,205 metric tons for the week ended Feb 2, down from 542,989 mt reported last week and 1.07 million mt at this time last year. In the overnight electronic session the March corn is currently trading at 677 ¼ which is 1 ¾ of a cent lower. The trading range has been 678 ½ to 675 ¾.
On the Ethanol Front Kemin Bio Solutions launches FermSaver for use in ethanol production. Kemin Industries, a global ingredient manufacturer that strives to sustainably transform the quality of life evert day for 80% of the world with its products and services, recently launched FermSAVER, a tea-extract product utilized during yeast formation for ethanol production, as part of its growing Kemin Bio Solutions portfolio. FermSAVER was developed to help reduce stress when yeast is exposed to excess heat generated during the summer months. Supplementation with FermSAVER has shown to improve ethanol production during periods of heat stress compared to yeast alone. “Managing heat during ethanol production is critical to any bioethanol facilities,” said Jason Ackerman, General Manager, Kemin Bio Solutions. “We are thrilled to introduce FermSAVER, which can give ethanol producers peace of mind during high-heat periods by helping to maintain productivity.” During Industrial formation, yeast generates excessive heat through normal metabolic processes. In the absence of cooling – and during summer months when chiller effectiveness is lower-yeast formation is significantly affected, resulting in reduced ethanol production. Ethanol manufacturing facilities have typically relied on cooling towers to reduce the negative consequences of heat generated during formation, but cooling towers may fail or become overwhelmed during periods of high heat. Ethanol futures remain in drydock.
Read Full Story »»»
DiscoverGold
China Retaliates. The Energy Report
By: Phil Flynn | February 7, 2023
Just when you thought it was safe to shoot down a Chinese spy balloon, China may just retaliate by reopening its economy and sucking down every spare barrel of oil on the earth. Ok, maybe China reopening its economy has nothing to do with the Chines spy balloon, but the reality is that as China reopens it’s economy, the demand growth will squeeze the global oil supply. That will have us soon forget about the recent sharp increases in US crude oil supply that in just weeks, when refineries start running out, will turn into substantial draws without any SPR oil to bail the market out.
In fact, because of the underinvestment in oil and gas production that I have warned about forever and the relatively low return both from an energy standpoint and economic results, even BP tried to rebrand itself as ‘beyond petroleum’ and is now sending signals that it may have to redirect its capital back to petroleum. As their record-breaking results trailed their peers in the industry and the results of the billions they have sunk into energy sources that went beyond petroleum have not been able to match the efficiencies of oil and gas. The same oil and gas power the global economy needs and will improve the lives of billions around the globe.
Javir Blass at Bloomberg News pointed out that, “When Bernard Looney took over as chief executive officer of BP Plc in 2020, he promised to quickly decarbonize the British oil major, cutting oil and gas production by 40% by 2030 and channeling billions of dollars into the wind and solar projects. It was a stronger version of the “Beyond Petroleum” slogan BP once used. On Tuesday, Looney altered course.
The company put out some fine words about its commitment to green energy and several billion dollars in investment to back it. But in tandem, it promised shareholders it would invest heavily in oil and gas projects. Instead of a 40% output cut, oil and gas production would fall by 25% by the end of the decade. Don’t say it out loud — because Looney took pains to emphasize that rather than reversing strategy, he was “leaning in” to it — but the new slogan is somewhat closer to “Back into Petroleum”. A rival joked that Looney’s climb-down meant BP stood for “Bitter Pill.” Hyperbolic, perhaps, but there’s a point.
Borrowing from language that ExxonMobil Corp. used last week, Looney explained his new vision on a Bloomberg TV interview: “We must invest in today’s energy system, and the reality is that today’s energy system is predominantly an oil and gas system. And that needs investment.”
China understands that and we also understand that they’re going to have to secure a lot of oil to reopen their economy. We are already seeing signs in China that travel is back to pre-COVID levels. Demand is so good that Saudi Arabia feels comfortable raising the price of oil to Asia, sending a signal that they are confident that the China reopening is going to continue along this path. That is a very bullish development and with oil double bottoming, that should be at a bottom. Reuters reported that, “The International Energy Agency (IEA) expects half of this year’s global oil demand growth to come from China, the agency’s chief said on Sunday, adding that jet fuel demand was surging. Saudi Arabia, the world’s top oil exporter, raised prices for its flagship crude for Asian buyers for the first time in six months amid expectations of demand recovery, especially from China.
Operations at Turkey’s 1 million barrel per day (bpd) oil export terminal in Ceyhan were halted after a major earthquake hit the region. Bloomberg is reporting that Iraq hopes to resume pumping oil through Turkey on Tuesday afternoon after safety checks following two devastating earthquakes revealed no damage. “They checked the pipes and there was no damage to them or to the storage tanks,” an official from SOMO, Iraq’s state oil-marketing firm, said to Bloomberg. “The pumping could resume today. It is highly probable to resume.” Earlier on Tuesday, Turkey ordered the resumption of crude flows to the Ceyhan export terminal on the Mediterranean coast, according to an official with direct knowledge of the matter.
Perhaps the only thing that can mess things up at this point is the Fed. As long as fed chairman Jerome Powell doesn’t sound too hawkish, the reality is going to start to set in that oil prices have been focused on the short term and focused on the fact that China may not reopen its economy, are going to face the harsh reality those things are going to happen. Tonight’s inventories may show another crude oil build it may be the last that we see for some time.
US gasoline demand also seems to be exceeding expectations. Refinery demand has been weak because of refining issues but that should be solved in the coming weeks we expect to see gasoline prices after a quick dip to start to rally pretty hard at the gas pump.
Reuters is reporting that, “A national strike against planned pension reforms reduced France’s power supply and disrupted petrol deliveries from French refineries on Tuesday. Strikes have been taking place since mid-January as unions protest against the government’s plans to make people work longer before retirement. Public transport and schools have also been affected. Total power supply was reduced by about 4%, or 2.9 gigawatts (GW) due to decreased supply at two nuclear reactors and several thermal plants, data from power utility EDF (EDF.PA) showed.
Read Full Story »»»
DiscoverGold
Second thing I noticed was the sharp uptick in participation in the wheat tender. While many of the offers were of Russian origin there were over 20 offers from at least 13 suppliers. In late 2021 there were instances when 5 offers were hard to come by, with prices substantially higher. The depth of offers in tenders going forward as well as the cash price paid will continue to give great insight into not only global demand, but the attitude and comfort level of global grain supplies and buyers.
I strongly believe OJ is going to rollover downside.
Mar 23 wheat is up 4.5¢ per bushel.
Wheat Fades To Red On Monday
By: Barchart | February 6, 2023
Old crop HRW wheat prices held onto gains for the close, but they were limited to 3 cents – with March 10 1/2 cents off its daily high. The new crop HRW prices were fractionally mixed to 2 cents weaker. CBT SRW ended the day down by 4 1/2 to 6 1/2 cents. MPLS spring wheat futures went home 3 1/2 to 4 cents lower on the week’s first trade day.
NASS state statistics showed TX winter wheat was 2 points lower on the Brugler500 compared to last week at a 235, with 13% good and no excellent. Winter wheat there was 7% headed, compared to 5% last week and the 5-yr average of 5%.
Weekly Inspections data showed 536,355 MT of wheat was exported during the week that ended 2/02. That was up from 446k MT last week, and was 102k MT above the same week last year. USDA’s data had +100k MT for each class, but white wheat led the week with 174k MT of the total. The accumulated wheat export was at 13.759 MMT as of 2/02, trailing last year’s pace by 291k MT.
Ukraine’s Ag Ministry expects the 2023 grain harvest will be 45-50 MMT, down from 2022’s 53.2 MMT grain crop.
Russia’s wheat export tax will be 4,497 Rubles/MT (~$63.75/MT) this week, according to Interfax. That is up from 4,365 last week.
U.S. wheat carryout is anticipated to loosen 7.6 mbu in USDA’s Feb WASDE, according to the average of pre-report estimates. That would leave carryout at 574.6 mbu if realized. The full range of estimates for domestic wheat stocks is from 557 (-10) to 612 (+45) mbu. Global wheat stocks are estimated to be reported at 268.8 MMT, which would be 400k MT looser if realized.
Read Full Story »»»
DiscoverGold
Monday Corn Closes In Black
By: Barchart | February 6, 2023
Corn spent most of Monday in the red, but ended the day near the highs. March corn closed up by 1 1/2 cents after trading in a 7 cent range from -5 1/4 to + 1 3/4 cents. The other front months went home up by 1 3/4 to 3 1/4 cents on the day.
USDA announced two large private export sales this morning, with 111,800 MT of old crop sold to Japan and 100k MT of each old crop and 23/24 crop sold to Mexico.
Weekly Export Inspections data showed 480,205 MT of corn was shipped during the week that ended 2/02. That was a drop of 62,784 MT for the week and was 55% below the same week last year. Mexico was the top destination with 322k MT of the total. The accumulated corn shipments remain 33% behind last year's pace with 12.5 MMT shipped MYTD. USDA also had 496,706 MT of sorghum exports for the season through 2/02 – that trails last year’s 2.433 MMT pace.
Ukraine’s Ag Ministry expects the 2023 grain harvest will be 45-50 MMT, down from 2022’s 53.2 MMT grain crop – itself includes ~9% of unharvested corn in the fields.
Ahead of the monthly S&Ds from USDA, the trade is looking for a 3.5 MMT cut to the Argentina corn crop and a 300k MT boost for Brazil. Total global carryout is expected to be 1.5 MMT lighter at 294.5 MMT.
Read Full Story »»»
DiscoverGold
Soy Oil Ends Higher
By: Barchart | February 6, 2023
Soybean oil went home up by 3 to 25 points on Monday, after a tighter daily trading range from -63 points to +61 points. The soymeal trade worked mostly lower, after seeing a $500 contract high in the March. Futures settled down by $3.80 to $7.50. That left the beans 11 cents weaker nearby, as new crop futures ended 1 1/2 to 4 3/4 cents lower.
USDA reported 1.83 MMT of soybean exports for the week that ended 2/02. That was just under 1.93 MMT last week, but was up 589k MT from the same week last year. China was the main destination, with 63% of the total. USDA marked the season’s export at 37.9 MMT, now ahead of last year's pace by 209k MT.
Analyst estimates ahead of the WASDE report are looking for USDA to cut 3.5 MMT off the Argentina soy crop – taking it to 42 MMT according to the average. The lowest estimate is to see 38 MMT on Wednesday, nearer to the 36 MMT the Attache had. For Brazilian soybeans, traders are looking for USDA to raise production by 200k MT on average.
Patria reported the Brazilian soybean harvest at 9.86% finished. That is down from last year’s 20.4% pace. Safras and Mercado estimated 7.8% of planted area was harvested, and they compared that to 17.1% last year and 10% on average.
Rosario Grains Exchange estimated 1.06 MMT of soymeal were exported from Argentina in January. That is the lowest volume for the month since 2002.
Read Full Story »»»
DiscoverGold
Sharp Drop For Hog Market
By: Barchart | February 6, 2023
April hogs saw new lows on Monday after trading to levels not seen since December of 2021. At the close, the board was ~30 cents off the day’s low, but still down $2 to $3.75. Feb hogs were the outlier, as expiration draws near, ending the day with a 2 cent gains. USDA’s National Average Base Hog price was 31 cents weaker on Monday afternoon to $72.34. The 2/02 CME Lean Hog Index was $73.05, up by 20 cents.
Pork cutout futures went home $2.20 to $2.85 weaker in the front months – past Feb’s 7 cent gain. USDA’s National Pork Carcass Cutout value was $2.53 higher in the PM report to $81.62. The bellies were quoted at $99.44 after an $8.35 increase. CME’s Fresh Bacon Index was $120.74 on 2/3, compared to $122.32 from the prior week. USDA estimates federally inspected hog slaughter at 487,000 head for Monday. That compares to 475k head last week and 479k head during the same week last year.
Read Full Story »»»
DiscoverGold
Commodity price changes over the last year...
By: Charlie Bilello | February 6, 2023
• Commodity price changes over the last year...
Sugar: +18%
Corn: +10%
US CPI: +6.5%
Gold: +4%
Wheat: +1%
Silver: +1%
Soybeans: -1%
Heating Oil: -2%
Copper: -9%
Gasoline: -12%
Zinc: -12%
Brent Crude: -12%
WTI Crude: -19%
Coffee: -29%
Cotton: -33%
Natural Gas: -51%
Lumber: -51%
Read Full Story »»»
DiscoverGold
Today's Futures Heat Map • Weakest: Lean Hogs, Pork Cutout, Lumber, Sugar
By: Barchart | February 6, 2023
• Today's Futures Heat Map
Strongest: Coffee, Gasoline, U.S. Dollar Index, Feeder Cattle
Weakest: Lean Hogs, Pork Cutout, Lumber, Sugar

Read Full Story »»»
DiscoverGold
Deliveries on Cattle/Sugar/Gas Oil
By: The PRICE Futures Group | February 6, 2023
• TODAY is First Notice Day for Feb Cattle.
• Wed Feb 8th is Last Trading Day for Mar Sugar 16.
• Friday Feb 10th is Last Trading Day for Feb Gas Oil.
Read Full Story »»»
DiscoverGold
The Corn & Ethanol Report
By: Daniel Flynn | February 6, 2023
We kickoff the week with Export Intentions at 10:00 A.M., 3-Month & 6-Month Bill Auction at 10:30 A.M.
On the Corn Front we settled higher Friday in sideways volatile trading, like every other market. Corn traders monitoring expectations of Brazil’s 2nd crop. Unlike Argentina weather concerns, Brazil’s , weather forecasts look promising. With US Exports picking up as Brazil must concentrate on domestic use. There maybe harvest delays in Mato Gross so traders are looking ahead to how long the window be open for large US exports while harvesting in other areas are accelerating. BAGE reports Argentine corn conditions improved last week with 22% of the crop G/E up 10%. Reuters reports, US farmers are planning to boost corn acreage in 2023, eyeing lower prices for fertilizer needed to grow the crop and hoping for a bumper crop after a late season drought withered last years grain harvest and left US corn supplies near decade low. Plans for a upcoming season were made even as doubts mounted about demand and price gains for soybeans outstripped corn late las year. But early acreage forecast’s and interviews with farmers show their faith in the biggest US crop has not waned. In the overnight electronic session the March corn is currently trading at 677 ¼ which is a ¼ of a cent lower. The trading range has been 678 ¼ to 673.
On the Ethanol Front the government of Brazil announced it has reinstated its tariff on fuel ethanol imports. The import tax will be set at 16% through the end of 2023, increasing to 18% next year. Sounds like another power-grab. There was no activity in ethanol futures.
Read Full Story »»»
DiscoverGold
For Pete’s Sake. The Energy Report
By: Phil Flynn | February 6, 2023
Oil prices can’t decide whether they should fear a recession or the Fed trying to create one because last week’s jobs numbers were incredibly strong. If you think that is a dilemma, just think of the dilemma United States Secretary of Transportation Pete Buttigieg must deal with. Remember when Americans were struggling with near record-breaking gasoline prices, Mr. Buttigieg said families that buy electric vehicles (EVs) will “never have to worry about gas prices again.” And while that may be true. They may have even bigger worries as now there are many cases where it is more expensive to charge your electric car than it would be to fill it with gas.
Kelly Bluebook says that if you drive about 1,058 miles per month (Americans drive an average of about 12,700 miles annually). For an EV, you will use about 353 kWh in that timeframe. Using the U.S. household average from October 2022 of about 16 cents per kWh, it would cost about $56 per month to charge an electric car at home. According to AAA, the average price of gas hovers at $3.42 per gallon as of this writing. So, filling up a 12-gallon gas tank currently costs about $41. Things get a little tricky because, as we all know, cars and trucks use vastly different amounts of fuel.
The problem with Mr. Buttigieg’s promise is that as more cars draw electricity from the grid the cost of electricity will rise. To help the grid they now must add batteries to handle the load. This means that electric cars will not save you money over gasoline over time and in the not-too-distant future. And that is even before the government bans natural gas stoves.
Two massive earthquakes that hit Turkey and northern Syria have disrupted oil exports from the region early reports show that more than 1400 people were killed and many more are stuck in the rubble. let’s take time to say a prayer for all. The Iraqi Kurdistan suspends oil exports via Turkey.
Oil prices are caught up in macro forces and refinery maintenance. and while there are some concerns about demand in Saudi Arabia there seem to be signs of hope. Saudi Arabia decided to raise the prices of their crude oil in Asia. Another sign that China’s reopening is going strong.
Oils’ big sell-off near key support should hold. Weekly crude builds have slowed down the market momentum but its refineries start to regain momentum supplies will start to tighten. what looks like a short-term glut will look a lot different in a few months when we start to see major inventory draws in the coming months. Use the weakness to put on bullish strategies and get hedged ahead of the summer.
Can Freeport save the Natural Gas market? EBW Analytics says that the NYMEX front-month contract traded as low as $2.341/MMBtu intraday Friday—down 50¢ week-over-week—as the February forecast shed another 52 gHDDs and 80 Bcf of demand. Exceedingly mild weather may swell storage surpluses through the end of the month.
A third consecutive larger-than-expected EIA draw, growing indications of Freeport’s return, and major technical support offer glimmers of hope that a reversal higher is possible. If February continues to drop gHDDs, though, it may prove difficult for natural gas to bottom.
Read Full Story »»»
DiscoverGold
What I'm Watching This Week In The Grain Markets
By: Barchart | February 5, 2023
It’s time to change it up a little bit when it comes to talking about what I’m watching in the week ahead. We’ve reached the time of year where the major fundamental stories are set. We know a great amount of price direction will rely on Chinese demand potential with supply, of course, being another great contributing factor.
The only thing that answers the looming questions that we have now over supply and demand is what actually happens in the physical space.
I always say physical grain doesn’t move; it oozes. This means nothing ever gets from where it is to where it is needed as quickly as the market would like it to, but it does get there eventually.
My place in the ag space is a bit unique, as I actively trade cash grain for my customers throughout the day. My background in the elevator space has given me insight into how cash grain trade and movement take place, helping me get a feel for what may be coming next in a market well ahead of the move itself just by watching what is transpiring in cash markets.
While the main focus when it comes to watching the market is what futures are doing, the actual value paid for a bushel or a ton of grain is influenced by basis and spreads far more than futures values.
Basis is the difference between the futures value traded and the cash price paid for the grain in question. It is a function of local supply and demand. Basis takes into consideration what the futures market says a product is worth, and adds or subtracts value depending on how grain is flowing and what its needs may be in relation to that flow.
Strength in basis is indicative of limited grain flow versus demand. Grain flow can be influenced by a whole host of factors. Recently, freight has been a big contributing factor in the flow of grain, as competition for rail space and poor performance has limited the amount of grain able to move across the country via train. In addition, near record low river levels last fall limited grain movement while increasing cost, impacting basis as well.
Watching freight values is important as a cash trader as it gives potential insight not only into cost structures impacting local basis, as freight is a contributing factor in values paid, it can also give insight into whether or not grain is going to start moving in a certain direction or at an increased amount.
According to traders dealing with the freight market, it seems as though much of the disruption to supply chains has worked its way through the system and we are returning to normal when it comes to demand for goods in our logistics space. Some of the reported poor performance from the railroad has been attributed to increased demand, with the backlog of ships and containers at West coast ports well publicized a year ago.
Now that we have seen that backlog clear up, rail performance has reportedly improved greatly over the last month or two, with expectations of continued improvements, barring short-term weather disruptions.
Barge freight values have fallen more in line with normal from record highs seen last fall. Drafts are limited, with winter weather impacting some grain movement, but things appear to be getting back to normal there from a logistical flow standpoint, nonetheless.
The Baltic Dry Freight Index doesn’t appear to be showing signs of increased commodity demand, with it falling to a 32 month low this week. Values have now fallen back to the low level of the range traded from about 2018 to late 2020 when China started to buy up much of the world’s commodity supply. I’ll be watching ocean freight closely as it would be something bought either in conjunction with or ahead of a big volume of commodity business.
In addition to the ability to move grain, the ability to hold grain influences basis as well. We will likely begin to see some very interesting things happen in the Brazilian cash market as harvest begins to ramp up across the country.
According to Brazilian market analysts Agrinvest, Mato Grosso has around 22 mmt of static storage space in the state. This pales in comparison to the expected 43 mmt of soybeans expected to be harvested in the weeks ahead, as well as an anticipated 43-44 mmt of corn production. With over a million metric ton of soybeans and around 4 mmt of corn left over from last year, storage space is going to come at a premium this year.
This is a situation that is likely to play out across much of the country.
When space comes at a premium basis starts to get sloppy, or really weak as an elevator or commercial enterprise does not want to buy one bushel more than it can hold or resell. Owning bushels you cannot hold or resell is a problem not easily resolved. In this instance grain will be flowing at far too great of a pace versus demand in the market and will likely result in substantially weaker basis values in the weeks ahead.
A pocket of weak basis values in an otherwise strong market can make for interesting moves, especially with better freight performance, as the movement of grain from where it is (weak basis) to where it is needed (strong basis) can be expedited.
Grain flow impacting cash values could be seen this week in both GASC tenders. GASC or Egypt’s grain buying arm was in the market this week for several products, but the results of the corn and wheat tenders caught my attention as I feel they gave great insight into how different the world is now when it comes to perceived grain supply than what it was just 2 years ago.
On the corn side, what I found most interesting was the presence of COFCO in the offers. COFCO is one of China’s state-owned grain traders, and though they have a port in Constanta and like to keep the appearance of being international traders, they haven’t necessarily been seen as a possible supplier in a major tender in quite some time, especially being so competitive in price. Seeing COFCO as a willing corn seller gives me pause when it comes to anticipating impending demand. Yes, arbitrage is a normal part of cash grain, but not something you typically take part in if you feel you don’t have enough available supply to meet your current needs.
Second thing I noticed was the sharp uptick in participation in the wheat tender. While many of the offers were of Russian origin there were over 20 offers from at least 13 suppliers. In late 2021 there were instances when 5 offers were hard to come by, with prices substantially higher. The depth of offers in tenders going forward as well as the cash price paid will continue to give great insight into not only global demand, but the attitude and comfort level of global grain supplies and buyers.
Looking ahead, I will be watching the cash markets around the world closely. Grain flow, freight values and tender results will start to put the pieces of the global grain supply and demand puzzle together, it will begin to answer the questions we have about the level of risk premium needed as we work into the new crop production season.
Read Full Story »»»
DiscoverGold
Deliveries on Cattle/Sugar/Gas Oil
By: The PRICE Futures Group | February 3, 2023
• Mon Feb 6th is First Notice Day for Feb Cattle.
• Wed Feb 8th is Last Trading Day for Mar Sugar 16.
• Fri Feb 10th is Last Trading Day for Feb Gas Oil.
Read Full Story »»»
DiscoverGold
Today's Futures Heat Map • Strongest: Orange Juice, U.S. Dollar Index, Soybean Meal, Lumber
By: Barchart | February 3, 2023
• Today's Futures Heat Map
Strongest: Orange Juice, U.S. Dollar Index, Soybean Meal, Lumber
Weakest: Silver, Platinum, Gasoline, Heating Oil

Read Full Story »»»
DiscoverGold
Wheat Prices Fading On Friday
By: Barchart | February 3, 2023
The midday wheat market is working in the red so far but prices are off their lows. CBT SRW futures are down 4 to 5 cents at midday. KC prices are working 7 cents in the red so far. Spring wheat futures are trading with midday losses of 4 3/4 to 6 1/2 cents.
Russia’s IKAR reduced their outlook from 87 MMT to 84 MMT for the 2023 wheat crop citing a cold and dry winter.
The weekly Export Sales report showed 136k MT of wheat sales for the week that ended 1/26. That was below estimates, and was a 3-week low. New crop bookings were 32,460 MT for the week for a total forward book of 290,977 MT.
Traders estimate StatsCan will report wheat stocks at 22.3 MMT as of Dec 31. The lowest estimate is for 21.2 MMT, and the highest estimate is for 23.2 MMT, compared to last year’s 16.798 wheat stock.
Read Full Story »»»
DiscoverGold
Coffee Prices Slip On Weak Coffee Demand In China
By: Barchart | February 3, 2023
March arabica coffee (KCH23) this morning is down -5.65 (-3.18%), and Mar ICE robusta coffee (RMH23) is down -20 (-0.98%).
Coffee prices this morning are sharply lower. Concerns about weak coffee demand in China sparked long liquidation in coffee futures today after Starbucks reported a 29% drop in China sales in the first quarter as a spike in Covid infections led to mobility restrictions and store closures.
On Wednesday, arabica posted a 3-month high, and robusta on Tuesday posted a 3-1/2 month high on concerns about smaller global coffee supplies. Rabobank cut its global 2023/24 coffee surplus estimate to +1.6 min bags from a November estimate of +4.0 mln bags. Also, Volcafe said because of weak flower blossoms on coffee trees in the Minas Gerais coffee-growing region, it cut its Brazil 2023/24 arabica coffee production estimate to 40.5 mln bags from a July forecast of 49.8 mln bags.
A bullish factor for robusta coffee is the tightness in global supplies. Vietnam's General Statistics Office reported Monday that Vietnam Jan coffee exports sank -30.9% y/y to 160,000 MT. Also, robusta coffee inventories are shrinking as ICE-monitored robusta coffee inventories today fell to 6,039 lots, the fewest since contract rules changed in 2016.
Smaller global coffee supplies are bullish for prices after the International Coffee Organization (ICO) reported Thursday that Oct-Dec global coffee exports have fallen -2.8% y/y to 30.27 mln bags. Also, Cecafe on January 16 reported that Brazil's 2022 green coffee exports fell -2.7% y/y to 35.6 mln bags, the lowest in 4 years.
Robusta has support after coffee trader Volcafe forecasted that the global 2023/24 robusta coffee market would see a record deficit of 5.6 mln bags as Indonesia, the world's third-largest robusta producer is expected to see its 2023/24 robusta coffee production fall to 9.1 mln bags, the smallest robusta crop in 10 years due to damage from excessive rainfall across its growing regions.
An easing of dry conditions in Brazil may boost coffee yields and is bearish for prices. Somar Meteorologia reported Monday that Brazil's Minas Gerais region received 72.9 mm of rain last week, or 141% of the historical average. Minas Gerais accounts for about 30% of Brazil's arabica crop.
On the bearish side, ICE arabica coffee inventories have risen steadily since falling to a 23-year low of 382,695 bags on November 3 and posted a 7-month high of 872,853 bags Thursday. Also, Conab on January 19 forecasted the 2022/23 Brazil arabica crop would rise +14.4% to 37.4 mln bags.
Increased coffee exports from Vietnam, the largest robusta producer, are bearish for robusta prices after the General Statistics Office of Vietnam reported Tuesday that Vietnam's 2022 coffee exports were estimated at 1.78 MMT, up +14.1% y/y.
On the bullish side for coffee prices was the January 4 report from the Colombia Coffee Growers Federation that showed Colombia's 2022 coffee exports fell -8% y/y to 11.1 mln bags. Colombia is the world's second-biggest producer of arabica coffee beans.
On the negative side, U.S. green coffee inventories are plentiful after the Green Coffee Association on January 17 reported that U.S. Dec green coffee inventories rose +9.3% y/y to 6.38 mln bags.
The USDA, in its bi-annual report released on December 23, cut its global 2022/23 coffee production estimate by -1.3% to 172.8 mln bags from a June estimate of 175.0 mln bags. In addition, the USDA cut its 2022/23 global coffee ending stocks estimate by -1.7% to 34.1 mln bags from a June estimate of 34.7 mln bags.
In a bullish factor, the USDA's Foreign Agriculture Service (FAS) on November 22 cut its Brazil 2022/23 coffee production forecast by -2.6% to 62.6 mln bags from a prior estimate of 64.3 mln bags. This year was supposed to be the higher-yielding year of Brazil's biennial coffee crop, but coffee output this year was slashed by drought.
Read Full Story »»»
DiscoverGold
Unemployment Day. The Corn & Ethanol Report
By: Daniel Flynn | February 3, 2023
We have the Unemployment number that rears its ugly head in this economy that has already reared its ugly head. Will the tech layoffs could show up in this number. As we move into the new election cycle it should be a reminder there are consequences for not voting or continuing to pick the wrong horse. Remember to vote.
We kickoff the day with Employment Rate, Nonfarm Payrolls, Participation Rate, Average Hourly Earnings MoM & YoY, Average Weekly Hours, Government Payrolls, Manufacturing Payrolls, and Nonfarm Payrolls Private at 7:30 A.M., S&P Global Composite PMI Final and S&P Global Services PMI Final at 8:45 A.M., ISM Non-Manufacturing PMI, ISM Non-Manufacturing Employment, ISM Non-Manufacturing New Orders, ISM Non-Manufacturing Prices, and ISM Non-Manufacturing Business Activity at 9:00 A.M., Baker Hughes Oil & Total Rig Count at 2:00 P.M.
On the Corn Front the Employment number showed we added 517,000+ jobs and that leaves the question of other moves the FED may make other moves increasing already wild volatility. We have finally had a strong Export Sales report, including new sales to China. Wednesday nights strength in the markets were attributed to a weaker US dollar and Brazil concentrating on domestic consumption backing of corn exports until their second corn crop harvest. In other news Biden officials pressed on Mexico Trade Issue at a Farm Bill Hearing. Senator Chuck Grassley (R-Iowa) said, “when it comes to agriculture trade, the concern I hear from Iowans is access to Mexico’s corn market, Grassley continued, “with 90% of the corn acreage in the United States being planted to biotech seeds and Mexico being the number one purchaser of US corn, I’m concerned that this decree is not being met with the urgency that it deserves,” he said, referring to Mexican President Andres Manual Lopez Obradors decree that would phase out imports of GMO corn in 2024-extended to 2025 under a compromise Lopez Obrador’s administration recently offered, but which the US rejected. In the overnight electronic session the March corn is currently trading at 672 ¾ which is 2 ½ cents lower. The trading range has been 674 ¾ to 671 ½.
On the Ethanol Front the USDA expects no actions under the Feedstock Flexibility Program. The USDA’s Commodity Credit Corp. announced on Jan. 27 that it does not expect to purchase and sell sugar under the Feedstock Flexibility Program for crop year 2022, which runs through Oct. 1< 2022 through Sept 30, 2023. The CCC is required to announce quarterly estimates of sugar to be purchased for the FFP based on crop and consumption forecasts. Under Federal law, processors of sugar beets and domestically grown sugarcane can obtain USDA loans when the harvest begins. Still zero open interest in ethanol futures.
Read Full Story »»»
DiscoverGold
Oil Hokey Pokey. The Energy Report
By: Phil Flynn | February 3, 2023
You put the oil in, you take the oil out, you put the oil in, and you shake it all around. You do the hokey pokey and you turn yourself around. That’s what it is all about. When it comes to the US Strategic Petroleum Reserve, the Biden administration does not know whether it’s coming or going. As its historic 180 million barrel drain has come to an end, the administration is boasting that it would be buying oil back for the reserve at a big profit of around $70 a barrel. Yet while there was some noise that might happen, the Biden administration failed to close the deal. Yet at the same time, previously agreed SPR sales to reduce the US budget deficit are still scheduled to take place, further drawing down our depleted reserve.
Yesterday it was reported that the Energy Department is asking congress to halt the sale of 26 million more barrels of oil from the nation’s emergency supply of oil mandated for this fiscal year as it seeks to refill the strategic petroleum reserve. Yet that seems to be interesting because the Biden administration is also saying that they are not ruling out more SPR sales when the market starts surging once again as we head to the summer driving season. So let me get this straight. You don’t want to sell and you want to buy, but you might have to sell. Yup sounds just like a typical Biden administration policy.
In the meantime, US refiners helped keep US gas and diesel supplies flowing, using record-breaking refining utilization, signaling that they may have to cut back. OIL Price and Reuters are reporting that following record utilization last year, U.S. refiners expect to have lower capacity operating in the first quarter of this year, due to a heavy maintenance season. After operating at over 90% for most of 2022, the largest U.S. refiners now see their first-quarter utilization below 90%, and analysts expect refinery capacity utilization to be between 85% and 89% at the beginning of 2023, Reuters notes. The planned maintenance in the first quarter will affect the highest level of refining capacity in five years, analysts told Reuters. What this means is that this should set the stage for another spike in gasoline and diesel prices this summer.
US refinery runs have been low due to refining issues helping with recent crude oil supply increases. Reuters is reporting that the Pemex (PEMX.UL) is nearing a full restart on Thursday of its 312,500-barrel-per-day (bpd) Deer Park, Texas, refinery following an unplanned shutdown because of severe storms on Jan. 24, said people familiar with plant operations.
The market this week had a hard time shaking off weekly supply data that showed increases. The builds that we’ve seen in recent weeks reflect a sharp drop in demand. I think the thoughts that demand in the US have plummeted are misguided though. We did see some weakness in the US manufacturing sector that could account for some demand weakness. What we have to remember is when you’re talking about the demand for oil here in the United states, it is, relatively speaking, very strong. The Department of Energy continues to under represent demand on a weekly basis. Last week we saw the demand for gasoline go up, demand for diesel go down and we saw the demand for jet fuel going up.
There’s going to be some real concerns about jet fuel supplies going into summer. Supplies of jet fuel are below average and we’re already seeing spot shortages at many airports. This is part and parcel of the refining shortage. In the push toward green energy, nobody wants to be associated with diesel fuel and that is helping to create this global shortage. Venezuela is stepping up trying to fill the void, selling their heavy oil which is very good for making diesel fuel but at the same time, it plays into the geopolitical risk factors.
Today’s jobs report probably could push oil back into the positive if it comes out weaker than expected because demand is weak due to recent warm weather. The market is able to fret about every headline that comes across the board. We have seen a lot of choppy volatility and we expect that to continue but our base case is that we’re going to be facing a very tight market this year. We think the China reopening is going to leave the market under supplied. Unless we see a major drop off in economic activity around the globe, we still expect to see oil prices back above $100.00 this summer.
Read Full Story »»»
DiscoverGold
Today's Futures Heat Map • Strongest: Nasdaq 100 E-Mini, Orange Juice, Platinum, Natural Gas
By: Barchart | February 2, 2023
• Today's Futures Heat Map
Strongest: Nasdaq 100 E-Mini, Orange Juice, Platinum, Natural Gas
Weakest: Heating Oil, British Pound, Gold, Corn

Read Full Story »»»
DiscoverGold
Grains Report: Wheat, Rice, Corn and Oats, Soybeans
By: Jack Scoville | February 2, 2023
• WHEAT
General Comments: Wheat markets were mixed to higher yesterday and trends are sideways in all three markets on the daily and weekly charts. Futures were initially lower as traders anticipated the FED interest rate announcement. The FED raised interest rates by 0.25% as expected by the trade and indicated that more interest rate increases were coming in the next few months. The rally back came on follow through buying tied to news that the US and Germany were about to supply tanks to Ukraine, allowing the war to get hotter while the Wheat develops and the Corn maybe gets planted in Ukraine. Russia has a large production and is undercutting most world prices in the international market. Big Russian production goes against the difficulty of moving grain from the Black Sea due to insurance requirements, but so far the lack of insurance has not increased demand for US Wheat as the Russian Wheat is still moving. The demand for US Wheat in international markets has been a disappointment all year and has been hindered by low prices and aggressive offers from Russia. Ukraine is also looking for new business for its crops and Russia is aggressive in the world market as it looks for cash to fund the war.
Overnight News: The southern Great Plains should get scattered showers in the southern areas. Temperatures should average near to below normal. Northern areas should see mostly dry conditions. Temperatures will average near to below normal. The Canadian Prairies should see isolated snow showers. Temperatures should average below normal.
Chart Analysis: Trends in Chicago are mixed, Support is at 742, 729, and 721 March, with resistance at 766, 772, and 784 March. Trends in Kansas City are mixed to up with objectives of 895 and 910 March. Support is at 866, 859, and 850 March, with resistance at 895, 901, and 915 March. Trends in Minneapolis are mixed. Support is at 912, 907, and 897 March, and resistance is at 928, 935, and 942 March.
• RICE:
General Comments: Rice was a little higher yesterday as the speculative selling seen in the last few days dried up. The short term trends remain down in this market. Demand has been a problem for bullish traders. There is not much going on in the domestic market right now although mills are milling for the domestic market in Arkansas and are bidding for some Rice and although some Rice moved in Texas at what were called very good prices. Demand in general has been slow to moderate for Rice for exports and solid for domestic uses.
Overnight News: The Delta should get isolated showers. Temperatures should be below normal.
Chart Analysis: Trends are down with objectives of 1776 March. Support is at 1776, 1760, and 1750 March and resistance is at 1801, 1825, and 1836 March.
• CORN AND OATS
General Comments: Corn was a little higher and Oats a little lower yesterday. Corn was lower in early trading as the market factore in a 0.25% increase in interest rates by the FED. The FED made the move but prices were already moving back to higher again and negated a potential down move for the traders.. Both markets remain in up trends established in early December although the short term trend inboth is now sideways. The export demand was solid last week even though demand remains well behind the pace to make USDA objectives. Brazil has been hanging on for its Summer crop although losses are now being reported. Argentina has suffered through some extreme drought and losses could be large. The Brazil Winter crop is harvested and China is buying the surplus. The Summer crop and the Argentine crop is developing under stressful conditions. The next Winter crop is going into the ground in good conditions, but it has been wet so the Soybeans harvest has been delayed and the Corn planting is becoming delayed as well. Weak demand overall for US Corn remains a big problem for the market. There are increasing concerns about demand with the Chinese economic problems caused by the lockdowns creating the possibility of less demand as South America has much better crops this year to compete with the US for sales. China is now moving rapidly to open the economy and allow people to move around with no lockdowns so the demand could start to improve. The improvement might take some time as the Chinese people get Covid, but they should be past this episode in a few weeks and demand might start to improve at that time.
Overnight News:
Chart Analysis: Trends in Corn are mixed. Support is at 673, 669, and 666 March, and resistance is at 689, 693, and 698 March. Trends in Oats are mixed. Support is at 385, 377, and 372 March, and resistance is at 399, 405, and 411 March.
• SOYBEANS
General Comments: Soybeans and Soybean Oil were lower yesterday on weakness in petroleum futures and on some showers reported in Argentina overnight. Soybean Meal was higher as the weather remains problematic in South America. The FED increased interest rates by 0.25% yesterday as expected by the trade. Some selling ahead of the interest rate announcement was seen in the market. The pattern in southern Brazil and Argentina is shifting back to dry again. Price trends are turning up for Soybeans and Soybean Meal as the harvest in Brazil starts to expand in central and northern areas. These areas have seen too much rain and the harvest has been slow. The weekly charts show that Soybeans are trying to hold an uptrend line established in October while Soybean Meal seems to be bouncing off or support areas established a few weeks ago. Soybean Oil is in a sideways trend. Production potential for the Brazil is called very strong even with potential problems and losses in the south. Even so, production of less than 150 million tons is possible now although most estimates remain near 153 million tons. Argentine production ideas continue to drop with the drought as planting is delayed and the crops already in the ground are stressed. Production estimates are now closer to 40 million tons than original projections near 50 million. Ideas that Chinese demand will improve, but this could take a few more weeks as a very large part of the population now has Covid. This has delayed a robust economic return for the country.
Overnight News:
Chart Analysis: Trends in Soybeans are mixed. Support is at 1503, 1487, and 1478 March, and resistance is at 1528, 1537, and 1544 March. Trends in Soybean Meal are mixed to up with objectives of 505.00 and 515.00 March. Support is at 479.00, 472.00, and 468.00 March, and resistance is at 490.00, 496.00, and 502.00 March. Trends in Soybean Oil are mixed. Support is at 5990, 5940, and 5850 March, with resistance at 6240, 6360, and 6470 March.
Read Full Story »»»
DiscoverGold
Softs Report: Cotton, OJ, Coffee, Sugar, Cocoa
By: Jack Scoville | February 2, 2023
• COTTON
General Comments: Cotton was lower and still remains inside the trading range created since the beginning of November. The selling came from speculators and seemed to be in anticipation of the FED announcement yesterday. The FED raised interest rates by 0.25% as expected and said that more rate increases are possible or likely in the next few months. Futures are still showing bad demand fundamentals that have kept prices from rallying through resistance areas. Overall, the demand for US Cotton has not been strong although better demand has developed over the last couple of weeks. Some ideas that demand could soon increase as China could start to open its economy in the next couple of months as Covid outbreaks should start to weaken as people get vaccinated or immune. Covid is now widespread in China so the beneficial economic effects of the opening are being delayed but these effects should start to be felt as the people there achieve immunity over the next few weeks.
Overnight News: The Delta will get isolated to scattered showers and near to below normal temperatures. The Southeast will see isolated to scattered showers and above normal temperatures. Texas will have isolated showers and below normal temperatures. The USDA average price is now 83.43 ct/lb. ICE said that certified stocks are now 8,900 bales, from 8,900 bales yesterday. USDA said that weekly net Upland Cotton export sales were 171,300 bales this year and 20,200 bales next year. Net Pima sales were -800 bales this year and 2,400 bales next year.
Chart Trends: Trends in Cotton are mixed. Support is at 84.50, 83.20, and 82.00 March, with resistance of 87.50, 88.90 and 89.90 March.
• FCOJ
General Comments: FCOJ was higher again on follow through buying from industry and speculators. Chart trends are up again on the daily charts, but the rally has now run for three days and some profit taking might be seen today. Demand should start to improve with the holidays now over and cold air being reported over much of the country. Historically low estimates of production due in part to the hurricanes and in part to the greening disease has hurt production remain in place. The weather remains generally good for production around the world for the next crop but not for production areas in Florida that have been impacted in a big way by the two storms. Brazil has some rain and conditions are rated good. Mostly dry conditions are in the forecast for the coming days. The FCOJ Movement an Pack report showed that inventories are now 38.6% less than the same time last year.
Overnight News: Florida should get mostly dry conditions. Temperatures will average above normal. Brazil should get scattered showers and near normal temperatures.
Chart Trends: Trends in FCOJ are up with objectives of 220.00 March. Support is at 214.00, 208.00, and 207.00 March, with resistance at 220.00, 223.00, and 226.00 March.
• COFFEE
General Comments: New York and London closed lower yesterday as traders waited for the FED interest rate announcement that came out after the close. The FED raised interest rates by 0.25% and suggested that more rate hies were coming in the next few months even with inflation on the wane. The charts show that New York has completed a bottom that could be significant to medium range pricing. The trade must agree as funds were huge buyers during the session. London weekly charts show a market that has been working a little higher almost every week since November. Ideas of big production for Brazil continue due primarily to rains falling in Coffee production areas now and as offers stayed strong from Brazil and increasingly from Vietnam. There are ideas that production potential for Brazil had been overrated and reports of too much rain in Vietnam affected the harvest progress. The weather in Brazil is currently very good for production potential but worse conditions seen earlier in the growing cycle hurt the overall production prospects as did bad weather last year. Vietnam exported 160,000tons of Coffee in January, down 30.9% from last year.
Overnight News: ICE certified stocks are higher today at 0.870 million bags. The ICO daily average price is now 171.43 ct/lb. Brazil will get isolated showers in northern areas with near normal temperatures. Central America will get scattered showers. Vietnam will see scattered showers.
Chart Trends: Trends in New York are up with objectives of 204.00 and 237.00 March. Support is at 175.00, 170.00, and 167.00 March, and resistance is at 184.00, 186.00 and 192.00 March. Trends in London are up with no objectives. Support is at 20\40, 2000, and 1950 March, and resistance is at 2110, 2120, and 2150 March.
• SUGAR
General Comments: New York and London closed lower yesterday as traders waited for the FED announcement. The FED raised interest rates by 0.25% as expected and said that more rate hikes were in the cards. chart patterns indicate that prices can move higher again over the course of this week. Good production prospects are seen for crops in central and northern areas of Brazil, but the south should turn dry again after some rains in the last week or so. The harvest has been delayed in Thailand. Australia and Central America harvests are also delayed but are more active now. Mills in Brazil are shutting down now with the majority of the harvest now complete and processed. Ideas are that India will produce about 34.3 million tons of Sugar this year, about 4% less than the previous outlook.
Overnight News: Brazil will get scattered showers. Temperatures should average near normal. India will get mostly dry conditions and near to above normal temperatures.
Chart Trends: Trends in New York are up with objectives of 2160 March. Support is at 2120, 2080, and 2050 March and resistance is at 2190, 2220, and 2250 March. Trends in London are mixed. Support is at 562.00, 559.00, and 552.00 March and resistance is at 569.00, 571.00, and 579.00 March.
• COCOA
General Comments: New York and London closed a little higher yesterday with traders in this market not interested in the FED interest rate decision. Both markets show that futures are in mostly a range trade and the markets held that range again yesterday. Weaker demand shown by the grind data that got released recently. Talk is that hot and dry conditions reported in Ivory Coast could curtail mid crop production, but main crop production ideas are strong. Ghana has reported a disease in its Cocoa to hurt production potential there. The rest of West Africa appears to be in good condition. The North American grind was 8.1% lower and the EU and Asian grinds were about 2% lower. Good production is reported for the main crop and traders are worried about the world economy moving forward and how that could affect demand. Supplies of Cocoa are large at ports. The weather is good in Southeast Asia. Ivory Coast port arrivals now total 1.50 million tons for the current marketing year, up 5.7% from last year.
Overnight News: Mostly dry conditions are forecast for West Africa. Temperatures will be near normal. Malaysia and Indonesia should see scattered showers. Temperatures should average near normal. Brazil will get scattered showers and near normal temperatures. ICE certified stocks are lower today at 4.942 million bags.
Chart Trends: Trends in New York are mixed. Support is at 2570, 2540, and 2510 March, with resistance at 2650, 2670, and 2700 March. Trends in London are mixed. Support is at 2020, 1990, and 1950 March, with resistance at 2050, 2080, and 2090 March.
Read Full Story »»»
DiscoverGold
The Corn & Ethanol Report
By: Daniel Flynn | February 2, 2023
Yesterday Groundhog Day the movie was a day early yesterday as the Fed raised ¼ and announced to expect more hikes in the future. The Groundhog saw his shadow and we expect six more weeks of winter.
We kickoff today with Challenger Job Cuts at 6:00 A.M., Export Sales, Initial Jobless Claims, Labour Costs QoQ Prel, Nonfarm Productivity QoQ Prel, Jobless Claims 4-Week Average and Continuing Jobless Claims at 7:30 A.M., Factory Orders MoM and Factory Orders ex Transportation at 9:00 A.M., EIA Natural Gas Storage at 9:30 A.M., 4-Week & 8-Week Bill Auction at 10:30 A.M., and Total Vehicle Sales.
On the Corn Front US total December corn consumption falls 11% year-on-year. US total corn consumed for alcohol and other uses totaled 474 million bushels (12.04 million mt) in December 2022. The UA Air Force deemed a Chines corn mill in North Dakota a “significant threat to National Security.” Infeng Group and MSG a xanthan gum manufacturing company based in Shandong Province, China, previously bought 370 acres of farmland in Grand Forks through its American subsidiary. The city council approved the company’s $700 million proposal to build the mill last year, citing economic development success. However, thousands of residents have since expressed their disapproval of the mill. In August 2022, at least 5,000 residents signed a petition that sought to prevent the mills development. Mayor Brandon Bochenski issued a statement asserting that the proposed mill, “should be stopped.” In the overnight electronic session the March corn is currently trading at 682 which is 1 cent higher. The trading range has been 683 ½ to 679 ¾.
On the Ethanol Front production climbs higher as stocks fall. The EIA said production averaged 1.028 million barrels a day, up 16,000, and the fourth week in a row with a gain as two important indicators of demand showed improvement. The ethanol supply fell 635,000 barrels from the recent multi-month highs to 24.442 million barrels, which was 1.412 million below a year ago. The USDA’s next corn for ethanol consumption use is out February 8th. There were no trades in ethanol futures.
Traders and analysts are expecting draws on natural gas at 132 billion cubic feet.
Read Full Story »»»
DiscoverGold
The Message. The Energy Report
By: Phil Flynn | February 2, 2023
Fed Chairman Jerome Powell said the disinflation process has started and while that caused a lot of commodities and stocks to soar, oil did not get the message. Maybe it was because the Fed Chair stressed that the fight against inflation was far from over or more than likely it was because the Energy Information Administration (EIA) weekly data was surprisingly bearish with supply increases across the petroleum board. While the EIA data seems to be very volatile on a week-to-week basis and the fact that they just had to raise forecasts for underreported demand, the report was still a weight on prices that were based on other macro factors like the new weakness in the dollar that really should have rallied. Even the US manufacturing sector that fell into contraction did not help. The ISM purchasing manager index slipped to 47.4 in January from 48.4 and n December and 57.6 (85th percentile) a year earlier.
Yet before we get into the oil data, I think it is interesting to note that according to Reuters, Asia’s imports of crude oil reached a record high in January, but the strength wasn’t driven by China, with the world’s biggest buyer actually recording a decline. It was led by India. Reuters put Asia’s total imports at 29.13 million barrels per day (bpd), up 11.1% from December’s 26.22 million bpd and eclipsing the previous all-time high of 29.10 million bpd from November, according to data compiled by Refinitiv Oil Research. India, the region’s second-biggest importer, saw January arrivals hit a record high of 5.29 million bpd, up from December’s 4.78 million bpd. The data shows that Russia maintained its position as a top supplier, with January imports of 1.33 million bpd, up from 1.19 million bpd in December. Other major Asian oil buyers also saw gains in January, with South Korea importing 3.11 million bpd, up from 2.85 million bpd in December, while Singapore imported 1.65 million bpd, up from 910,000 bpd. Japan was the exception, with January imports dropping to 2.83 million bpd from December’s 2.96 million bpd.
We will have to consider what Chinese demand will be when they release themselves as the biggest importer. We agree with the projection that global oil demand will exceed all-time highs and we still believe that it will be hard to meet that demand which keeps us very bullish despite dissipating data. Oil needs to break out over $80.00 on a closing basis which I feel is going to happen at some point. Yet short term they have to look at US data that is short-term bearish.
Yet the ability to meet demand is key and one of the reasons that the world is ill-equipped to meet demand is that capital is being allocated to green energy projects that cost more money and yield much less energy. Even BP and the $569 billion dollars that is being shoveled into green energy from the Inflation Reduction Act may make some improvements in many facets of the green energy space but will not be able to make up from the energy production deficit that we are going to get as funds are getting diverted. And besides, a lot of the oil that Asia imported was from the US Strategic Petroleum Reserve.
Yesterday U.S. Senators Joe Manchin (D-WV), Chairman of the Senate Energy and Natural Resources Committee, Ted Cruz (R TX), Angus King (I-ME), Michael Bennet (D-CO), Maggie Hassan (D-NH), Dan Sullivan (R-AK), Mike Braun (R-IN), Tom Cotton (R-AR), Cindy Hyde-Smith (R-MS), Tommy Tuberville (R-AL), John Hoeven (R-ND), John Boozman (R-AR), Joni Ernst (R-IA), John Cornyn (R-TX), Jerry Moran (R-KS), Roger Marshall (R-KS), Rick Scott (R-FL), Mike Lee (R-UT), Kyrsten Sinema (I-AZ) and Mark Kelly (D-AZ) introduced the Protecting America’s Strategic Petroleum Reserve from China Act. The bipartisan legislation would prohibit the sale of American crude oil from the Strategic Petroleum Reserve (SPR) to any company under the control of the Chinese Communist Party and prohibit the export of any crude oil from the SPR to China. The U.S. House of Representatives recently passed similar legislation by an overwhelming, bipartisan vote of 331-97.
I think both democrats and republicans are really questioning Biden’s use of the strategic petroleum reserve as they should. The strategic reserve was not built for the purpose of trying to manipulate markets. Biden will scream that oil companies are making more money but fail to take any responsibility for their policies that has not encouraged investment in US fossil fuels.
The EIA showed crude oil and refined fuels fell dramatically today after crude stocks increased by 4.14 million barrels to a 19-month high just as you ignore the fact that the SPR is down 280 million barrels. U.S. crude oil stocks are now +3.5% above the seasonal 5-year average. Gasoline stocks increased by +2.58 million barrels vs expectations of +2.0 million barrel increase. U.S. gasoline stocks remain -6.8% below the seasonal 5-year average. Distillate stocks unexpectedly increased by +2.32 million barrels vs expectations of a -1.5 million barrel decrease. U.S. distillate stocks remain -17.1% below the 5-year seasonal average.
Natural gas is getting blasted on the forecast for a big warm-up after a cold blast. We’ll see the inventory report today. Look for a 145bcf draw.
Read Full Story »»»
DiscoverGold
Orange juice prices hit a record high, but don't worry the worst of inflation is surely behind us
By: Markets & Mayhem | February 1, 2023
• Orange juice prices hit a record high, but don't worry the worst of inflation is surely behind us.

Read Full Story »»»
DiscoverGold
Today's Futures Heat Map • Strongest: Orange Juice, T-Bonds, Equity Indices, Euro
By: Barchart | February 1, 2023
• Today's Futures Heat Map
Strongest: Orange Juice, T-Bonds, Equity Indices, Euro
Weakest: Natural Gas, Heating Oil, Gasoline, Coffee

Read Full Story »»»
DiscoverGold
Cocoa Prices Recover Early Losses On A Weak Dollar
By: Barchart | February 1, 2023
March ICE NY cocoa (CCH23) on Wednesday closed up +11 (+0.43%), and March ICE London cocoa #7 (CAH23) closed down -1 (-0.05%).
Cocoa prices Wednesday posted 1-week lows but recovered most of their losses and settled mixed as a weaker dollar (DXY00) sparked short covering in cocoa futures. Cocoa prices are under pressure as recent rain in West Africa should ease dry conditions caused by the seasonal Harmattan winds, improving the yield prospects of the Ivory Coast and Ghana cocoa crops.
Cocoa prices are also under pressure on ample supplies from the Ivory Coast. Monday's government data showed that Ivory Coast farmers sent a cumulative 1.57 MMT MT of cocoa to Ivory Coast ports for the 2022/23 marketing year from October 1 through January 29, up +7.5% y/y.
On the positive side for cocoa are smaller cocoa exports from Nigeria after the Cocoa Association of Nigeria reported last Tuesday that Nigeria's Dec cocoa exports fell -0.7% m/m and -73% y/y to 36,571 MT. Nigeria is the world's fifth-largest cocoa bean producer.
Cocoa prices have seen support from concern about the quality of some West African cocoa crops. Cocoa farmers continue to struggle with the lack of fertilizer and pesticides as the war in Ukraine has limited Russian exports of potash and other fertilizers worldwide.
Global cocoa demand is tepid and is a negative factor for prices. On January 19, the National Confectioners Association reported that Q4 North American cocoa grindings fell -8.1% y/y to 107,130 MT. Also, the European Cocoa Association reported on January 19 that European Q4 cocoa grindings fell -1.7% y/y to 359,577 MT. On January 18, the Cocoa Association of Asia reported that Asia Q4 cocoa grindings fell -0.2% y/y to 230,806 MT.
NY cocoa has underlying support from tighter cocoa supplies. ICE-monitored NY cocoa inventories held in U.S. ports have trended lower over the past four months and fell to a 9-1/4 month low on January 3. Also, ICE-monitored cocoa stockpiles held in EU ports remain at a 9-1/4 month low of 112,880 MT.
The quarterly report from the ICCO on December 1 was bullish for cocoa prices after ICCO said global 2021/22 cocoa production fell -8.0% y/y to 4.823 MMT as unfavorable weather and disease hampered cocoa yields. ICCO revised its 2021/22 global cocoa production figure downward by -419,000 MT from the September figure. The ICCO also raised the 2021/22 global cocoa deficit to -306,000 MT from a Sep forecast of -230,000 MT. In 2020/21, global cocoa production rose to a record 5.242 MMT, and the global cocoa market was in a surplus of +209,000 MT.
[url]https://www.barchart.com/story/news/13811100/cocoa-prices-recover-early-losses-on-a-weak-dollar[/tag] »»»
DiscoverGold
Sugar Prices Retreat As Crude Oil Tumbles
By: Barchart | February 1, 2023
March NY world sugar #11 (SBH23) on Wednesday closed down -0.39 (-1.79%), and March London white sugar #5 (SWH23) closed down -18.00 (-3.10%).
Sugar prices Wednesday initially extended their week-long rally, with NY sugar posting a 6-year high and London sugar posting a 4-1/2 month high. However, a plunge of more than -2% in crude oil prices (CLH23) Wednesday to a 3-week low sparked long liquidation in sugar futures, and prices closed sharply lower. Weakness in crude undercuts ethanol prices and may prompt Brazil's sugar mills to divert more cane crushing toward sugar production rate than ethanol, thus boosting sugar supplies.
Sugar has rallied sharply over the past week on reduced sugar output and smaller sugar exports from India. On Tuesday, the India Sugar Mills Association (ISMA) cut its 2022/23 India sugar production estimate to 34 MMT from an Oct estimate of 36.5 MMT and cut its India 2022/23 sugar export estimate to 6.1 MMT from an Oct forecast of 9 MMT. In addition, the ISMA said that it sees India's sugar mills diverting 4.5 MMT to 5.0 MMT of sugar to ethanol production in 2022/23.
Sugar prices also have support from last Tuesday when Brazil's state-owned oil company Petrobras raised gasoline prices by more than +7% to distributors. Strength in gasoline is supportive of ethanol prices, and higher ethanol prices may prompt Brazil's sugar mills to boost ethanol production at the expense of sugar.
Earlier this month, NY sugar posted a 2-1/2 month low on an improved sugar supply outlook. Unica on Jan 11 reported that Brazil's 2022/23 sugar production through December rose +4.4% y/y to 33.462 MMT. Brazil is the biggest sugar producer in the world.
In a bullish factor, StoneX Financial said Dec 14 that due to a delay in Thailand's sugar harvest, projections for Thai sugar exports of 1 MMT to 2 MMT this quarter "will not materialize."
Reduced sugar production in Europe is another supportive factor for prices, as that may force European sugar and food manufacturers to import sugar, leading to tighter global supplies. The European Association of Sugar Manufacturers on Dec 8 forecasted that EU 2022/23 sugar output would fall -7% y/y to 15.5 MMT.
Higher sugar output in India last season was bearish for prices. India's 2021/22 sugar production rose +2.9% y/y to 35.8 MMT. Also, robust sugar exports from India are bearish for prices after India 2021/22 sugar exports jumped +57% y/y to a record 11 MMT.
In a bearish factor, the International Sugar Organization (ISO) on Nov 22 projected that global 2022/23 sugar production would climb +5.5% y/y to a record high of 182.1 MMT. Also, ISO projected that the 2022/23 global sugar market would be in a surplus of +6.2 MMT.
Read Full Story »»»
DiscoverGold
Coffee Settles Sharply Lower On Increased Coffee Exports From Honduras
By: Barchart | February 1, 2023
March arabica coffee (KCH23) on Wednesday closed down -5.85 (-3.22%), and Mar ICE robusta coffee (RMH23) closed down -54 (-2.56%).
Coffee prices Wednesday gave up an early advance and settled sharply lower. Long liquidation emerged in coffee futures Wednesday after the Honduran Coffee Institute reported Honduran Jan coffee exports rose +13% y/y to 745,975 bags. Honduras is the biggest producer and exporter of coffee in Central America.
On Wednesday, arabica initially posted a 3-month high, and robusta on Tuesday posted a 3-1/2 month high on concerns about smaller global coffee supplies. Volcafe said because of weak flower blossoms on coffee trees in the Minas Gerais coffee-growing region, it cut its Brazil 2023/24 arabica coffee production estimate to 40.5 mln bags from a July forecast of 49.8 mln bags.
Wednesday's action by Rabobank to cut its global coffee surplus estimate was supportive of coffee prices. Rabobank cut its global 2023/24 coffee surplus estimate to +1.6 min bags from a November estimate of +4.0 mln bags.
A bullish factor for robusta coffee is the tightness in global supplies. Vietnam's General Statistics Office reported Monday that Vietnam Jan coffee exports sank -30.9% y/y to 160,000 MT. Also, robusta coffee inventories are shrinking as ICE-monitored robusta coffee inventories on Tuesday fell to 6,182 lots, the fewest since contract rules changed in 2016.
A bullish factor for coffee prices was the January 16 report from Cecafe that showed Brazil's 2022 green coffee exports fell -2.7% y/y to 35.6 mln bags, the lowest in 4 years.
Robusta also has support after coffee trader Volcafe forecasted that the global 2023/24 robusta coffee market would see a record deficit of 5.6 mln bags as Indonesia, the world's third-largest robusta producer is expected to see its 2023/24 robusta coffee production fall to 9.1 mln bags, the smallest robusta crop in 10 years due to damage from excessive rainfall across its growing regions.
An easing of dry conditions in Brazil may boost coffee yields and is bearish for prices. Somar Meteorologia reported Monday that Brazil's Minas Gerais region received 72.9 mm of rain last week, or 141% of the historical average. Minas Gerais accounts for about 30% of Brazil's arabica crop.
Abundant arabica coffee supplies are negative for prices. ICE arabica coffee inventories have risen steadily since falling to a 23-year low of 382,695 bags on November 3 and posted a 6-3/4 month high of 870,7224 bags last Thursday. Also, Conab on January 19 forecasted the 2022/23 Brazil arabica crop would rise +14.4% to 37.4 mln bags.
Increased coffee exports from Vietnam, the largest robusta producer, are bearish for robusta prices after the General Statistics Office of Vietnam reported Tuesday that Vietnam's 2022 coffee exports were estimated at 1.78 MMT, up +14.1% y/y.
On the bullish side for coffee prices was the January 4 report from the Colombia Coffee Growers Federation that showed Colombia's 2022 coffee exports fell -8% y/y to 11.1 mln bags. Colombia is the world's second-biggest producer of arabica coffee beans.
On the bearish side, U.S. green coffee inventories are plentiful after the Green Coffee Association on January 17 reported that U.S. Dec green coffee inventories rose +9.3% y/y to 6.38 mln bags.
The USDA, in its bi-annual report released on December 23, cut its global 2022/23 coffee production estimate by -1.3% to 172.8 mln bags from a June estimate of 175.0 mln bags. In addition, the USDA cut its 2022/23 global coffee ending stocks estimate by -1.7% to 34.1 mln bags from a June estimate of 34.7 mln bags.
The International Coffee Organization (ICO) reported on December 2 that global coffee exports in Oct fell -1.9% y/y to 9.87 mln bags.
In a bullish factor, the USDA's Foreign Agriculture Service (FAS) on November 22 cut its Brazil 2022/23 coffee production forecast by -2.6% to 62.6 mln bags from a prior estimate of 64.3 mln bags. This year was supposed to be the higher-yielding year of Brazil's biennial coffee crop, but coffee output this year was slashed by drought.
Read Full Story »»»
DiscoverGold
Milk Market
By: Barchart | February 1, 2023
Concerns for Milk Price Continues
Last week saw a glimmer of hope for milk prices down the line. The milking herd is starting to turn lower. One month doesn't necessarily mean a trend, but it is certainly a move in the right direction for higher prices. What is holding milk prices down right now is stronger global production teamed with lower global demand. There is plenty of milk available with spring flush quickly approaching. All dairy products have been moving lower with no indication this will correct itself soon.
Milk Strategies
Most producers have adequately protected Q1 and Q2 milk. Many of the policies are "in-the-money" and providing peace of mind. Some clients are now selling downside puts in Q2 that are near or higher than the premiums paid for DRP. Class IV DRP and option prices have come back in line to make the "buy DRP/sell put trade" appealing. Although there isn't an expectation of aggressive buying in the spot market that could provide some dairy products turning higher, selling calls is not advised at this point. The premium received for the sale of calls doesn't adequately compensate for the risk taken by capping milk price on the upside. For a more detailed approach to hedging milk for 2023 that fits your risk tolerance and profile, please reach out to me, mmerucci@bluelinefutures.com.
Corn
Dec corn came into the new year around 6.10, has since retreated back to 5.90 but has held this area well. There hasn't been any reason for higher implied volatility, but we will most likely be seeing it rise as we head toward South America harvest and North America planting months. Buying calls here protects price and and gives a long volatility component to your hedged position. If you are more inclined to off-set the cost of the hedge, a call spread will give you a range of coverage or a risk reversal could still give unencumbered upside, although adding a buying obligation at the strike price of a sold put.
Soybean Meal
It will be important to protect proteins as well in 2023. There is plenty of market uncertainty with feed, so having hedges in place could make a significant difference when it comes to the bottom line. Depending on your market bias, hedging experience and risk tolerance different hedges would be in order.
Q2 Class III Chart
Again, if interested in discussing which hedges are the best fit for your business, please reach out for further discussion and information on opening a hedge account as well adding DRP or LRP.
Read Full Story »»»
DiscoverGold
Lumber Prices Turn Higher
By: Barchart | February 1, 2023
On January 12, I published an article on Barchart, Lumber- An Ugly 2022 But Spring Is On The Horizon. In that piece, I wrote, “At below $425 on January 12, lumber could have upside room as illiquid markets can experience significant appreciation when they run dry of selling.” The article forecast that seasonality favored the upside, but prices over $1,000 per 1,000 board feet were unlikely on the nearby random-length lumber futures contract. The active month random-length lumber contract’s price closed at $373.70 on December 30, 2022. After falling to a $338 low in early January, the price turned higher and was around $520 on February 1, 2023.
Weyerhaeuser Company (WY), a unique company that is a real estate investment trust with lumber exposure, has appreciated from its December 30, 2022, closing price.
A rally in the random-length lumber futures
March random-length lumber futures closed 2022 at $382.70 per 1,000 board feet. After falling to $360.20 on January 6, wood’s price turned high.

The chart highlights lumber futures recovered and rallied 48.2% from the January 6 low to their most recent high of $533.70 on February 1. The lack of liquidity likely led to a significant rally as selling evaporated. However, lumber futures put in a substantial technical reversal on the longer-term chart.

The ten-year chart shows random-length lumber futures put in a bullish key reversal pattern on the monthly chart as the price fell below the December 2022 low and closed above the $436.40 December 2022 high on January 31, 2023. Lumber futures had not been above the $500 level since October 2022.
The new physical contract has posted gains in 2023
While the new smaller physical lumber contract only began trading in August 2022, they have followed a similar path to the random-length futures it will eventually replace.

The March physical contract price rose 33.3% from $469.00 per 1,000 board feet on January 6 to $627.00 on February 1.

The monthly chart shows the same bullish technical reversal as lumber fell below the December 2022 $472 low and closed above the $535 high in January.
Lumber can be a leading indicator for industrial commodities
Lumber is an industrial commodity that can be a leading indicator for other raw material markets. Low liquidity often causes selling to dry up on the downside or buying to evaporate on the upside before the same phenomenon occurs in other industrial commodities.
In early 2023, nearby copper futures, another critical industrial commodity, rallied.

The chart shows March copper futures, a leading base metal, have moved from $3.8105 on December 30, 2022, to above the $4.13 per pound level on February 1, 2023 after reaching $4.3550 on January 18. The bullish price action in copper validates the move in lumber futures.
Interest rates will influence the path of least resistance of wood prices as lumber is critical for new home building
Lumber is one of the most interest rate-sensitive commodities because of wood’s role in new home construction. Rising interest rates tend to weigh on lumber prices as the demand for new homes declines when mortgage rates increase.
In March 2022, the short-term Fed Funds Rate stood at a midpoint of 0.125%. At the end of 2022, the rate rose to 4.25% to 4.50%. Moreover, the Fed’s quantitative tightening program reduces the central bank’s swollen balance sheet by $95 billion monthly. Higher rates have dampened the demand for new homes and pushed real estate values lower from the 2022 highs. Since wood is a critical construction input, a weak housing market is bearish for lumber futures. The trajectory of rate hikes in 2023 will not likely approach the rise in 2022. Therefore, markets have digested higher rates.
Moreover, the most recent inflation data shows the economic condition is declining. While inflation is nowhere near the Fed’s 2% target, the potential for a recession could curb the central bank’s enthusiasm for increasing short-term rates. Lumber’s price action could tell us that rates will level off in 2023, and the demand for new homes will increase...
Read Full Story »»»
DiscoverGold
|
Followers
|
90
|
Posters
|
|
|
Posts (Today)
|
0
|
Posts (Total)
|
8960
|
|
Created
|
05/01/07
|
Type
|
Free
|
| Moderators DiscoverGold Pro-Life | |||
- The Commodity Bull is Running... Inflation is Running... Harder Living (i.e. FOOD, CLOTHING, SHELTER) is Dead Ahead... -
- Commodity Futures Trading -
http://finviz.com/futures_performance.ashx
All Commodity Futures Charts From Finbiz.com Available Below:
Daily
Weekly
Monthly
Quarterly
6 Months
12 Months
YTD
2 Years
5 Years
Max
Beneficial Educational Resources on Futures TradingThe futures market is volatile, and it cuts both ways. Leverage that makes it profitable can also ruin reckless, undisciplined traders overnight. Most brokers have paper trading available on their platforms, so those who are new to futures should take advantage and learn with these tools before going live with real money. Mitigate risk with stop loss orders at all times, and cut losses quickly instead of adding contracts and attempting to flip your way out of a losing position. Also, use mini instruments when available, with lower margin requirements, until you have sufficient capital to buy and sell more expensive contracts. Even though the potential is there, don't try to make too many profits at once. If things aren't going well, often times quitting for the day and collecting one's thoughts is the best decision. New opportunities come along daily. Markets are open nearly 24 hours, so set a schedule and stick to it. Avoid trading while tired or distracted, and please don't listen to the advice of others. Do research on fundamentals affecting markets as well as paying attention to TA. Watch key indices, and listen to accurate, real-time news during the session to stay aware of shifting trends. Trade smart, trade safely, and have fun.
Videos on Futureshttps://www.youtube.com/playlist?list=PL9A5C5A93D243CA44 Continuous Improvement in Progress |
Commodity Futures Trading
https://www.tdameritrade.com/investment-products/futures-trading.page
| Volume | |
| Day Range: | |
| Bid Price | |
| Ask Price | |
| Last Trade Time: |


