 News
News  Market Data
  Discover
Support: 888-992-3836
Copyright © 2023 InvestorsHub Inc.


Register for free to join our community of investors and share your ideas. You will also get access to streaming quotes, interactive charts, trades, portfolio, live options flow and more tools.
QIPT --> key support broken over past several weeks, and is now bouncing to re-test that level (now resistance)
---
LWLG breaks key support
Had formed descending triangle over past year.
---
In addition to RSI for the main stock indices, another indicator I'm using is the $VIX, since when its RSI approaches or reaches overbought (RSI of 70), this has consistently identified stock market bottoms (see below). The $VIX had an RSI reading over 70 yesterday, and is currently ~ 68, so this suggests that a near term bottom could be near.
I figure a lot will depend upon Israel's response to the Iranian bombing. Since the US has told Netanyahu pretty bluntly that the US will not support his retaliatory efforts, it seems doubtful that he'll do anything really big. Who knows, but I figure that after a few more days the financial markets will go back to concentrating more on corporate earnings. Anyway, I re-upped my stock allocation to 20%, so will go with that for now. I figure a conservative approach might be 12.5% as Core (LT buy/hold), and 7.5% as Flex, but still a 'work in progress'.
2022 - late Sept / early Oct
2023 - March
2023 - August
2023 - late Sept thru Oct
2024 - mid Feb
2024 - April
---
Chart-wise, the main stock indices are nearing oversold, based on the RSI (under 30 is oversold) -
DJIA ------ 31
S+P 500 - 39
Nasdaq -- 42
Russell --- 37
Wall Street is waiting to see Israel's response to the Iranian bombing, but if nothing happens soon then the near term bottom in stocks might be in (?)
---
High Tide (HITI) - nice break out on high volume :o)
>>> High Tide Inc. (HITI) engages in the cannabis retail business in Canada, the United States, and internationally. The company operates through Retail and Wholesale segments. It operates licensed retail cannabis stores; and provides data analytics services. In addition, the company manufactures and distributes consumption accessories. Further, it sells its products through online sales via e-commerce platform. The company offers its products under the Daily High Club, DankStop, FABCBD, GC, Nuleaf, Smoke Cartel, and Blessed CBD brands. The company was formerly known as High Tide Ventures Inc. and changed its name to High Tide Inc. in October 2018. High Tide Inc. was founded in 2009 and is headquartered in Calgary, Canada. <<<
---
>> silver <<
Silver also coming to life :o) Looking at the SLV chart, as with gold there is a quasi 12 year cup + handle (bullish), with the 3 year 'cup' having a quasi inverted head + shoulders (also bullish). It's much less classic than on the gold chart, but is easier to see now that silver is climbing. Also the 'neckline' on the silver chart is sloped, where gold's is flat and thus more 'classic'.
Anyway, looks like silver is playing catch up to gold. There is also a potential motivation for price suppression with silver, since it represents a key input cost for solar panels. Therefore keeping silver prices lower helps keep solar cost competitive with traditional types of energy. Not sure how much price suppression of silver has been going on in recent years, but like gold. it does seem to have peculiar 'smack downs' at times.
---
HITI -- quasi Inverted Head + Shoulders bottom -
>>> High Tide Inc. (HITI) engages in the cannabis retail business in Canada, the United States, and internationally. The company operates through Retail and Wholesale segments. It operates licensed retail cannabis stores; and provides data analytics services. In addition, the company manufactures and distributes consumption accessories. Further, it sells its products through online sales via e-commerce platform. The company offers its products under the Daily High Club, DankStop, FABCBD, GC, Nuleaf, Smoke Cartel, and Blessed CBD brands. The company was formerly known as High Tide Ventures Inc. and changed its name to High Tide Inc. in October 2018. High Tide Inc. was founded in 2009 and is headquartered in Calgary, Canada. <<<
---
IIPR --> Inverted Head + Shoulders -
>>> Innovative Industrial Properties, Inc. (IIPR) is a self-advised Maryland corporation focused on the acquisition, ownership and management of specialized properties leased to experienced, state-licensed operators for their regulated cannabis facilities. Innovative Industrial Properties, Inc. has elected to be taxed as a real estate investment trust, commencing with the year ended December 31, 2017. <<<
---
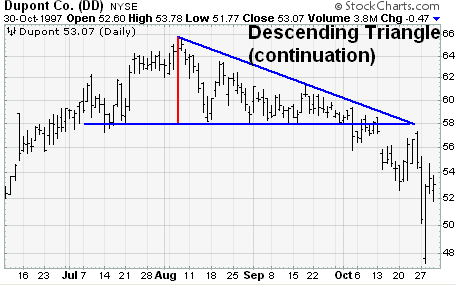
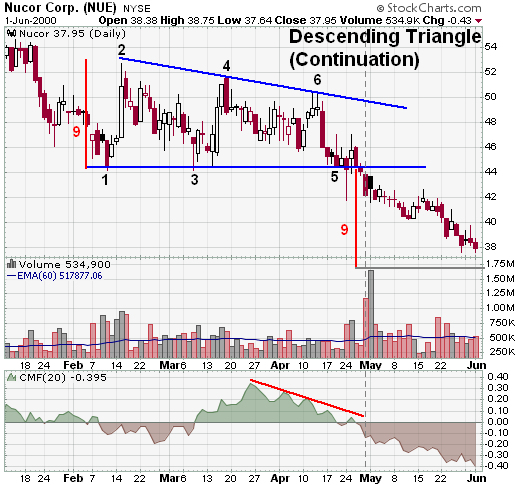
Xena, While the current LWLG chart pattern clearly looks bearish, if the company is actually turning the corner in their business, that could override the bearish chart. The fact that support at 4 has held so tenaciously for over a year is good, but the subsequent bounces have been petering out at lower and lower levels, thus forming the descending triangle, similar to those shown below.
I was aware of LWLG back in 2020-22, but haven't followed them closely. It sounds like their business model is to be the supplier of their proprietary EO polymer material to companies that will use it in their own products, and LWLG will collect royalties on the sale of the products containing the polymer. It's great they signed their first licensing deal, with more potential deals in the works (per the CEO's recent shareholder letter). Key questions include - the terms of the licensing deal, how much revenue can be expected from the deal, and the timing of the revenue flow. But I assume the terms haven't been disclosed by LWLG, but has the CEO given any guidance on expected revenue flows? In the shareholder letter he says they have numerous other deals in the works, so those could be the big wildcard. Another deal announcement could help the stock a lot, and make moot the current bearish chart. Thanks for any insights :o)
---
Actually it's a quadruple bottom for LWLG. Institutions entered at the highs and loaned their shares to the shorts and it's been monkey business ever since.
What they haven't accounted for in their algos is that private parties in the EU own more stock than the institutions and they aren't selling.
Commercialization and revenues are imminent... shorts are screwed because the can't cover.
Cup + Handle breakout for Gold, GLD (formed over the last 12 years)
Also an Inverse Head + Shoulders breakout for Gold / GLD (formed over last 4 years)
---
Descending triangle - >>> Lightwave Logic, Inc. (LWLG) focuses on the development of photonic devices and electro-optical polymer materials systems for fiber-optic data communications, telecommunications, and optical computing markets in the United States. The company is involved in the designing and synthesizing of organic chromophores for use in its electro-optic polymer systems and photonic device designs. It also offers electro-optic modulators, which converts data from electric signals to optical signals for transmission over fiber-optic cables; and polymer photonic integrated circuits, a photonic device, which integrates various photonic functions on a single chip. In addition, the company provides the ridge waveguide modulator, a modulator that fabricates the waveguide within a layer of its electro-optic polymer system. It focuses on selling its products to electro-optic device manufacturers, contract manufacturers, original equipment manufacturers, foundries, packaging and assembly manufacturers, etc.; and semiconductor companies, optical network companies, Web 2.0/3.0 media companies, computing companies, telecommunications companies, aerospace companies, automotive companies, and government agencies and defense entities. The company was formerly known as Third-order Nanotechnologies, Inc. and changed its name to Lightwave Logic, Inc. in March 2008. Lightwave Logic, Inc. was founded in 1991 and is headquartered in Englewood, Colorado. <<<
---
>>> The Hershey Company (HSY), together with its subsidiaries, engages in the manufacture and sale of confectionery products and pantry items in the United States and internationally. The company operates through three segments: North America Confectionery, North America Salty Snacks, and International. It offers chocolate and non-chocolate confectionery products; gum and mint refreshment products, including mints, chewing gums, and bubble gums; pantry items, such as baking ingredients, toppings, beverages, and sundae syrups; and snack items comprising spreads, bars, snack bites, mixes, popcorn, and pretzels. The company provides its products primarily under the Hershey's, Reese's, Kisses, Jolly Rancher, Almond Joy, Brookside, barkTHINS, Cadbury, Good & Plenty, Heath, Kit Kat, Payday, Rolo, Twizzlers, Whoppers, York, Ice Breakers, Breath Savers, Bubble Yum, Lily's, SkinnyPop, Pirates Booty, Paqui, Dot's Homestyle Pretzels, and ONE Bar brands, as well as under the Pelon Pelo Rico, IO-IO, and Sofit brands. It markets and sells its products to wholesale distributors, chain grocery stores, mass merchandisers, chain drug stores, vending companies, wholesale clubs, convenience stores, dollar stores, concessionaires, and department stores. The company was founded in 1894 and is headquartered in Hershey, Pennsylvania.
<<<
https://finance.yahoo.com/quote/HSY/profile?p=HSY
---
Election year coming, that IMO is a plus for the market.
>> shaky world <<
Yes, definitely a lot going on, but at least the Fed's tightening cycle is likely over, so everyone is piling back into stocks. What worries me is next year and the potential for what I call the 'US bombs Iran' scenario. I figure the various 'powers that be' factions are itching to use this opportunity to destroy Iran's nuclear enrichment capabilities. Accomplishing this would require a significant event / provocation to get the ball rolling -- either a US ship hit / sunk in the Middle East, or a 9-11 type event happening here in the US. I figure it isn't very likely yet, but as the months go by next year I may start reducing the stock exposure from 20% down to 10% just in case. For now though, I figure investors can enjoy the ride, so 'don't fight the tape', 'don't fight the Fed'.
Btw, not sure if you are still following the nuclear energy space, but it's been surprising to see Centrus Energy (LEU) not participating much at all in recent months, just going sideways while other nuclear plays have been climbing (URA, URNM, NLR, etc). Another laggard has been the farmland play LAND. It did have a bounce today, but looks like the chart is still trying to form a bottom. The other farmland play FPI has done somewhat better.
Anyway, better to just stick with the broader index imo, so I've been using the S+P 500, plus the mid and small cap index ETFs (VO, VB), along with a little in the High Dividend Stock ETF (VYM). But only 20% total, so not a huge allocation. Just curious if you decided to get back in the market with a portion? Certainly can't blame you for wanting to stay on the sidelines, I'm very leery of the markets and world situation too. But hope you are having a nice (pre) holiday season, and enjoying it with your loved ones :o)

---
Got a shaky world right now, a new shoe could drop and spoil the party?
Looks like the green light is flashing for everyone to get back into the stock market. Here's today's headline from Fed mouthpiece Nick Timiraos (below) ---> the Fed is 'penciling 3 rate cuts in 2024'. It doesn't get much clearer than that. Next stop for the S+P 500 in the near / mid term should be the all time high near 4800.
The RSI indicators are near term way overbought, but the upward momentum is huge right now. As they teach in 'chart school' -- price action ultimately takes precedence over TA signals. Fwiw, I figure 4800 would be the logical time for a pullback / consolidation. After that the market could continue to recover in 2024, barring any black swan events of the 'US bombs Iran' variety. My conclusion for now is 'don't fight the tape' and 'don't fight the Fed' -
>>> Fed Holds Rates Steady and Sees Cuts Next Year
Officials don’t rule out further hikes while penciling in three rate cuts in 2024
The Wall Street Journal
By Nick Timiraos
Dec. 13, 2023
https://www.wsj.com/news/author/nick-timiraos
WASHINGTON—The Federal Reserve held interest rates steady and signaled inflation had improved more rapidly than anticipated, opening the door to rate cuts next year.
Most officials penciled in three interest rate cuts for 2024 in projections released after their two-day meeting on Wednesday...
<<<
---
Bounce idea - >>> MEI Pharma, Inc. (MEIP), a clinical-stage pharmaceutical company, focuses on the development and commercialization of various therapies for the treatment of cancer. The company develops Zandelisib, an oral phosphatidylinositol 3-kinase delta inhibitor for the treatment of patients with relapsed/refractory follicular lymphoma; and Voruciclib, an oral cyclin-dependent kinase 9 inhibitor, which is in Phase I clinical trial for acute myeloid leukemia and B-cell malignancies. It also develops ME-344, a mitochondrial inhibitor targeting the oxidative phosphorylation complex which has completed Phase I clinical trial for the treatment of human epidermal growth factor receptor 2 negative breast cancer. MEI Pharma, Inc. has a license agreement with Presage Biosciences, Inc. The company was formerly known as Marshall Edwards, Inc. and changed its name to MEI Pharma, Inc. in July 2012. MEI Pharma, Inc. was incorporated in 2000 and is headquartered in San Diego, California.
<<<
---
Jan effect bounce ideas - >>> Enanta Pharmaceuticals, Inc. (ENTA), a biotechnology company, discovers and develops small molecule drugs for the treatment of viral infections and liver diseases. Its product pipeline comprises EDP-514, which is in phase 1b clinical development for the treatment of chronic infection with hepatitis B virus or HBV; EDP-938 and EDP-323, which is in phase II clinical development for the treatment of respiratory syncytial virus; EDP-235, which is in phase II clinical development for the treatment of human coronaviruses; and Glecaprevir, which is in the market for the treatment of chronic infection with hepatitis C virus or HCV. The company has a collaborative development and license agreement with Abbott Laboratories to develop, manufacture, and commercialize HCV NS3 and NS3/4A protease inhibitor compounds, including paritaprevir and glecaprevir. Enanta Pharmaceuticals, Inc. was incorporated in 1995 and is headquartered in Watertown, Massachusetts.
<<<
---
Jan effect bounce ideas -- >>> Revance Therapeutics, Inc. (RVNC), a biotechnology company, engages in the development, manufacture, and commercialization of neuromodulators for various aesthetic and therapeutic indications in the United States and internationally. The company's lead drug candidate is DaxibotulinumtoxinA for injection, which has completed phase III clinical trials for the treatment of glabellar (frown) lines and cervical dystonia; is in phase II clinical trials to treat upper facial lines, moderate or severe dynamic forehead lines, and moderate or severe lateral canthal lines; and has completed Phase II clinical trials for the treatment of adult upper limb spasticity and plantar fasciitis. It is also developing OnabotulinumtoxinA, a biosimilar to BOTOX. The company also offers Resilient Hyaluronic Acid (RHA) dermal filler for the correction of moderate to severe dynamic facial wrinkles; RHA Redensity, a dermal filler for the treatment of moderate to severe dynamic perioral rhytids; and OPUL Relational Commerce Platform, a financial technology platform. It has a collaboration and license agreement with Viatris Inc. to develop, manufacture, and commercialize onabotulinumtoxinA. The company was formerly known as Essentia Biosystems, Inc. and changed its name to Revance Therapeutics, Inc. in April 2005. Revance Therapeutics, Inc. was incorporated in 1999 and is headquartered in Nashville, Tennessee.
<<<
---
Bearish - >>> Lightwave Logic, Inc. (LWLG), a development stage company, focuses on the development of photonic devices and non-linear optical polymer materials systems for fiber-optic data communications and optical computing markets in the United States. The company is involved in the designing and synthesizing of organic chromophores for use in its electro-optic polymer systems and photonic device designs. It also offers electro-optic modulators, which converts data from electric signals to optical signals for transmission over fiber-optic cables; and polymer photonic integrated circuits, a photonic device, which integrates various photonic functions on a single chip. In addition, the company provides the ridge waveguide modulator, a modulator that fabricates the waveguide within a layer of its electro-optic polymer system. It focuses on selling its products to electro-optic device manufacturers, contract manufacturers, original equipment manufacturers, semiconductor companies, optical network companies, Web 2.0/3.0 media companies, computing companies, telecommunications companies, aerospace companies, automotive companies, and government agencies. The company was formerly known as Third-order Nanotechnologies, Inc. and changed its name to Lightwave Logic, Inc. in March 2008. Lightwave Logic, Inc. was founded in 1991 and is headquartered in Englewood, Colorado.
<<<
---
Chart setup - >>> MEI Pharma, Inc. (MEIP), a clinical-stage pharmaceutical company, focuses on the development and commercialization of various therapies for the treatment of cancer. The company develops Zandelisib, an oral phosphatidylinositol 3-kinase delta inhibitor for the treatment of patients with relapsed/refractory follicular lymphoma; and Voruciclib, an oral cyclin-dependent kinase 9 inhibitor, which is in Phase I clinical trial for acute myeloid leukemia and B-cell malignancies. It also develops ME-344, a mitochondrial inhibitor targeting the oxidative phosphorylation complex which has completed Phase I clinical trial for the treatment of human epidermal growth factor receptor 2 negative breast cancer. MEI Pharma, Inc. has a license agreement with Presage Biosciences, Inc. The company was formerly known as Marshall Edwards, Inc. and changed its name to MEI Pharma, Inc. in July 2012. MEI Pharma, Inc. was incorporated in 2000 and is headquartered in San Diego, California.
<<<
---
>>> 9 Short Squeeze Stocks That Could Take Off in November
Whether driven by Reddit users or tactical traders, volatile short squeeze stocks can generate huge returns.
By Wayne Duggan
Nov. 2, 2023
https://money.usnews.com/investing/articles/short-squeeze-stocks-that-could-take-off
<<<
__
>>> Centrus Energy Corp. (LEU) supplies nuclear fuel and services for the nuclear power industry in the United States, Japan, Belgium, and internationally. The company operates through two segments, Low-Enriched Uranium (LEU) and Technical Solutions. The LEU segment sells separative work units (SWU) component of LEU; SWU and natural uranium components of LEU; and natural uranium for utilities that operate nuclear power plants. The Technical Solutions segment offers technical, manufacturing, engineering, procurement, construction, and operations services to public and private sector customers, including the American Centrifuge engineering and testing activities. The company was formerly known as USEC Inc. and changed its name to Centrus Energy Corp. in September 2014. Centrus Energy Corp. was incorporated in 1998 and is headquartered in Bethesda, Maryland.
<<<
---
>>> Acurx Pharmaceuticals, Inc. (ACXP), a clinical stage biopharmaceutical company, develops antibiotics to treat bacterial infections. The company's lead antibiotic candidate is ibezapolstat, a novel mechanism of action that targets the polymerase IIIC enzyme that has completed Phase IIa clinical trial to treat patients with clostridium difficile infections. It is also developing ACX-375C, a potential oral and parenteral treatment targeting gram-positive bacteria, including methicillin-resistant staphylococcus aureus, vancomycin-resistant enterococcus, and penicillin-resistant streptococcus pneumonia. The company was incorporated in 2017 and is headquartered in Staten Island, New York.
<<<
---
S+P 500 trading strategy -
Chart support levels -
1st Support - 4305 (Aug '22 high)
2nd Support - 4275 (early June trading range) (or 4250-4300 zone)
Key Support - 4200 (the rising 50 MA, and is also the top of the ascending triangle which formed over last 6 mos, from which the recent breakout started)
Strategy - I'm hoping for a re-test of the 50 MA in the weeks ahead. So a possible re-entry for the Flex portion of the stock allocation. Alternately, may use a gradual averaging in strategy once the S+P 500 drops into the 4200-4275 zone. In a few week the rising 50 MA should be in the 4250 area. The 50 MA is the key target to watch in the near/mid term.
All IMHO :o)
---
Flex trading strategy -
Just thinking out loud here, but I'm hoping the S+P 500 retraces back down to at least 4350 as the first potential re-entry point for Flex. 4280-4300 would be better, but will see how things go next week.
Below that is the breakout level of 4200 and the rising 50 MA, so that area (4200) is key support, or the broader 4150-4200 band, or even broader 4050-4150 zone. But more likely a small pullback and then more buoyancy, but time will tell.
---
Looks like Rumble (RUM) is finally starting to move. Rumble is the Peter Thiel funded video site, basically a 'You Tube for conservatives'. Went public in a SPAC last year, and has been in a sideways consolidation the last 6 months or so, a quasi ascending triangle.
Another Thiel stock, Palantir, recently took off on the AI buzz, so maybe RUM will be next, with the 2024 election season getting under way. Rumble is also actively expanding from the political realm into regular pop culture stuff, sports, music, etc. Anyway, the stock may be starting to break out.
---
>>> A 24-year-old stock trader who made over $8 million in 2 years shares the 4 indicators he uses as his guides to buy and sell
Business Insider
by Laila Maidan
May 30, 2023
https://finance.yahoo.com/news/24-old-stock-trader-made-063529644.html
One of Jack Kellogg's main indicators is the volume-weighted average price (VWAP).
This shows the average price paid for shares and helps him gauge sentiment.
He only uses indicators as a t=rough guide but never trades solely on them, he noted.
Jack Kellogg began trading stocks right out of high school in 2017.
Five years into his craft, he has already been exposed to various types of market conditions, including the stock market crash of 2020, the raging bull rallies of 2021, and the bear market of 2022. One thing he has learned through it all is to keep things simple and remain flexible.
"There's this acronym: KISS, keep it simple stupid. I don't think people need super fancy indicators to make money trading. I'm just using basic trend lines, support, resistance, volume, and those are all my indicators," Kellogg said. "I think if you overcomplicate the indicators, it will actually throw off your trading because then you're trading more on the indicators than the actual price action."
This attitude has allowed him to become a versatile trader who takes both long and short positions when appropriate, which helped him to continue trading throughout the bear market of 2022. His tax returns, viewed by Insider, showed that he reported over $8 million in gains from day trading in 2020 and 2021. His returns gained momentum in 2020 when he had a total income of $1.6 million. In 2021, that amount grew to a total income of $6.5 million.
Kellogg has come a long way since starting off with $7,500 which is what he initially deposited when he started trading. His road to success wasn't a straight line. When he first attempted to trade, he was down a few hundred dollars. This led him to realize that he didn't know what he was doing.
So his next moves included switching off real trading and testing his skills through paper trading. Then, he signed up for an online course his parents helped pay for. The program, which was created by Timothy Sykes, a trading teacher and former penny-stock trader known for claiming to flip his bar mitzvah cash gift into over $1 million in gains, helped him develop the skills and patience he then used to craft his skill.
By the time the stock market began to rally hard in 2020, he was ready to ride the upwards wave. In 2022, when the market slowed, he continued to reel in profits by betting on popular stocks like Bed Bath and Beyond (BBBY) and AMC (AMC), the latter of which banked him $60,000, according to a screenshot of his E-Trade brokerage account. He also traded a few small-cap stocks and saw large wins on single trades like Intelligent Living Application Group Inc. (ILAG) which earned him over $91,000, according to screenshots of his Guardian account.
His top 4 indicators
The first indicator he uses as a sentiment guide is the volume-weighted average price (VWAP), which shows the average price paid for shares through all trading adjusted for volume. He uses it on the daily chart as a guide to determine a good buy-in price for the stock he's trading. This keeps him from being a chaser, the term popularly used for those who enter a position too late or after a stock begins to rally.
If the goal is to buy low and sell high, you don't want to pay more than what the average buyer paid, he noted. Therefore, Kellogg won't enter a position if the price is above the VWAP line. The opposite is true if he's shorting a stock: if the price is beneath the VWAP, he generally won't short the stock.
Oftentimes, he'll use this indicator to also determine when to exit his position because that point can sometimes indicate where a stock's price will begin to drop off. The same is also true in reverse: he'll sometimes use the VWAP to determine the price point where he'll cover his position. Therefore, if he shorted a stock at $9 and the VWAP is at $7.50, he'll use that price as a point to lock in profits.
For example, on January 5, he took a short position on ticker AMTD at $2.50. VWAP's center line was trending at around $2.22. So Kellogg covered his position at $2.25 and made a 10% profit.
The next indicator is linear regression, which shows the direction price is trending and when it may change its direction. They are three lines that overlay the candles. The lower and upper lines are the ranges of price movements or volatility, while the center line indicates the average between the two. Price action above the top line signals an overbought stock, and below the bottom line, an oversold stock.
"So the better a stock is respecting the lines of the channel that's created, the more predictable I think the stock's going to be," Kellogg said. This gives him a better sense that the stock's price action will trend according to his thesis.
The next indicator is volume which shows the number of shares being traded at any moment in time. Kellogg mainly uses volume as a potential indicator that a stock may reverse.
"Seeing big volume go through, I know that potentially a lot of people are on the wrong side. So if a big volume spike goes through near the high of the day, it's possible that a lot of people are buying the stock and a lot of people are chasing," Kellogg said.
Finally, he keeps his eye on the support and resistance lines, the former being where the price tends to hold and the latter where it tends to sell off. The levels change throughout the day. Kellogg tries to find the key levels by looking for a parallel increase in volume in those areas. He also pays attention to how many times and for how long a price level holds to determine how strong that point is. While it's not an exact science, general areas where the price hoovers for 30 minutes to an hour are the strongest, he said.
"Eventually, you'll see a bouncing ball-type price action if the stock is going to go lower," Kellogg said. "So you see it bounce from $7 to $8, then bounce again from $7.30 to $7.50, and then bounce from $7.40 to $7.10, then bounce from $7.20 and eventually cracks the support below $7. And then the question is, is it going to create a resistance level at $7 and continue to head lower?"
At the end of the day, price action is king, Kellogg noted. Even if you have a thesis about why a stock's price can move in a certain direction, if the price is moving differently, you need to cut losses.
"I don't ever just base my entire decision off an indicator. So if an indicator isn't agreeing with the trade thesis, then I simply will cut my losses," Kellogg said. "So I've never ever blamed any of my losses ever on an indicator because I don't let it get to that point. If the price action is continuing down, then I will cut my losses or if the price action is continuing up, then I'll cover my short positioning."
Everyone has access and can view the same data — it's really about what you do with that data, he said. Where most traders struggle is with the psychology of trading. You can have the best strategy and indicators, but if you don't have the discipline to stick to it, then you will constantly find yourself in a bad situation. Most people don't put in enough effort to master their emotions, he said.
<<<
---
The S+P 500 has been surprisingly resilient, and a lot of money sits on the sidelines. The chart pattern looks bullish, almost an ascending triangle, but until key issues are resolved (debt ceiling) the market is reluctant to move up and get through the 4200 level. Once above 4200 the new uptrend of higher high / higher lows (since the Oct low) will be fairly undeniable.
In the bullish scenario, the next development would be resolution of debt ceiling, continued progress on inflation, a Fed pause in June, triggering a decent summer rally. But.. lots of landmines remain, potential for more banking problems, a slowing economy in the Fall, eroding corporate profits, plus geopolitical unknowns, etc.
---
I did a sample of some hot stocks. It was 50 day was better 20 times some the 100 better 35 times. I guess the 100 is more established or such.
I want to check using the 100 to det in and the 50 to get out.
Looks like one limitation in using the 20 MA as the buy/sell signal would be that the up move needs to be fairly dramatic, prolonged, and at a steep angle. At shallower angles or with frequent pullbacks, the 20 MA could be too sensitive, so maybe then use the 50 MA . Just a guess though.
I watched some of the day traders on YouTube who show their techniques in real time, and it appears there is a fair amount of instinct or intuition involved. They pull together all kinds of subtle 'inputs' of information, and of course they only show their successes. Getting things right appears to be an art form, and very few can do it consistently.
That said, there are certain chart setups that you just know are going to break out (or break down), and they almost always do. But you don't run across these that often. I like to look for ascending and descending triangles, and these can be followed at leisure since they take some time to form.
Years ago I followed a 'Pincher Chart' board on I-Hub ('Mr Bigz'), learned how to set up the chart parameters, etc. That was great fun, but the problem with those stocks is they're almost always mega dogs, so not stocks you want to get stuck with. Better to play around with a fundamentally good stock that temporarily runs into trouble.
In addition to Generac, I keep my eye on Scott's Miracle Gro (SMG), since it's been clobbered huge, but they still have their core lawn oriented business. Problem is they've gotten so far into the cannabis side that they are now inextricably linked to it and it's a huge part of their overall business. Better to stay away from the cannabis sector altogether imo. That said, if the SAFE Banking Act ever gets passed, that will obviously light a fire under the sector. But I basically have stopped following the sector, and think the legalization push is a bad idea anyway. Like so many other of their pet projects (climate change), the globalists always disguise their malevolent intentions behind a benevolent appearing facade.
---
The small stocks got killed the most last year. I'g guess they might do OK.
Generac - >>> Could the Worst Stock in the S&P 500 in 2022 Be a Buy in 2023?
Motley Fool
By Michael Byrne
Jan 15, 2023
https://www.fool.com/investing/2023/01/15/could-the-worst-stock-in-the-sp-500-in-2022-be-a-b/?source=eptyholnk0000202&utm_source=yahoo-host&utm_medium=feed&utm_campaign=article
KEY POINTS
Generac stock got crushed in 2022, and plummeted even further in the fall after management cut its guidance.
The company is still growing at an impressive clip.
Generac's valuation now looks a lot more palatable.
While the whole market was down in 2022, few stocks had a worse year than Generac (GNRC 3.01%). In fact, with a decline of 71%, it was the worst performer of the year in the S&P 500.
The maker of backup generators and other power-generating devices was a high flyer for much of 2021, when its market cap essentially doubled. But the stock began to decline after peaking in late 2021 and went on to lose an incredible 71% of its value in 2022. Generac investors are licking their wounds after a terrible 2022, but is there any reason for optimism that the beleaguered stock can bounce back in 2023?
I've got the power
Generac is best known for its generators which serve the residential and commercial markets. In recent years, it has also increasingly used acquisitions to diversify into additional areas like solar, battery storage, and energy management systems. The company has a great track record of long-term revenue growth, increasing sales at an outstanding 18% compound annual rate since going public in 2010.
It's the undisputed heavyweight in home generators, with a market share of about 75%. However, it still has a long runway for growth ahead as it estimates that this market is only 5.5% penetrated. Management sees further growth in home standby generation as a significant opportunity, and it's feasible that the severe winter storms of December 2022, which caused millions of customers across 13 states to lose power, will reinforce homeowners' interest in having backup power sources. Generac says that every additional percentage point of penetration for backup generators adds an additional $2.5 billion in addressable market for the company.
While this is a large opportunity in its core market, Generac also says that the acquisitions it has made over the past few years have expanded the size of its served addressable market by 500% since 2018. The company now makes inverters, which convert the DC electricity that solar panels generate into AC electricity -- the type that the grid supplies and our homes and businesses use. That's a market with potential -- solar power's installed capacity is expected to grow at a 12.7% compound annual rate over the next five years.
Beyond solar, the company has also moved into battery-powered lawnmowers with the acquisition of Mean Green, smart-home solutions with the acquisition of Ecobee, and more. If Generac can capture more market share in some of these new markets, it could add significantly to the company's growth in the years ahead.
Lower expectations create an attractive valuation
While Generac was punished for its sharp reduction in guidance, it's important to note that it hasn't suddenly turned into a slow-growth or no-growth company. This is still a profitable business, and the company still expects to report that it grew revenue by 22% to 24% in 2022. That isn't as compelling as the 36% to 40% it originally guided for, but it's still pretty impressive growth.
In some ways, Generac has been a victim of its own success, as the stock surged past $500 in October 2021 on the back of terrific growth. But as it lapped those difficult comps from 2021, its growth rate slowed, and the stock fell to just below $100 a share as of the end of 2022.
The stock contended with additional challenges over the course of the year, such as a lack of technicians to install its generators. The company now has partnerships with 8,500 dealers (300 more than the previous quarter), so it is working chip away at this challenge, and it says demand remains strong. Additionally, Generac dealt with a major customer declaring bankruptcy.
One area for concern is that the company's debt has increased significantly in recent times while its cash has decreased as it has pursued acquisitions. Total debt outstanding went from about $882 million in September of 2020 to over $1.3 billion as of the most recent quarter. The company now has a debt to EBITDA ratio of about 2.15. While this isn't egregious, it is something for investors to keep an eye on.
At this point, Generac's valuation looks undemanding. The stock trades at 15 times earnings and 14 times forward earnings, putting it just below the average multiple for the S&P 500.
Generac is actively engaging in share repurchases, and the company's Board recently authorized a new share repurchase program that will allow the company to buy back up to $500 million worth of its stock over the next two years.
With this lower valuation, and against a backdrop of lowered expectations, and more share buybacks on deck the stock looks a lot more palatable as a buy.
This won't be the worst stock in the S&P 500 again
Given the company's track record of growth and the long potential runway ahead of it, it seems likely that the present issues aret a speed bump on the road to Generac's long-term success. These lower prices offer investors a potentially favorable entry point. Janney Scott Mongomery recently initiated coverage of the stock with a buy rating, while Northland Capital went a step further, calling Generac its top pick of 2023.
Both analyst firms are of the opinion that the shares are undervalued, and Northland Capital thinks that the recent series of high-profile power outages across the United States could spur demand for home standby generators. The firms' new price targets of $160 and $180 imply meaningful upside from Generac's current share price. While such targets are best taken with a grain of salt, it's clear that there is the potential for plenty of upside ahead if Generac can get back on track, making it worthy of a small or more speculative investment for risk-tolerant investors.
<<<
---
I did a lot of trading in the past. Bear markets are tough, many false starts. I did not do well in 2008-10. And we have not had a log term bear innquite some time, may be in one now and not know it yet.. Still, moving averages get you out as well a keep you in.
My guess is market makers individually use certain moving averages. With RIBT, the 50 was key coming down he last six months and MIGHT signal a buy before the 100 now, if it holds?
https://stockcharts.com/h-sc/ui?s=RIBT&p=D&yr=5&mn=0&dy=0&id=p59232107979
SURG which we talked about here in the past, the one keeping us in now would have been the 100MA?
https://stockcharts.com/h-sc/ui?s=SURG&p=D&yr=5&mn=0&dy=0&id=p54825710052
Using the 20 MA seems like an effective tool. When the stock is above the 20 MA, hang on, and when it breaks down under the 20 MA you sell. I haven't done all that much trading, but that seems like a good approach.
Unfortunately I learned TA a little too late, after floundering around for years without any clue at all about how to read a chart, with predictably bad results. But ultimately, the best idea is to not trade at all, but simply - 1) buy quality, 2) hold long term, 3) ignore volatility. That way, active trading not only isn't necessary, but is counterproductive..
I do use the charts (10 year) as a key screening tool for identifying the best long term stocks for buy/hold. Charts also help with the timing of the entry, ie wait for a pullback if the RSI is over 70, etc. But once you own the stock, you can just sit with it hopefully for decades. Using the S+P 500 index is the other part of the equation, since that eliminates the need for stock selection altogether.
So, no need to trade and no need for stock picking. But that gets pretty boring, especially if stocks and investing have become a favorite hobby. So maybe a small % could be allocated to active trading for fun, with strict position limits. But the only stocks I would consider 'trading' would be those that you wouldn't mind owning long term anyway (like Generac). Then if the trade goes against you, it's a solid stock and time will bail you out. But generally, the old saying is true - 'The more you trade, the more you lose'.
---
Trading with moving averages
OSTK, you get in with the 20 day MA in April 2020 at about $5, get out at $95 in early August 2020.
https://stockcharts.com/h-sc/ui?s=OSTK&p=D&yr=3&mn=8&dy=0&id=p06202193535
They are no all that neat, lol. NTZ, in and out several times in the big rally from bottom to top with the 20-day, only the 100 worked all the way from about 1 to $16.
https://stockcharts.com/h-sc/ui?s=NTZ&p=D&yr=3&mn=3&dy=0&id=p84122115102
Me, I am hoping the 50 day holds from now until the moon, lol.
https://stockcharts.com/h-sc/ui?s=RIBT&p=D&yr=0&mn=4&dy=0&id=p11714133553
The Nasdaq got back above its 200 MA today, and also above the Dec high (barring a late day selloff). This would send a good TA signal for the Nasdaq, which has been the most beaten down of all the main indices during the bear market.
The S+P 500 is already well above its 200 MA, but is nearing a test of its Dec high. Once it closes above the Dec high, this will be significant because even if it subsequently sells off and drops back below the Dec high (which is likely in the weeks ahead), the S+P 500 will have re-established a pattern of higher lows and higher highs (Dec low higher than Oct low, and Jan high higher than Dec high), ie - an uptrend (albeit tentative) This would support the idea that the bottom may be in (Oct), and a new uptrend has begun. Still early though.
Another favorable TA signal coming soon for the S+P 500 will be a 'Golden Cross', which should occur next week. This is a lagging indicator, but would be a plus for the bullish side. The DJIA already had its Golden Cross in Dec, but the Nasdaq's is still numerous months away.
---
Chart-wise, the S+P 500 is close to testing its 200 MA (4059). Thanks to the recent two week sideways consolidation, there is a growing chance that the current move might continue working its way up toward the 4300 area in the weeks ahead (Aug high). Probably some back + fill along the way, which would be good since periods of consolidation help keep the RSI from reaching nosebleed overbought levels (above 70), and can extend the move.
But first we'll see how the market handles the 200 MA. Nice to be seeing some stock profits again, and with the dollar falling there will hopefully be more near term upside for gold/silver. It's been a lousy year for most investors, so maybe some nice profits in Nov/Dec to close out the year :o)
---
For the S+P 500, the 200 MA is the obvious near term target.
Seeing the sideways consolidation this week might suggest a more paced and durable move, so will see what happens. Still lots of unknowns, geopolitical landmines, etc, but at least it appears that the Fed's rate hikes will now be smaller. No more 3/4 point rises, and this jives with what is coming out of the Fed's unofficial media mouthpiece, Nick Timiraos -
https://www.wsj.com/news/author/nick-timiraos
---
>> SURG <<
Yes, impressive move. I don't know much about the company, but a nice chart setup. In July it started to deteriorate, but then blasted off. Looks like news flow was the key.
Another nice chart pattern right now is Service Corp Intl (SCI). It formed a bullish ascending triangle over the past 6 months, and looks about ready to break up through resistance. I've followed SCI loosely for years, and it's a great long term buy/hold type stock. Funeral services/cemeteries sounds like a boring business, but check out the phenomenal 10 year chart :o)
---
SURG, nice up trend going, top of the upper channel line now, but if it breaks it or follows it, it's all good.
https://stockcharts.com/h-sc/ui?s=SURG&p=D&yr=1&mn=0&dy=0&id=p38100671303
RIBT CC coming soon, rumored good earnings a good PR, so I hear, lol.
>>> SurgePays Passes 150,000 Mobile Broadband Subscribers
Yahoo Finance
SurgePays, Inc.
July 14, 2022
https://finance.yahoo.com/news/surgepays-passes-150-000-mobile-123000052.html
Online Sales Spur Future Growth Acceleration in All 50 States
BARTLETT, Tenn., July 14, 2022 (GLOBE NEWSWIRE) -- SurgePays, Inc. (Nasdaq: SURG) (“SurgePays” or the “Company”), a technology and telecommunications company focused on the underbanked and underserved, announces it exceeded 150,000 subscribers in its mobile broadband subscriber business SurgePhone Wireless LLC (“SurgePhone”), the Company’s wholly owned subsidiary.
“Our goal is to make high speed internet accessible to the underbanked and underserved regardless of income, credit, or location. We believe employment, healthcare, and education for this market will be directly impacted by broadband connectivity,” said Chairman and CEO, Brian Cox.
Mr. Cox continued: “Now that we are a licensed provider of mobile broadband through the Affordable Connectivity Program (“ACP”) in all 50 states, we have made moves to accelerate growth including acquiring one of the leading wireless telecom Customer Relationship Management (“CRM”) cloud software platforms. This instantly increased our online sign-up and enrollment capabilities. We are now seeing over 300 new subscribers a day using custom developed bot technology to reach a larger audience and expect to continue to scale with triple digit growth. A government fact sheet estimated as many as 48 million households qualify under this program, which means we are in the early innings of a significant growth opportunity.
“It’s been my experience that scaling to the next 150,000 subscriber milestone should be much quicker based on economies of scale, software efficiencies and factoring most of the last year we only had 14 states. Now, we have all 50 states, are hitting on all cylinders and reinvesting the gross positive cash to accelerate sales growth. I expect to give another milestone update in the very near future. I am very proud of our team.”
For more information on SurgePays, please visit the Company’s investor relations website at ir.surgepays.com.
About SurgePays, Inc.
SurgePays, Inc. is a technology and telecommunications company focused on the underbanked and underserved communities. SurgePhone Wireless provides mobile broadband to low-income consumers nationwide. SurgePays blockchain fintech platform utilizes a suite of financial and prepaid products to enable corner stores and bodegas to be the tech-hubs for underbanked neighborhoods. Please visit SurgePays.com for more information.
About SurgePhone and Torch Wireless
SurgePhone and Torch, wholly owned subsidiaries of SurgePays, are mobile virtual network operators (MVNO) licensed by the FCC to provide subsidized mobile broadband services to consumers qualifying under the federal guidelines of the Affordable Communication Program (ACP). The ACP provides SurgePhone up to a $100 reimbursement for the cost of each tablet distributed and a $30 per customer, per month subsidy for data services. SurgePhone and Torch collectively have received approval to offer subsidized mobile broadband in all 50 states.
<<<
---
That Reddit guy touting CCWF may have been trying to generate some buying so he could exit his position. Probably best to avoid those OTC penny stocks altogether, as a general rule, especially if/when the Reddit and Robinhood crowd show up. Former crypto players will likely be migrating over to penny stocks now, so another reason to stay away.
I figure a stock has to be worthy of being owned long term, even if the current goal is a short term trade. That way if the trade goes wrong, you won't mind holding on to it :o)
---
I thiks somebody has it in for the Reddit boys. One of thie dudes was touting CCWF last week and Monday it made a move, they yesterday down 20% on the close, much worse intra day, then another 14% today.
https://stockcharts.com/h-sc/ui?s=CCWF&p=D&yr=0&mn=3&dy=0&id=p83239124241
Looks like SURG finally made it through 5, at least for now.
Resistance should be the broad band from 5-7 (the 2021 trading range), so that may limit the near term upside, based on the chart anyway.
RIBT and BABYF both trying to find bottoms. RIBT has that de-listing and rev-split deadline, so should be interesting. It looks like the Redditt crowd might not be returning, but perhaps there is some upcoming company news flow that will get the stock moving.
The broader markets have gotten back above their 50 MAs, so a good sign. Fwiw, I accelerated my re-entry timeline, though still need to be cautious. I have it set for a 15% stock allocation by the end of the year, subject to revisions, with a goal of 25-30% in stocks as the ultimate allocation. I also have the investment vehicles selected (link below, marked orange on the right). Am trying to keep things organized and disciplined, which should help reduce the 'nervous nellie' aspect, which for me has always been a problem -
https://investorshub.advfn.com/Portfolio-Ideas-40985
---
>>> Veru Inc. (VERU), an oncology biopharmaceutical company, focuses on developing medicines for the management of cancers. Its commercial products comprise FC2 female condom/internal condom for the dual protection against unintended pregnancy and the transmission of sexually transmitted infections for ministries of health, government health agencies, U.N. agencies, nonprofit organizations, and commercial partners.
The company's development drug candidates include Enobosarm, an oral selective androgen receptor agonist that is in phase III clinical trial for the treatment of AR+ ER+ HER2- metastatic breast cancer;
Sabizabulin, which is phase IIb clinical trial for the treatment of AR+ ER+ HER2- metastatic breast cancer;
Enobosarm + abemaciclib combination therapy, which is in phase III clinical trial for the treatment of AR+ ER+ HER2- metastatic breast cancer; and Sabizabulin + enobosarm combination therapy, an oral targeted cytoskeleton disruptor plus selective androgen receptor agonist, which is in phase II clinical trial for the treatment of metastatic triple negative breast cancer.
Its drug candidates also comprise Sabizabulin, which is in Phase II clinical trial for the treatment of metastatic castration and androgen receptor targeting agent resistant prostate cancer;
VERU-100, a GnRH antagonist peptide injection, which is in Phase II clinical trial for the treatment of advanced hormone sensitive prostate cancer;
Zuclomiphene Citrate, which is in Phase II clinical trial for treating hot flashes; and Sabizabulin, which is in phase III clinical trial for the treatment of SARS-CoV-2 in subjects at high risk for acute respiratory distress syndrome.
In addition, the company is advancing a new drug formulation for the treatment of men with lower urinary tract symptoms from an enlarged prostate. The company was formerly known as The Female Health Company and changed its name to Veru Inc. in July 2017. Veru Inc. was incorporated in 1971 and is headquartered in Miami, Florida.
<<<
---
>>> Winmark Corporation (WINA), together with its subsidiaries, operates as a franchisor of retail store concepts that buy, sell, trade, and consign used merchandise primarily in the United States and Canada. The company operates through two segments, Franchising and Leasing. Its franchises retail stores operate under the Plato's Closet, Once Upon A Child, Play It Again Sports, Style Encore, and Music Go Round brand names. The company's Plato's Closet brand stores buys and sells used clothing and accessories for the teenage and young adult market; and Once Upon A Child brand stores buys and sells used and new children's clothing, toys, furniture, equipment, and accessories primarily to parents of children ages infant to 12 years. Its Play It Again Sports brand stores buys, sells, trades in, and used and new sporting goods, equipment, and accessories for various athletic activities, such as team sports, fitness, ski/snowboard, golf, and others; Style Encore brand stores buys and sells used women's apparel, shoes, and accessories; and Music Go Round brand stores buys, sells, trades in, and used and new musical instruments, speakers, amplifiers, music-related electronics, and related accessories. In addition, the company is also involved in the middle-market equipment leasing business focusing on technology and business-essential equipment. As of February 23, 2022, it had 1,271 franchised stores, as well as offers its products online at musicgoround.com, playitagainsports.com, and style-encore.com. Winmark Corporation was incorporated in 1988 and is headquartered in Minneapolis, Minnesota.
<<<
---
| Volume | |
| Day Range: | |
| Bid Price | |
| Ask Price | |
| Last Trade Time: |


