 News
News  Market Data
  Discover
Support: 888-992-3836
Copyright © 2023 InvestorsHub Inc.


Register for free to join our community of investors and share your ideas. You will also get access to streaming quotes, interactive charts, trades, portfolio, live options flow and more tools.
Thanks Tom.
I think Ameritrade's GTC orders were also 6 months by default unless you chose a date closer when entering.
Any thoughts on the research options? Scanning, Charting, etc?
Hi Steve, Re: AMTD to SCHW switch.....................
I'd moved my personal accounts to Schwab years ago as part of my company's needs. We had all our client's portfolios domiciled at Schwab after consolidating them from many other locations. My kids, on the other hand were still with Ameritrade and their accounts moved, too, but in the 1st wave of this merger. Theirs went smoothly, but they had to do a bit of work with beneficiary notices and some other stuff.
I heard from a friend this AM that his AMTD account finally moved to SCHW. Schwab consolidated his and his wife's accounts in one master. He used to have to sign in to each separately, so this may be a good thing. So far, so good.
I'm also an investor in SCHW and was in AMTD until the merger. It's been a good trader for me as was AMTD in the past. It pays a modest dividend to help things out during dry spells.
https://schrts.co/dQjfuRbE
That halving of the share price between the peak in early 2022 and the bottoming in early 2023 allowed the Equity Warehouse to add a lot of inventory. Currently it's just $2-3 below where we'll let some interested new owner take delivery of 10% of our shares. Note I use 10% of PC as my minimum order size with SCHW. That gives me roughly a 30% ZigZag range for round trip trades. That plus the dividends makes me smile when it happens.
I hope the rest of the switch goes well. I've found SCHW's interface to work pretty well. It's a bit different from Ameritrade, but once you find your usual functions, it goes pretty smoothly. Little things like under the TRADE button, you'll find a choice of looking at your open orders and another to enter a new order. Once you've entered an order you have the choice of viewing the open orders and also entering another order. So, you don't need to go back to the header if you have multiple new orders to enter. Orders remain in the system for around 6 months before self cancelling.
Best wishes,
OAG Tom
Thanks Tom.
Good info as usual.
BTW: Not sure if you're still with TD Ameritrade, but the switch to Schwab happened today.
Seemed to go well. My GTC orders are still there which was a good thing.
After all these years, it will take a bit to get used to the new interface, but that's OK I guess.
I haven't looked at any of the other features yet (especially research) but I will as necessary.
Here's the latest on Value Line's Dividend and Growth Models:
https://investorshub.advfn.com/boards/read_msg.aspx?message_id=174404408
Both lists offer happy hunting grounds for those taking AIM.
Best wishes,
OAG Tom
Hi JD, Re: v-Wave...............................
Overall Q1 Earnings didn't come in badly, so the markets seem to be celebrating. This is happening even as the v-Wave Market Risk hasn't relaxed that much.

At least it's staying below the Caution threshold.
Best wishes,
OAG Tom
v-WAVE 3.0*
Suggested Starting Cash Value For New AIM Accounts/Positions
Individual Stocks
High Risk: At or above 51%
Neutral: Between 37 and 50%
Low Risk: At or below 36%
Diversified Funds
High Risk: At or above 34%
Neutral: Between 25 and 33%
Low Risk: At or below 24%
_________________________
Week of May 17th
_________________________
Short Term (18 Months)
Individual Stocks: 65% (Unchanged from previous week)
Diversified Mutual Funds or Portfolio: 43% (Unchanged from previous week)
__________________________
Long Term (3-5 Years)
Individual Stocks: 49% (Up 1 from previous week)
Diversified Mutual Funds
or Portfolio: 33% (Up 1 from previous week)
Oscillator: 1.29 (Up 1.29 from previous week)
*See posts #44585 and #44588
I finally Called in the shipping department and had them sell about 8% of my WPM at $54.31 today.
DHT is getting close to a sale also with a target of $12.06. Meanwhile it pays a decent dividend while I wait .
Toofuzzy
Hi K, Re: UBA portfolio.....................
Mine has been very quiet for a long time, too.

There's been very healthy volume with the latest rally. Accumulation/Distribution also has looked good. AIM seemed to know it was time to do something for the Cash position.
I've had a sale of two in the gold surrogate IAU, but until the DGS sale, it's been pretty sleepy.
Best wishes,
OAG
DGS is in my UBA
Still going on, no AIM transactions, only dividends to lower the average price.

Individual shares have a lot of AIM sells lately. ETFs were selling in 2023, hopefully we get more ETF sells soon.
Kind Regards,K
Yesterday the warehouse shipped out 5% of the Emerging Markets Small Cap Dividend shares. We had to dust them off as they were in inventory for a long time.
The sale was a good sign.
OAG Tomaso
April Results Roundup............
Tom's Sandbox of 10 Stocks......
Down 2.04% for Month; Up 2.7% YTD

80% Invested
International Style ETF Composite of 9 ETFs
Down 2.19% for Month; Up 1.4% YTD

82% Invested
Tom's Retirement Account
Down 3.26%; Up 7.5% YTD

79% Invested
Tom's US Sector ETF Composite
Down 4.37%; Up 2.4% YTD

85% Invested
Not the greatest month but considering everything, April turned out okay. It was surprising to see International ETFs down less than the US Sector portfolio for the month. Cash Reserves are still healthy, if a bit on the low side. Overall, no buys were generated in April.
Best regards,
OAG Tom
Thank you JD, Re: v-Wave Current Image...........................

It seems that wasn't a very serious correction recently.
Even current events didn't shake the markets very much.
Still, the markets don't seem to be at bargain basement prices.
It's good to keep some dry powder on hand for future hunting seasons.
Best regards,
OAG Tom
v-WAVE 3.0*
Suggested Starting Cash Value For New AIM Accounts/Positions
Individual Stocks
High Risk: At or above 51%
Neutral: Between 37 and 50%
Low Risk: At or below 36%
Diversified Funds
High Risk: At or above 34%
Neutral: Between 25 and 33%
Low Risk: At or below 24%
_________________________
Week of May 10th
_________________________
Short Term (18 Months)
Individual Stocks: 65% (Up 3 from previous week)
Diversified Mutual Funds or Portfolio: 41% (Up 2 from previous week)
__________________________
Long Term (3-5 Years)
Individual Stocks: 48% (Unchanged from previous week)
Diversified Mutual Funds
or Portfolio: 32% (Unchanged from previous week)
Oscillator: .0 (Unchanged from previous week)
*See posts #44585 and #44588
Income portfolio - 3 buys on weekly basis
A world hidiv ETF(euro price only) aimed with a gold ETF(euro price) had buys the last 3 weeks.
In terms of gold, hidiv went down a lot which resulted in 3 buys.
With fiat money in stead of gold there were no buys.
The div% is around 3.5%, that could be added to the portfolio picture, over 14 quarters approx. 8% could be added.
A country with a sovereign wealth fund could energize their gold holdings with such a portfolio ?

Kind Regards, K
Hi JD, Re: v-Wave movement...................
While the 3-5 Year vW didn't change, that's a nice reduction in apparent market risk for the shorter range 18 Month view.
v-Wave Vigilantes will be keeping an eye on the long v-Wave as well as the shorter one to see how we navigate this recent correction.
Best wishes,
OAG Tom
v-WAVE 3.0*
Suggested Starting Cash Value For New AIM Accounts/Positions
Individual Stocks
High Risk: At or above 51%
Neutral: Between 37 and 50%
Low Risk: At or below 36%
Diversified Funds
High Risk: At or above 34%
Neutral: Between 25 and 33%
Low Risk: At or below 24%
_________________________
Week of May 3rd
_________________________
Short Term (18 Months)
Individual Stocks: 62% (Down 3 from previous week)
Diversified Mutual Funds or Portfolio: 41% (Down 2 from previous week)
__________________________
Long Term (3-5 Years)
Individual Stocks: 48% (Unchanged from previous week)
Diversified Mutual Funds
or Portfolio: 32% (Unchanged from previous week)
Oscillator: .46 (Unchanged from previous week)**
**Previous week should have been .46 instead of .0
Problem with spreadsheet; not the messenger!😎
*See posts #44585 and #44588
Hi JD, Re: v-Wave and its current signal...........................
The Index trimming we've seen in the last week shows just how much a surprise event can
affect a market that was showing signs of risk stress already. Note that RISK didn't get worse
because of the tensions, it relaxed a bit as share prices declined. Value Line's P/E dropped
nicely along with the index declines. It's "Appreciation Potential" improved as the markets
gave back some of their recent gains. That improved our v-Wave's current outlook. It's not
yet back to bargain levels seen in late 2022 so keep some powder dry.

Best wishes,
OAG Tom
Thanks, Tom. Your kind words are much appreciated. Least I could do with all of the time, patient and complete explanations and effort you have contributed over the decades helping all of us become better AIMers while at the same time generating discussions, ideas and strategies that benefit everyone.
Take care.
Jon
Hi Jon and Thanks!,
For those of you who don't know JDerb, he was kind enough to take over the v-Wave updates for me back in around 2008 when I joined my partners in forming an investment advisory. Another AIM user, MinstrilMan, also helped out during the transition. Compliance reasons kept me from that and posting here for quite a while. I had to keep a bit lower profile for those reasons.
Jon has been steadfast in keeping us all up-to-date all this time and deserves a round of applause from us all!
Best wishes,
OAG Tom
v-WAVE 3.0*
Suggested Starting Cash Value For New AIM Accounts/Positions
Individual Stocks
High Risk: At or above 51%
Neutral: Between 37 and 50%
Low Risk: At or below 36%
Diversified Funds
High Risk: At or above 34%
Neutral: Between 25 and 33%
Low Risk: At or below 24%
_________________________
Week of April 26th
_________________________
Short Term (18 Months)
Individual Stocks: 65% (Down 12 from previous week)
Diversified Mutual Funds or Portfolio: 43% (Down 8 from previous week)
__________________________
Long Term (3-5 Years)
Individual Stocks: 48% (Down 1 from previous week)
Diversified Mutual Funds
or Portfolio: 32% (Down 1 from previous week)
Oscillator: 0.00 (Down 1.39 from previous week)
*See posts #44585 and #44588
Hi Adam, Re: AAPL and AIM.......................
My own AAPL position has AIM triggers at $150 on the buy side and $206 on the Sell side. Those are for 10% of Portf Control size orders.
It appears our AIM engines are tuned to similar signals.
Best wishes,
OAG Tom
Even though the market is down from its peak I'm still not getting buys except for AAPL which I covered by selling a put one month in the future at 155.
Hi Will, Re: v-Wave and "Timing....."
While the v-Wave wasn't built for being a 'timing' device, it could offer some insight that way. The problem becomes the length of time for these cycles. How long can we await a 'better time" to be starting an investment? If nothing else, the v-Wave offers some caution right now if one starts a new AIM engine with the suggested starting cash held in reserve.
Best wishes,
OAG Tom
Thanks Tom,
I've been away from the site for a while, been busy on a refurb project. Just the snagging to do now.
Sold some stock before the financial year end to transfer the funds into a tax free account (ISA in the UK). I was simply going to repurchase, until I saw your post. Will hang onto the cash for a little while longer. Perhaps when the 18 month wave drops below the long term one?
Will
Hi Darth
I see Jon answered the question but to make it a bit clearer.
I knew I wanted to sell some shares, I thought it might keep going up, but didn't want to risk it going much lower if it didn't go up.
So I placed an order 2% below the last high price ( a trailing stop ) . So as the price moves up the price I would sell keeps moving up ( trailing by 2% )
You can set the trailing % any amount you want but 2% to 10% is typical.
A risk is that a security will fall a lot overnight and the order will fill a LOT lower, in which case a trailing stop limit order would be better but that might not fill at all.
Stop limit orders are an order you can place , I am not sure a TRAILING stop limit is an order you can actually place.
I suggest you Google " stock order types"
Toofuzzy
Good morning JD, Re: v-Wave current status..............
The bothersome shorter term 18 Month view isn't very encouraging.
Another Market Risk Indicator I follow shows three components rising in risk this week with two in their Caution range, one in Neutral and one in Proactive. Overall, it's in its 4th week out of the last 6 of being in its own Caution range with risk expanding this last week.
Even if I didn't turn on the TV News, I'd be feeling a bit cautious about starting any new positions at this point. There were better times in the Past and will again arrive in the Future for new AIM engines.
Best wishes,
OAG
v-WAVE 3.0*
Suggested Starting Cash Value For New AIM Accounts/Positions
Individual Stocks
High Risk: At or above 51%
Neutral: Between 37 and 50%
Low Risk: At or below 36%
Diversified Funds
High Risk: At or above 34%
Neutral: Between 25 and 33%
Low Risk: At or below 24%
_________________________
Week of April 19th
_________________________
Short Term (18 Months)
Individual Stocks: 77% (Unchanged from previous week)
Diversified Mutual Funds or Portfolio: 51% (Unchanged from previous week)
__________________________
Long Term (3-5 Years)
Individual Stocks: 49% (Unchanged from previous week)
Diversified Mutual Funds
or Portfolio: 33% (Unchanged from previous week)
Oscillator: 1.39 (Down .12 from previous week)
*See posts #44585 and #44588
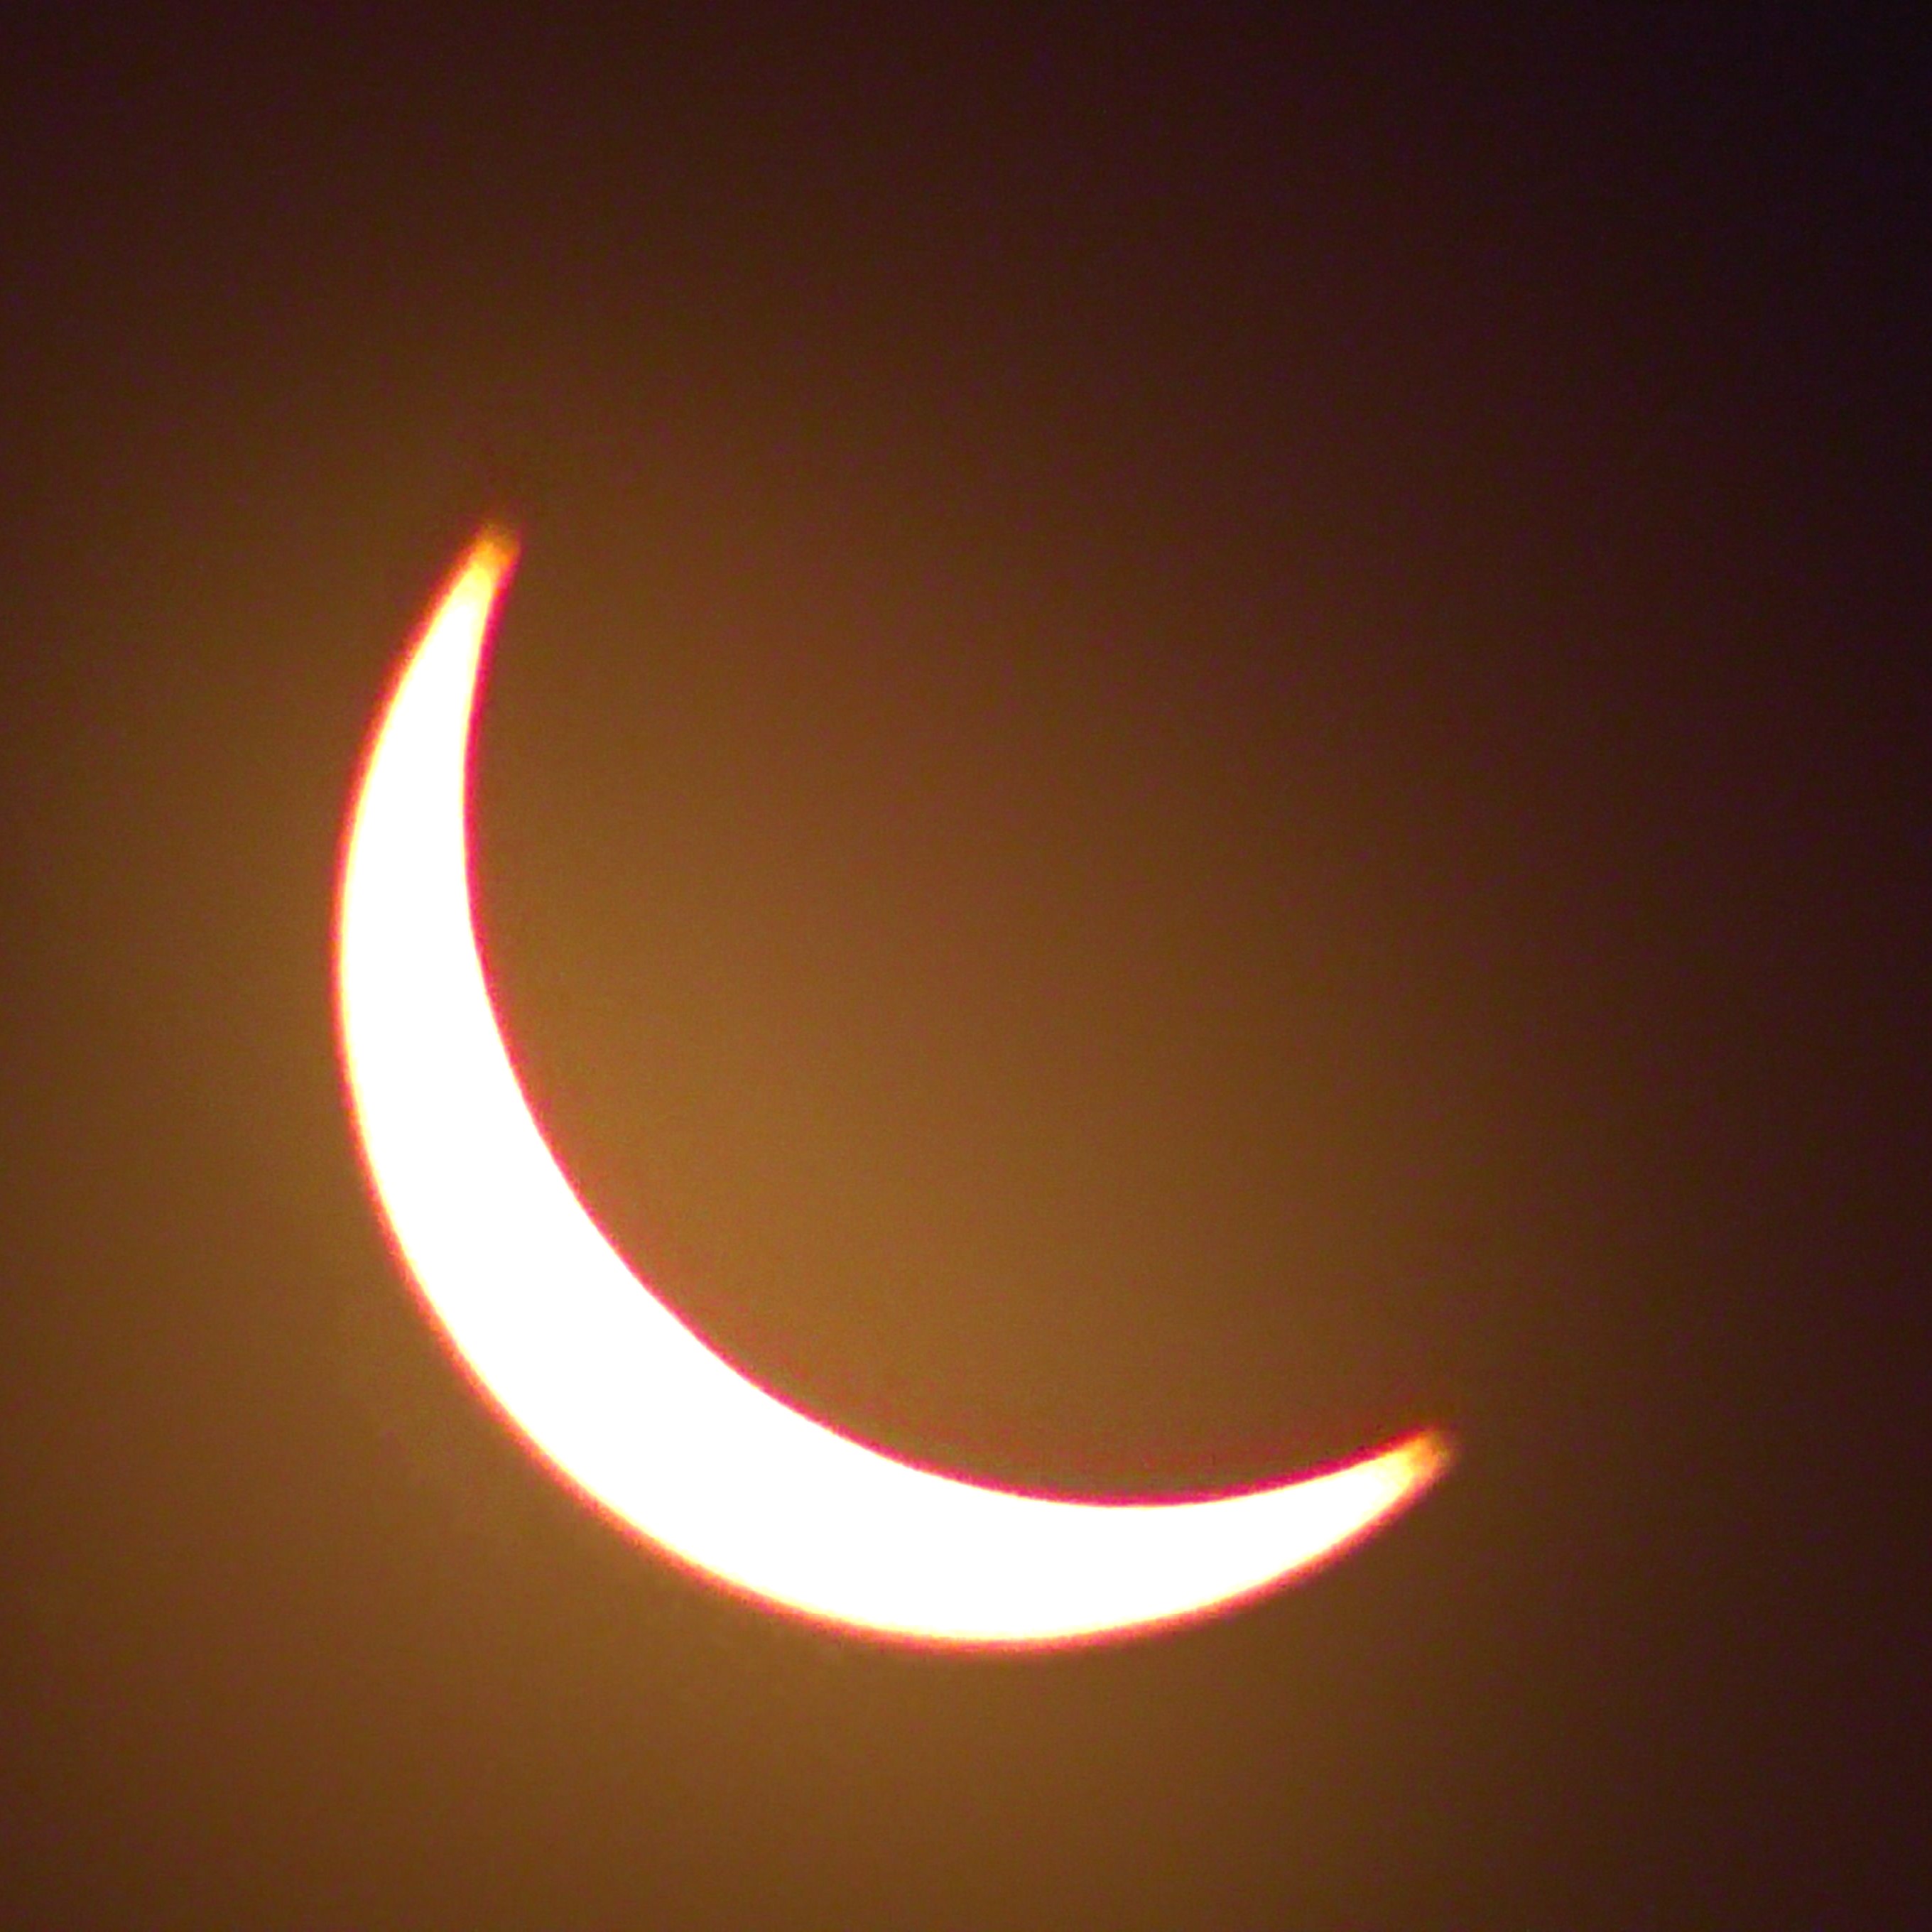
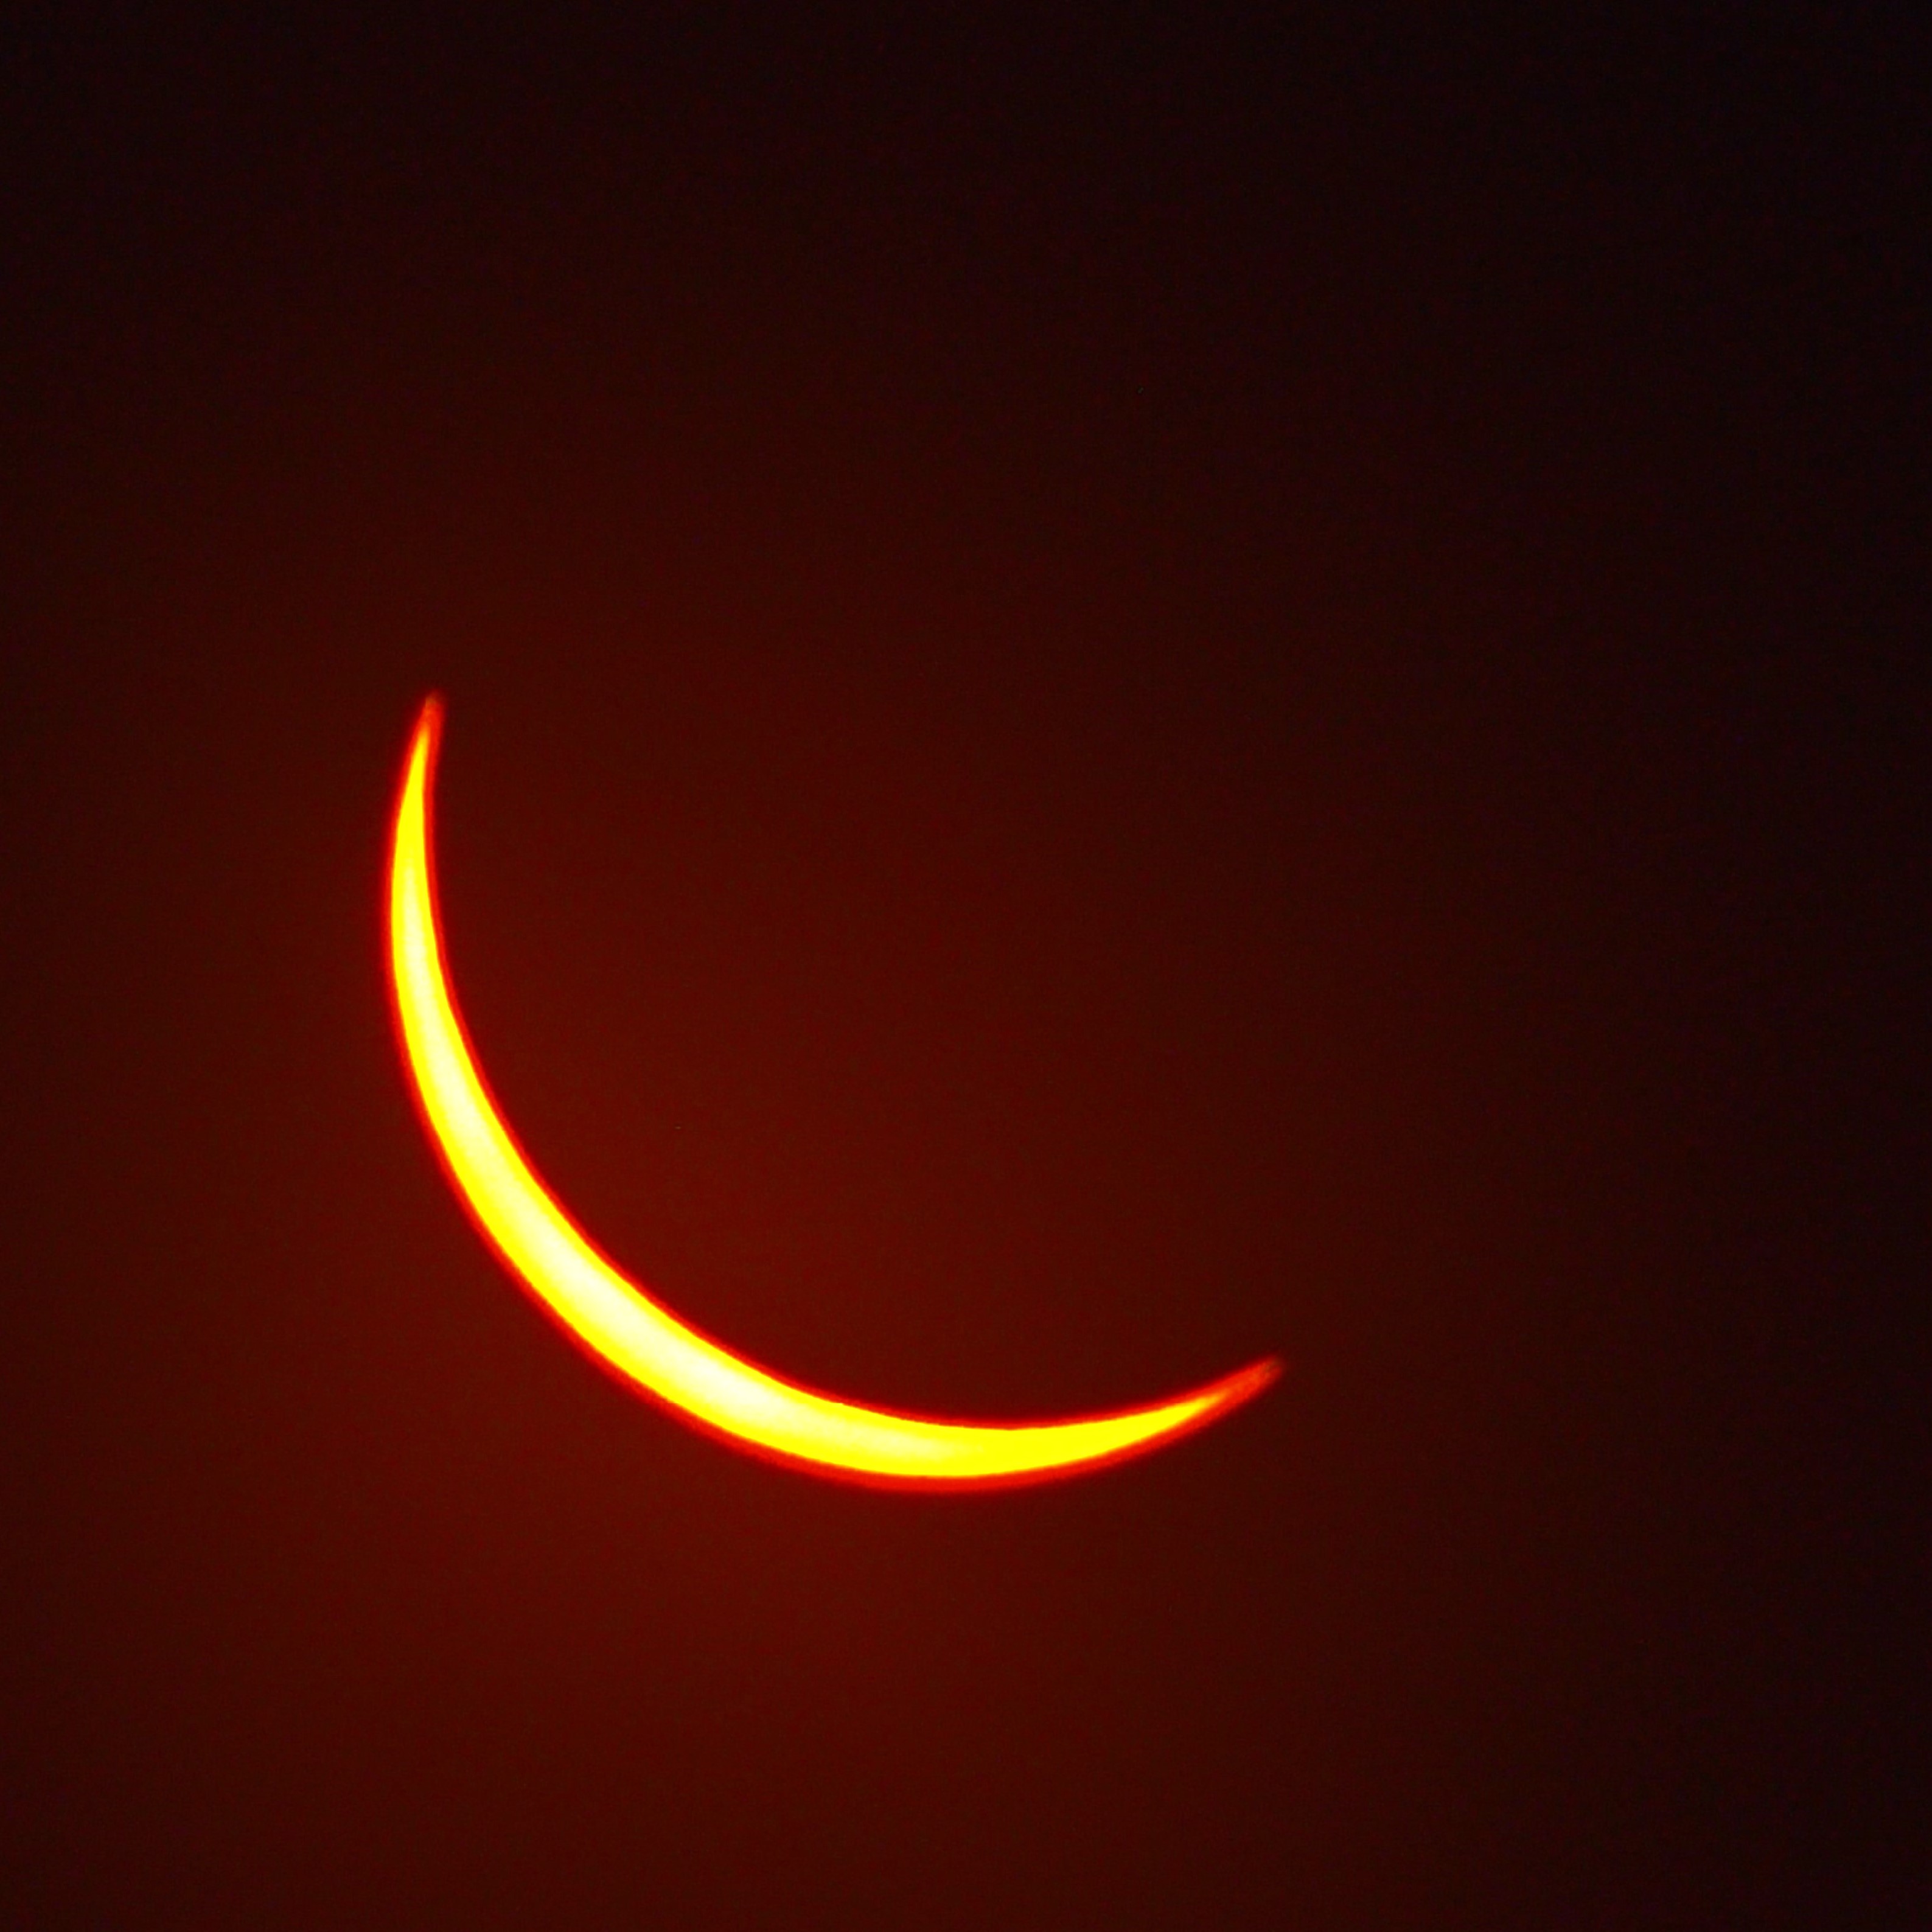
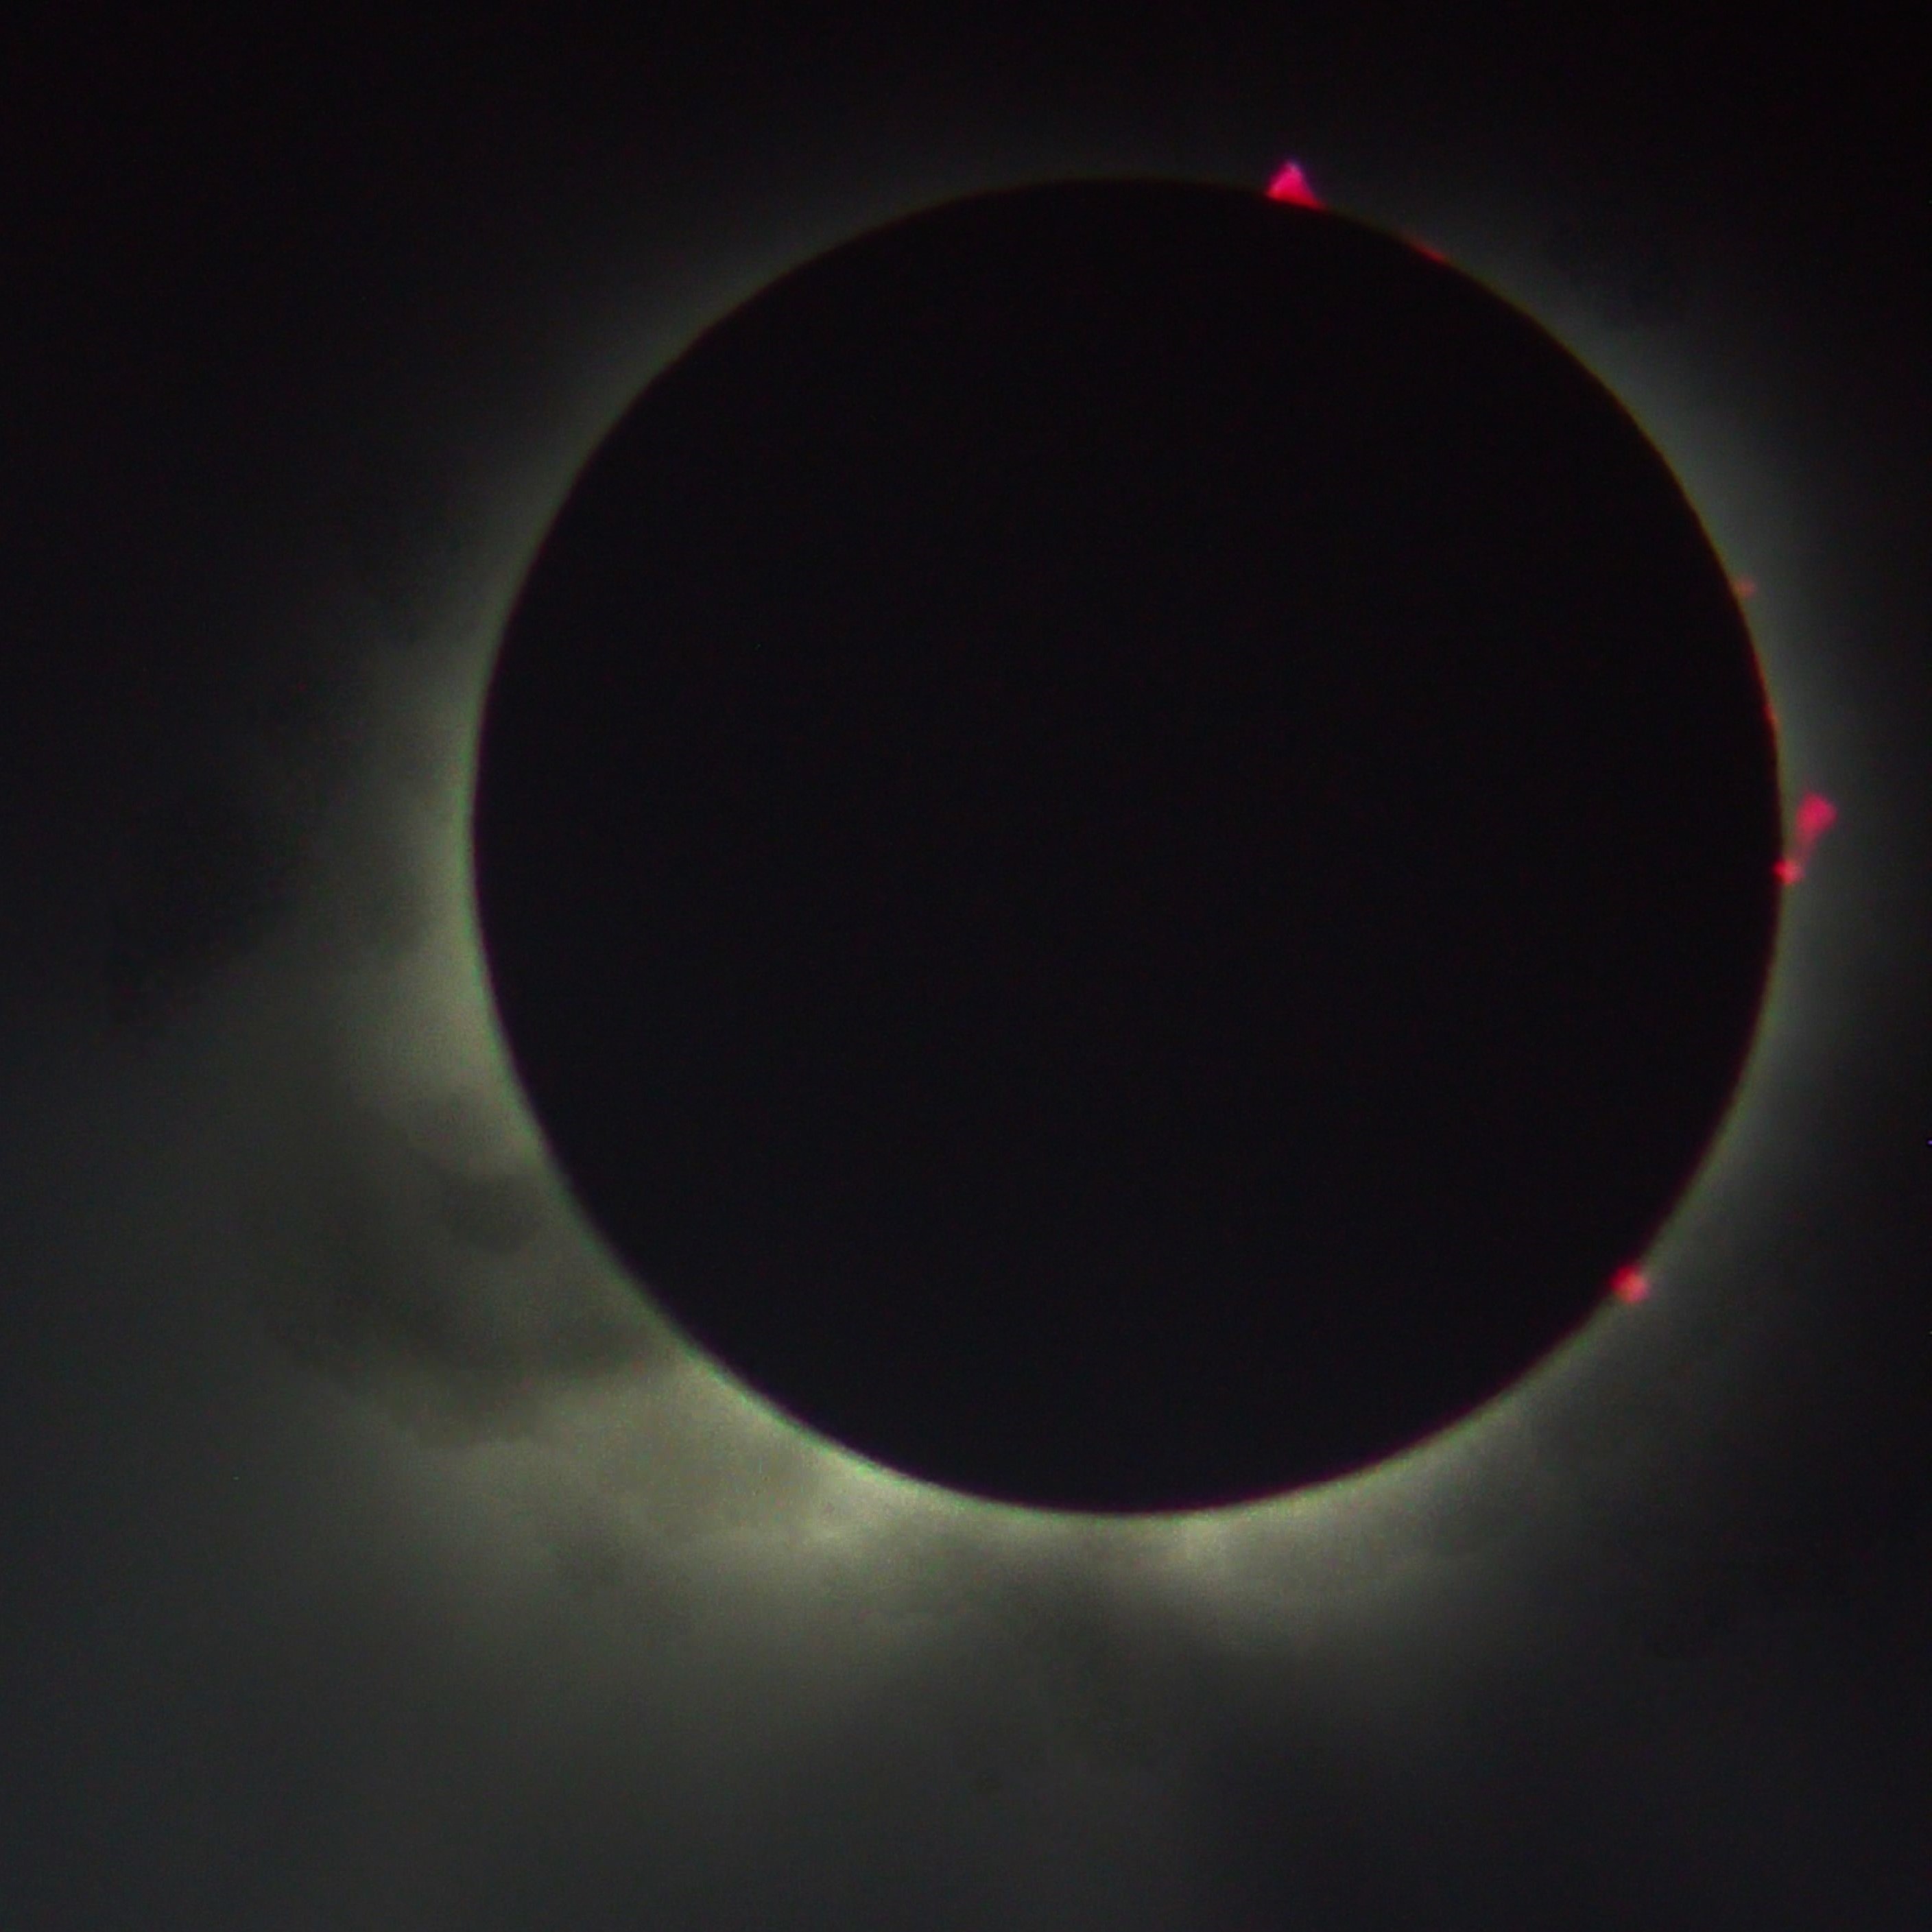
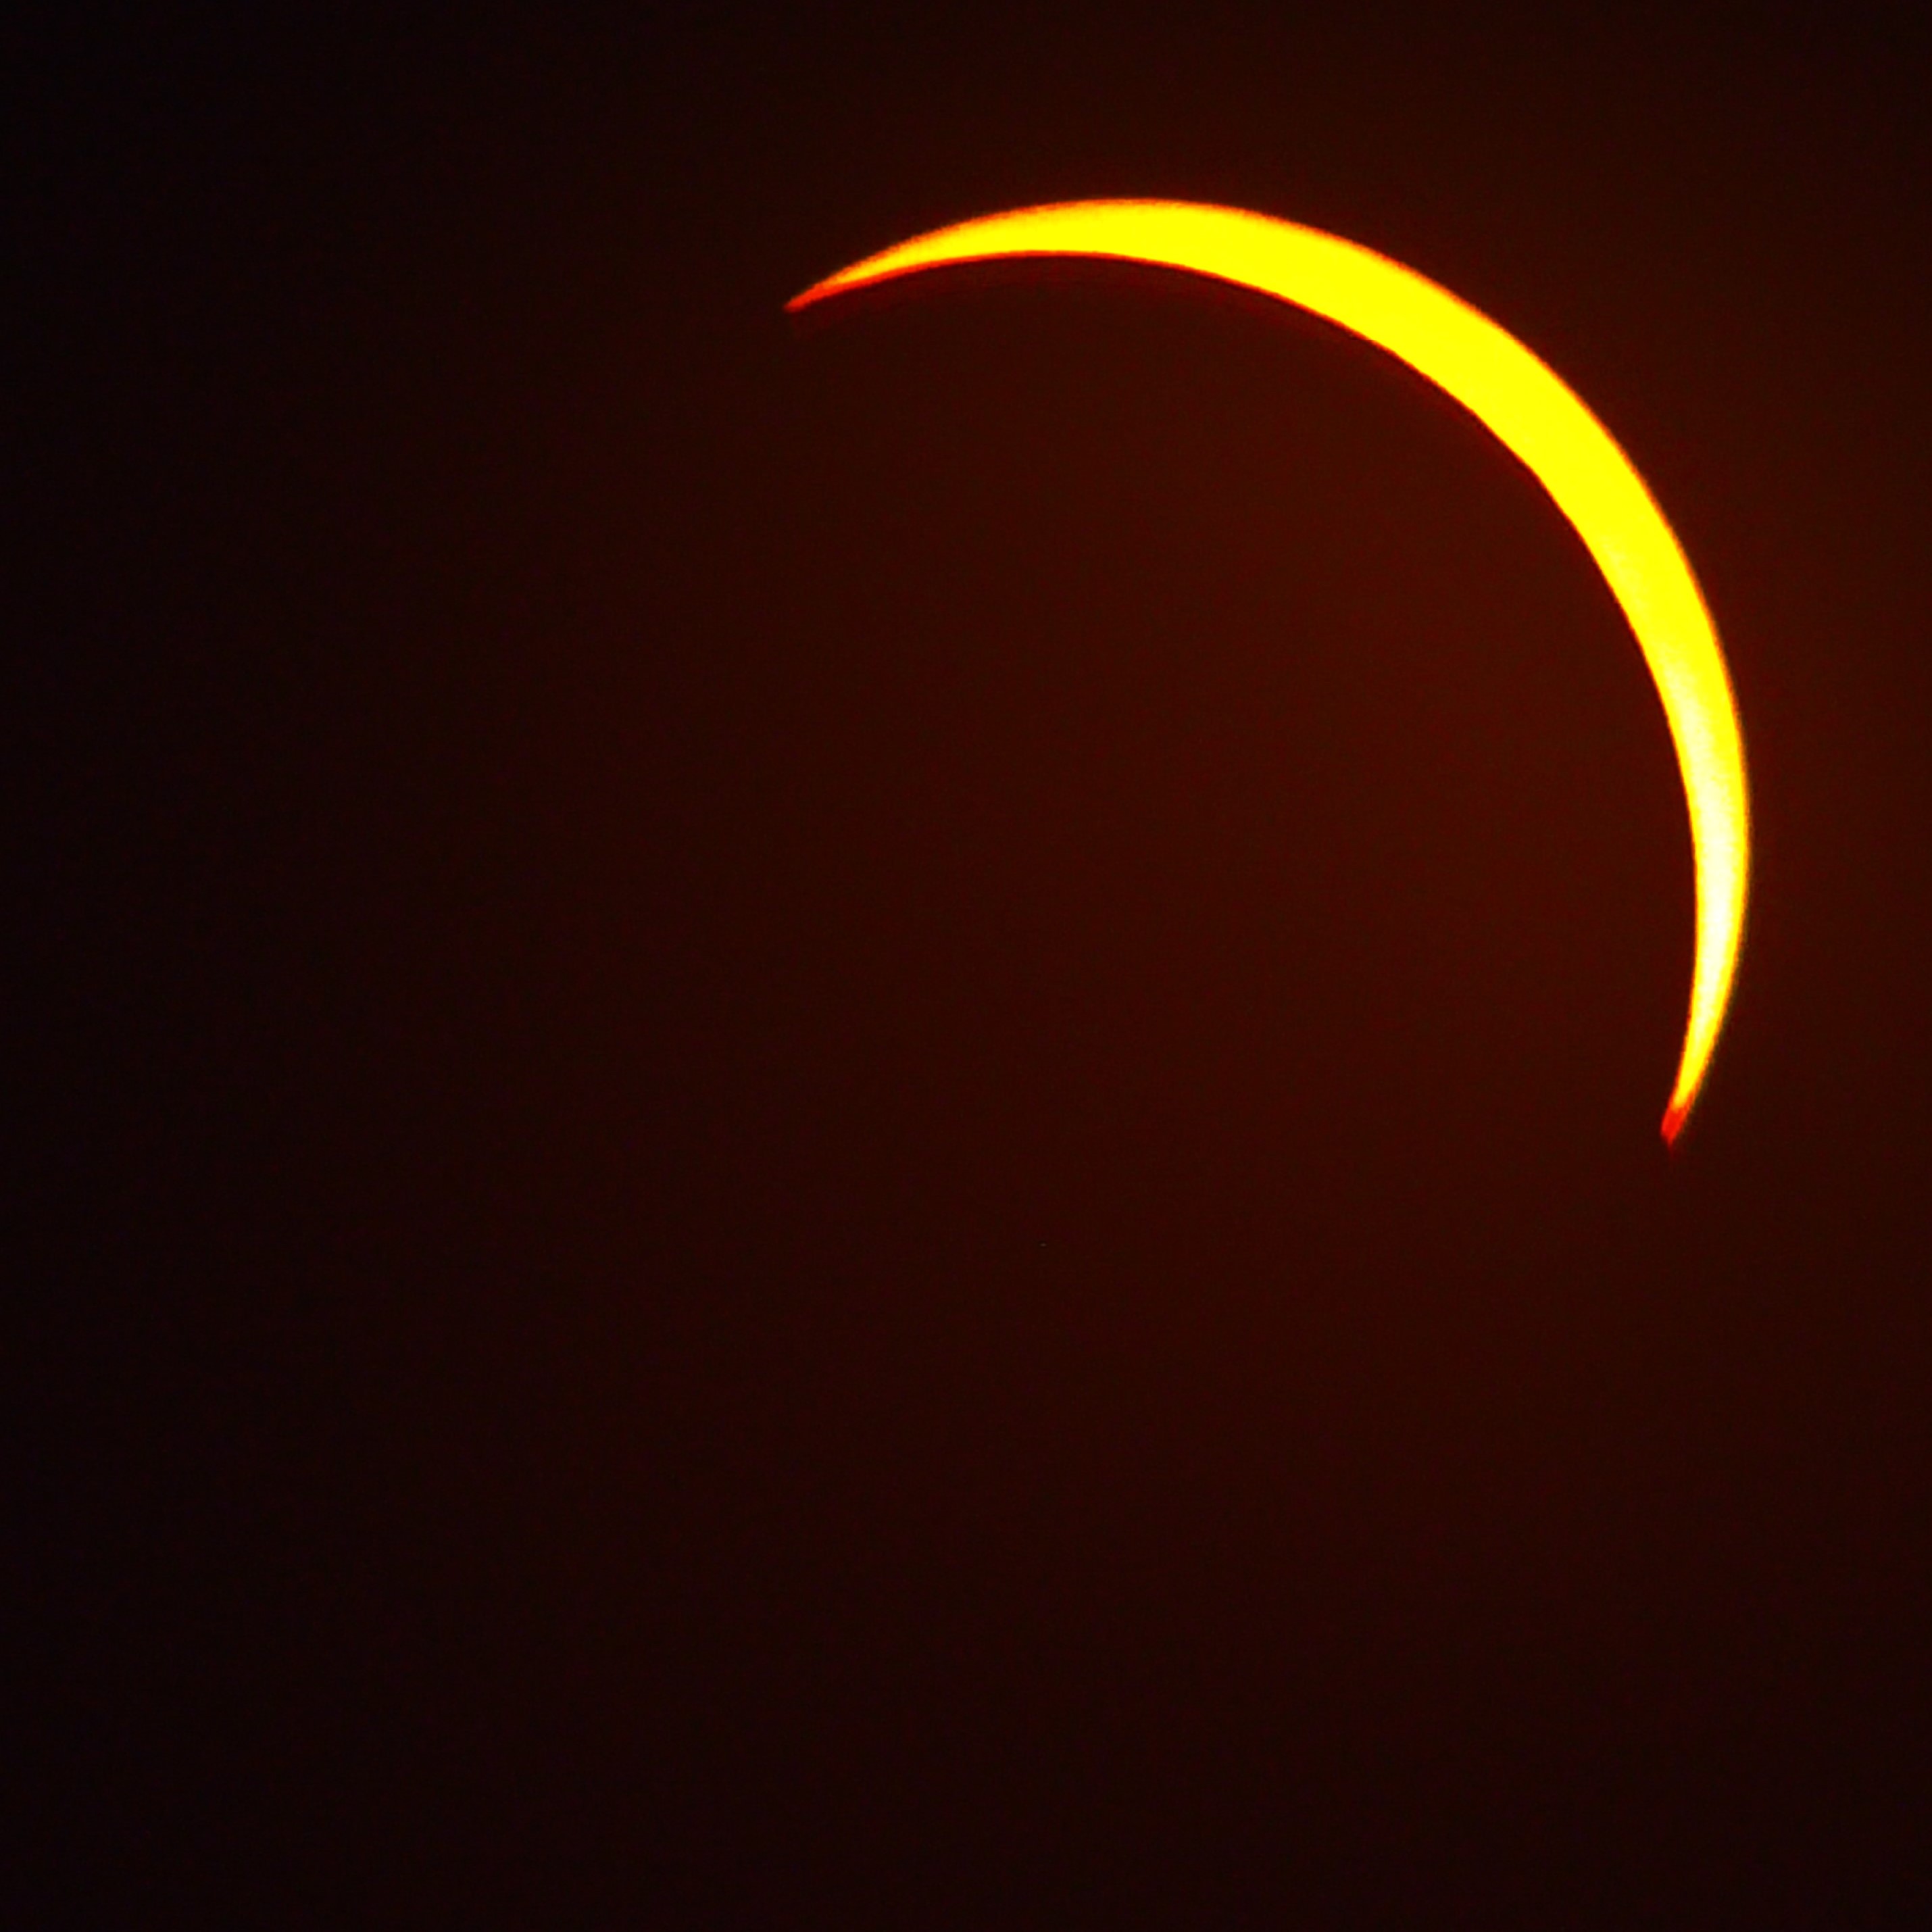
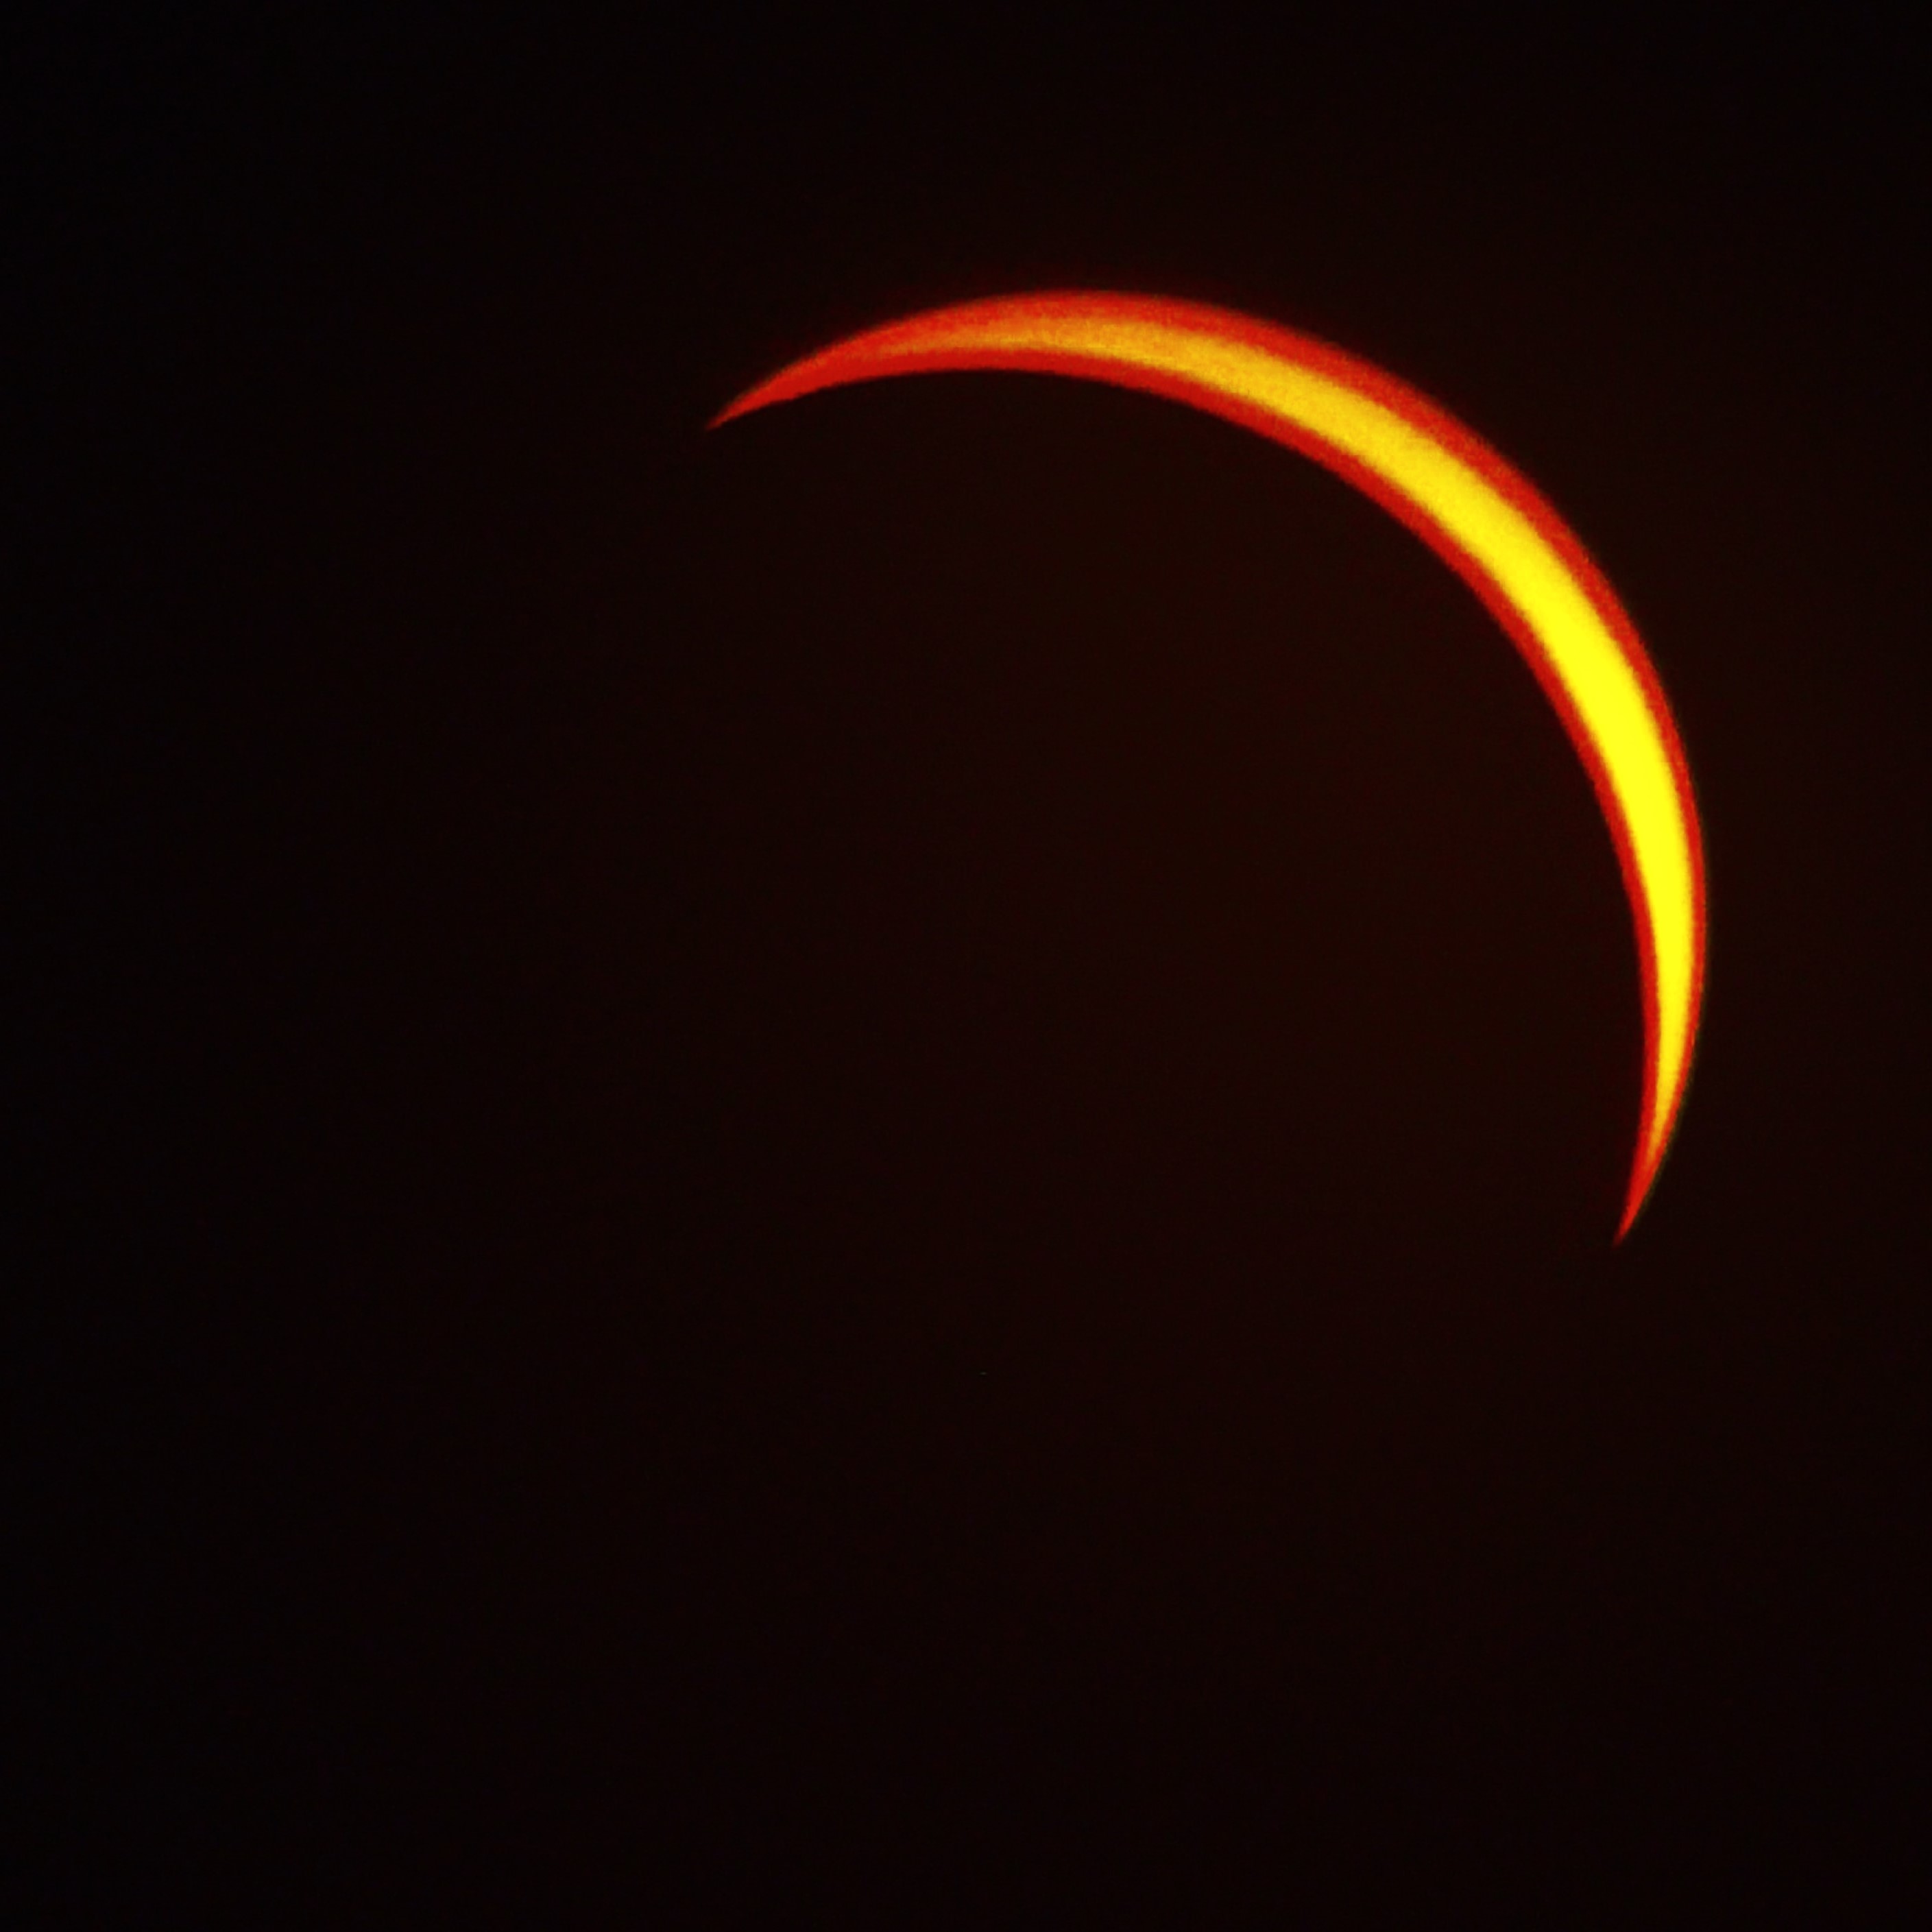
Thanks Steve, Re: Eclipse.....................
We didn't get the same view from SE Wisconsin......

Best wishes,
OAG
Thanks Jon.
It was truly impressive. And I saw the one in 2017 as well.
I was just better prepared this time.
Best quote of the day was from my typically cynical, little, 65 years old brother...
.
..."This is Kick-Ass!" 😆
Outstanding, Steve. Seriously.
Thanks for sharing.
Take care.
Jon
Eclipse pics taken from my front yard with my telescope...


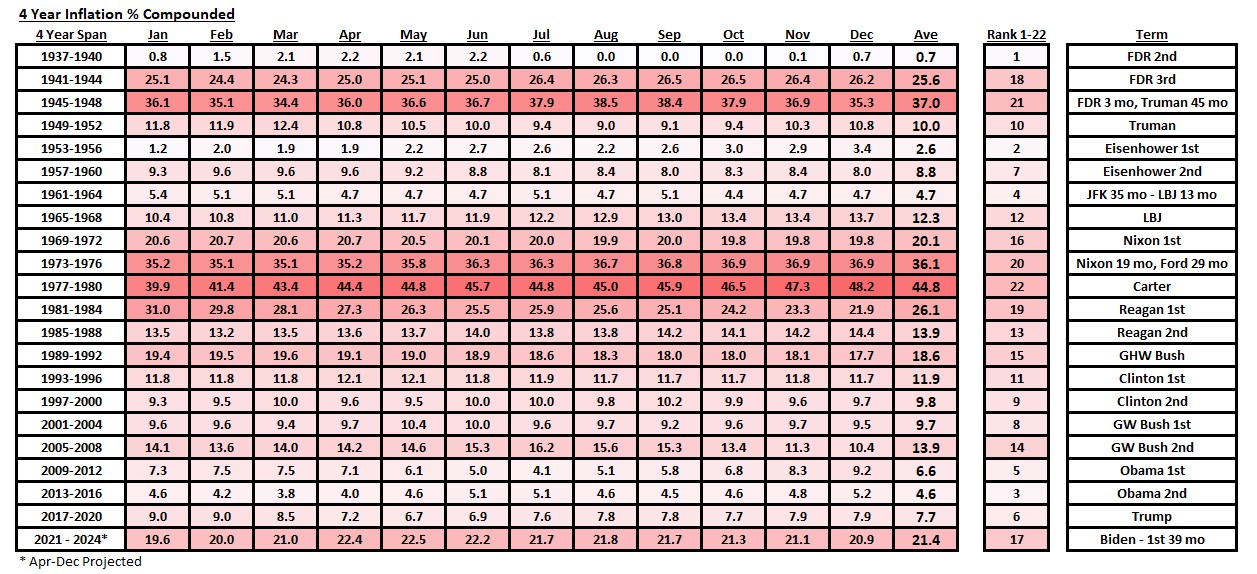
Updated Compound Inflation thru Mar, 2024 (Apr-Dec proj)...
Somebody spilled Red Ink all over my portfolio holdings today!!!
(not enough to generate any AIM trades, however)
OAG
Maybe next April 1st!!!
Still waiting on the surge!😂😂
Breaking News, UPI - AP
April 1, 2024
It has been learned that Apple and Samsung have been caught in collusion to boost Smart Phone sales nationwide.
With shrinking national sales of phones both companies combined their sales and marketing efforts to not only sell
more units, but to enhance their stock profitability.
Who would have thought Apple and Samsung would be so devious and ambitious as to create the situation that will
occur on April 8, 2024 at around 2PM Central Time. In a stunning work of technology they have arranged for the
Moon to temporarily block out all sunlight across a huge swath of the North American continent. Through shameless
promotion of the "Solar Eclipse" they've positioned themselves for optimum results.
All Smart Phone users who attempt to directly photograph the Event will most likely "fry" their built-in cameras. When
they realize their Smart Phones aren't as smart as before the Eclipse, they'll rush out to buy a new and fully functional
replacement.
Wall Street analysts expect shares of Apple's and Samsung's common stock to surge strongly about 5 minutes after
the 2PM Central Time event.
What an amazing marketing idea! How did they manage to arrange for the Solar Eclipse, anyway?
What will they try next?
Hi JDerb, Re: This week's v-Wave showing shorter term stress..................................
Seeing the 18 Month v-Wave moving well above the 3-5 Year assessment gives me a sense that the markets are ready for some shorter term consolidation.

Looking at how much better its estimate of the market's potential was back in 2022 and how far the indexes actually moved after that assessment should offer investors and AIMers alike some need for reflection. Market psychology doesn't favor traditional investors and traders who've now been conditioned by a long upward trend. AIMers should be checking to see if they've been following AIM's directions in boosting cash reserves at every opportunity.
I'd guess a year from now we'll be able to judge whether the current cautious outlook for the 18 Month forecast was again considered a 'good call.'
Best wishes,
OAG Tom
You are welcome, Steven. A lot of AIMERS like to use limit orders. But not everyone. 😎
Take care and welcome aboard.
Jon
v-WAVE 3.0*
Suggested Starting Cash Value For New AIM Accounts/Positions
Individual Stocks
High Risk: At or above 51%
Neutral: Between 37 and 50%
Low Risk: At or below 36%
Diversified Funds
High Risk: At or above 34%
Neutral: Between 25 and 33%
Low Risk: At or below 24%
_________________________
Week of April 12th
_________________________
Short Term (18 Months)
Individual Stocks: 77% (Up 2 from previous week)
Diversified Mutual Funds or Portfolio: 51% (Up 1 from previous week)
__________________________
Long Term (3-5 Years)
Individual Stocks: 49% (Unchanged from previous week)
Diversified Mutual Funds
or Portfolio: 33% (Unchanged from previous week)
Oscillator: 1.51 (Down .12 from previous week)
*See posts #44585 and #44588
Thanks Jon for the reply.
I've been doing that without knowing the offical terminology. Much appreciated.
Steven
Hi Darth..
From Investopedia:
A trailing stop is a modification of a typical stop order that can be set at a defined percentage or dollar amount away from a security's current market price. For a long position, an investor places a trailing stop loss below the current market price. For a short position, an investor places the trailing stop above the current market price.
Take care.
Jon
What do you mean by trailing stop? Not sure what that is. Did the price of GEO decrease signficantly?
Well GEO pulled back today and my trailing stop was hit.
Sold about 14% of my shares.
Toofuzzy
My account is no where near big enough to own that many foreign funds !
Heck, I don't even want to own that many domestic funds !
I just sent you a PM of how I was looking to pare down what I own.
Toofuzzy
I have my whole stock list on Yahoo.
I also put in a high and low limit which is my hold zone.
I also have individual portfolios on Yahoo for each account.
So I keep track of it as all one account and I decide which account I want to buy or sell in based on which account I either want more cash ( if selling ) or have the cash ( if buying ). I also want all sales to be long term in my taxable account.
I definitely have a preference as to which account I want to ultimately hold a specific security in based on if I want to sell options on it or not. I do all option trading in my tax sheltered account now.
If I really wanted to sell more shares than I had in an account I would sell it all off first and then sell a few in the other But as far as AIM is concerned it wouldn't matter.
What bugs me more is dealing with two different trade lots so if AIM says sell 80 shares but it is coming out of a 100 share buy lot, I may sell the 100 shares.
Each to their own. You can always just own a security in one account.
Hi Tom
The problem with the AAII survey for me is that it is based only on members who decide to give feedback.
It is not a sample.
It would be sort of like asking who are you going to vote for ? If one side is more rabid then the other, that will be the result you will get, meanwhile the actual election could be different if the more rabid side stayed home drunk and on drugs.
Toofuzzy
Hi Toof, Re: EFA volatility and AIMing....................
That's part of the reason I chose to divide up the ex US stock markets by different "styles" of ETFs.
Stock Funds
PIZ
EFG
SCHC
DGS
DOL
DIM
DLS
DEM
VNQI
Cash and Equivalents
MMF
SNVXX
The first three stock funds are mainly growth oriented. Overall it's given a good balance and reasonable return for the ex US markets. Allocations currently range from PIZ at 12.2% down to VNQI at 7%. Cash and equals add up to around 18% currently.
Best wishes,
OAG Tom
Hi Toof, Thanks for sharing. It's probably OK to split an AIM into two accounts, though it makes things a bit more complex. When I've done that I added two columns to my spreadsheet to keep track of the shares in each account. There's an issue if one account is much bigger than the other, then when you get a trade, say a sell, you have to sell a smaller number of shares from the small account and a larger number from the large account; otherwise the large sell will overwhelm the smaller account.
IMO it's best to avoid such splits as it makes the process more complicated and difficult. In a smaller account it's best to limit the number of stocks/ETFs and not share the AIM machine with a large account. The trades should be proportional to the size of the account and yet not be too small to keep the algorithm efficient.
Adam
Hi Jon, We're seeing the ST v-Wave showing stress while the longer term remains steady but well above Median.

I've been doing some work with the American Association of Individual Investors (AAII) "Allocations" database recently. It dates to around late 1987 and shows stock, bond and cash allocations monthly. Thinking back to Norman Fosback's work from years ago on cash allocations at Mutual Funds, I decided to see if there was a similar trend with individuals. Fosback had determined that cash allocations in mutual funds were the highest right at or near when the stock markets bottomed (most cautious) and were lowest at or near market tops (most aggressive). This is pretty much the mirror image of what AIM does so could be considered a very contrary market risk measure.
My preliminary study of AAII's allocations over the decades looks to follow a similar pattern. When individual investors are most optimistic they are lowest in cash allocation. This looks to occur near market tops. When the Big Bad Bear comes out to play, that's when the individual investor moves the cash allocation to the high end of its range. Again this could then be viewed as a contrary indicator - high cash = bullish signal, low cash = bearish signal. Here's a quick look at how this appears when looking at major bearish periods:
I do note that since around 2010 AAII's cash hoard has been smaller and less jumpy than in previous times. This might be because of a newer group of AAII members or a change in how quickly allocations can be changed since ETFs have become very popular. There could be other reasons, too.
In general, it seems to be that individual investors react badly during times of crisis by going heavily to Cash (usually too late). It also seems that they become complacent with their winnings during strong bullish periods and carry less "cash insurance." Mr. Lichello would just smile and shake his head! Of note is that the long average Cash Allocation is 22% and it's currently showing 16.8%, so on the LOW side. This would give us some contrary reason to be cautious, similar to our v-Wave's 18 Month current view.
Comments and Questions welcome!
OAG Tom
Placed a trailing stop for 14% of my GEO shares.
It will be nice to lighten up on this security.
Toofuzzy
|
Followers
|
310
|
Posters
|
|
|
Posts (Today)
|
0
|
Posts (Total)
|
47233
|
|
Created
|
01/29/02
|
Type
|
Free
|
| Moderator OldAIMGuy | |||
| Assistants The Grabber Toofuzzy | |||
Here's a handy "Quick AIM Calculator" for finding the next AIM directed Buy and Sell prices for your portfolio holdings:
A.I.M. Users Bulletin Board (AIMUSERS): Thanks LC, Now they can use the "calculator" again! (advfn.com)
While the AIM book is no longer being reprinted, it is available from Amazon for their Kindle for $5.99.
http://www.amazon.com/How-Make-Stock-Market-Automatically-ebook/dp/B002VKJ1EI/ref=sr_1_1?s=books&ie=UTF8&qid=1395757939&sr=1-1&keywords=lichello
Mr. Lichello wrote the book on AIM in 1977. In the mid-'80s he put an infomercial on AIM on late night TV and attempted to sell his workbook and audio tapes.
(1) How To Make $1Million In The Stockmarket Infomercial - 1985 - YouTube
It's a reasonable review of the AIM method for those who are unfamiliar.

Run A Successful Equity Warehouse
Welcome to the AIM Users Bulletin Board. This is the thread to post your thoughts, questions and comments on the use of Robert Lichello's Automatic Investment Management for handling the risk of being involved in the Equities markets.
The AIM strategy gives the user LIFO gains of 20% minimum if the method is followed "by the book." It is ideally suited to those seeking long term investment growth while managing the risk of being invested.
Thoughts on being a successful Individual Investor
I wrote this book review a long time ago. It's a trader's interpretation of
Sun Tzu's "Art Of War." I related it to AIM as best I could.
------------------------------------------------------------------------
Mr. Lundell says, "Today's financial markets are the last bastion of unabashed conflict.....
To participate, you must be your own general, devising a strategy, gathering information, executing your plan, and adapting to the situation."
How can we use AIM and the v-Wave for strategic and tactical planning to carry out Mr. Lundell’s requirements to participate in the Equity Markets?
"Be your own general"
You are in charge. You are responsible. When you win, you benefit. When you lose, only you are to blame.
a) Broad trends persist. Discover them. They will survive boom and bust.
b) Don't contemplate engaging in war while beholden to another. They could become your ruler!
To me this means "Stay away from Margin Buying unless you are certain of victory."
c) Establish and maintain a "Baseline of Survival" for your command.
This is the "income" side of my overall portfolio.
d) Know that reality is governed by Darwinism; Long Term Survival belongs to the fittest.
"Devise a Strategy"
Our strategy is to sell inventory into market strength and to buy into market weakness. Robert Lichello's AIM algorithm provides us with a systematic approach to follow that employs this strategy.
a) Sell quality merchandise to all those willing to pay.
b) Buy quality merchandise when the price offers reasonable hope to resell at a profit.
c) Let the allocation of resources and inventory be governed by the course of the market and AIM's guidance.
"Gather Information"
Today there is no excuse for not being informed.
a) Differentiate between information VOLUME and QUALITY.
b) Differentiate between FACTS and OPINION.
c) Find good sources of judgement where you cannot act as judge.
d) Information is trusted only when provided by those proved trustworthy.
"Adapt to the Situation at Hand"
The v-Wave measures general U.S. Market Risk (and may be sensitive to world market risk) from low to average to high. This helps you gauge the situation by:
a) Gauging your initial cash reserve requirements on new investments
b) Gauging your on-going cash reserve requirements on established investments
c) Judging whether to establish a bias for accumulation or distribution
d) Possibly starting no new AIM accounts when the v-Wave is showing High Risk
e) Possibly ignoring all AIM Buy Signals during v-Wave High Risk events.
f) Following all AIM buy and sell signals during v-Wave Average Risk events
g) Possibly ignoring all AIM Sell signals during v-Wave Low Risk events
h) Re-assessing your "Baseline For Survival" at times when AIM has your account heavily in Cash
i) Always attempting to beat measured inflation by 5 basis points minimum after all taxes and living expenses are paid. If you do this consistently, in good and bad markets, you will be winning long term
j) Possibly using "vealies" when your positions are cash rich relative to the v-Wave. Limiting supply helps to keep Momentum player’s Demand high.
"Execute your Plan"
Set the plan in motion; know that it takes time for realization. Follow the plan without hesitation allowing the goals to be realized. The strategy is sound so execution is all that is required.
a) Buy when the plan says
b) Sell when the plan says
c) Be very patient when no buy or sell signals are being generated
Reading Mr. Lundell's interpretation of Sun Tzu's work will help you focus on your own plan. It will arm you with knowledge of what others not using AIM are doing in the market. Understanding Short Term Trader's strategy and tactics is like having a spy in the enemy's camp. AIM users can profit by knowing just how these people think and act. AIM acts as almost a mirror image of what goes on in a trader's mind.
-------------------------------------------------------------------------------------------------------------
The v-Wave........
Mr. Lichello used fixed cash starting levels; first it was 50/50 then 67/33 and in the last edition of his book 80/20 for the Equity/Cash ratio. This "one size fits all" approach is like a broken watch that shows the correct time twice a day but is wrong the rest of the time!
Minstrlman, a regular contributor here, helped gather data from Value Line and formed a highly capable risk-cash indicator for our use. Since then, J Derb continued his work each week. As an adjunct to the AIM methodology we now have a Cash Indicator which helps guide our starting and ongoing Cash Reserve level of AIM relative to measured market risk. It can be used as a general market barometer or specifically with the AIM method. The v-Wave (or VW) is derived from the Value Line "Appreciation Potential - Next 3-5 Years" (VLAP) indicator shown weekly in their Summary and Index Section for their 1700 stock edition. Looking back through V/L's history we find the peak Appreciation Potential occurred 12/23/1974 at +234%. Our continuous database starts January of 1982 and we scaled our "zero cash" to the market risk low point of early that year. We take the VLAP and manipulate it to get an indication of how much cash should be reserved for diversified mutual fund AIM accounts. It should be multiplied by your stock or portfolio's BETA to get the cash reserve level of less diversified or more aggressive holdings.
v-Wave Weekly Cash Reserve Indicator For AIM Users
Current years of the v-Wave:
For diversified portfolios the Median value for the v-Wave is 29.5%. High Risk is 34% cash or higher for individual company stocks. Low Risk is 24% cash or lower.
To get a more proper cash level for individual company stocks multiply the current "Diversified" value by 1.5. This gives us 51% as the high risk threshold and 36% for the low risk boundary.
Looking at the cumulative risk of the v-Wave gives another perspective:
Cumulative v-Wave is calculated by taking each week's v-Wave Stock value, subtracting the median value from it and adding it to the previous total.
Significant historical events are shown nicely here and the v-Wave's response at those times.
v-Wave Calculations can be found at #30219. The data are a work-in-progress for now.
TooFuzzy provided us with a handy "Quick AIM Calculator" Here's a link to that page:
A.I.M. Users Bulletin Board (AIMUSERS): Thanks LC, Now they can use the "calculator" again! (advfn.com)
(follow the link on the above page)
AIM has a predictable pattern of "cash burn" in a declining market. Depending upon the SAFE settings AIM will generate new buy orders sequentially as share prices decline. It can be helpful to know in advance about how deeply AIM is going to draw down one's cash reserves. This link is to the "Cash Burn" AIM page. It shows various end points based upon the starting cash reserve level. Here's a link to that page:
"" rel="nofollow noopener noreferrer ugc" target="_blank">http://www.aim-users.com/cashburn.htm"; rel="nofollow noopener noreferrer ugc">A.I.M. Cash Burn Rate (archive.org)
Best wishes,
Old AIM Guy
|
Posts Today
|
0
|
|
Posts (Total)
|
47233
|
|
Posters
|
|
|
Moderator
|
|
|
Assistants
|
| Volume | |
| Day Range: | |
| Bid Price | |
| Ask Price | |
| Last Trade Time: |


