Hi Jon, We're seeing the ST v-Wave showing stress while the longer term remains steady but well above Median.
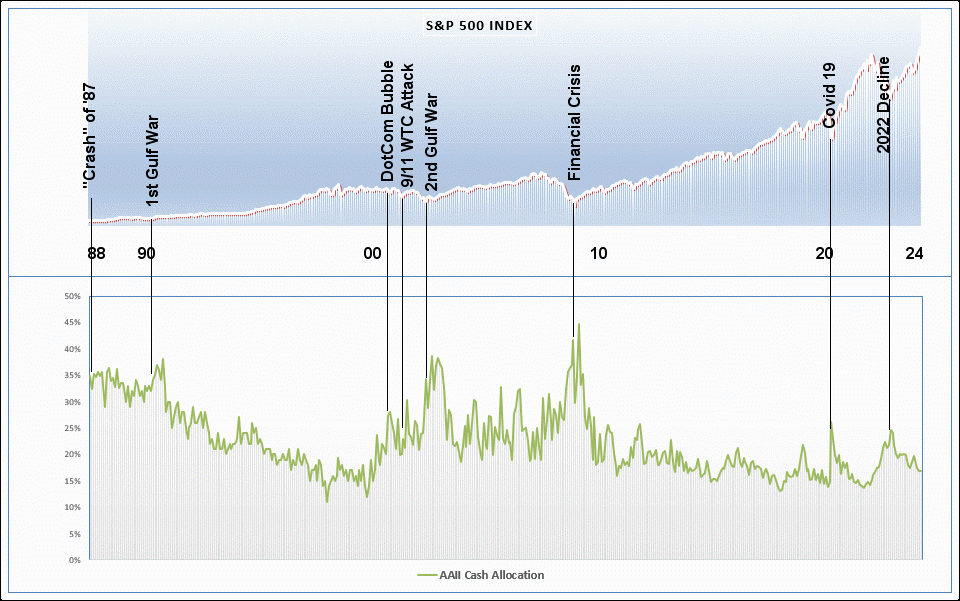
I've been doing some work with the American Association of Individual Investors (AAII) "Allocations" database recently. It dates to around late 1987 and shows stock, bond and cash allocations monthly. Thinking back to Norman Fosback's work from years ago on cash allocations at Mutual Funds, I decided to see if there was a similar trend with individuals. Fosback had determined that cash allocations in mutual funds were the highest right at or near when the stock markets bottomed (most cautious) and were lowest at or near market tops (most aggressive). This is pretty much the mirror image of what AIM does so could be considered a very contrary market risk measure.
My preliminary study of AAII's allocations over the decades looks to follow a similar pattern. When individual investors are most optimistic they are lowest in cash allocation. This looks to occur near market tops. When the Big Bad Bear comes out to play, that's when the individual investor moves the cash allocation to the high end of its range. Again this could then be viewed as a contrary indicator - high cash = bullish signal, low cash = bearish signal. Here's a quick look at how this appears when looking at major bearish periods:
I do note that since around 2010 AAII's cash hoard has been smaller and less jumpy than in previous times. This might be because of a newer group of AAII members or a change in how quickly allocations can be changed since ETFs have become very popular. There could be other reasons, too.
In general, it seems to be that individual investors react badly during times of crisis by going heavily to Cash (usually too late). It also seems that they become complacent with their winnings during strong bullish periods and carry less "cash insurance." Mr. Lichello would just smile and shake his head! Of note is that the long average Cash Allocation is 22% and it's currently showing 16.8%, so on the LOW side. This would give us some contrary reason to be cautious, similar to our v-Wave's 18 Month current view.
Register for free to join our community of investors and share your ideas. You will also get access to streaming quotes, interactive charts, trades, portfolio, live options flow and more tools.
 News
News  Market Data
  Discover