


| Followers | 679 |
| Posts | 140863 |
| Boards Moderated | 36 |
| Alias Born | 03/10/2004 |
Saturday, August 19, 2017 9:38:54 AM
CoT: Peek Into Future Through Futures – How Hedge Funds Are Positioned
By Hedgopia | August 19, 2017
Following futures positions of non-commercials are as of Aug 15, 2017.
E-mini S&P 500: Currently net long 150.2k, up 73.2k.
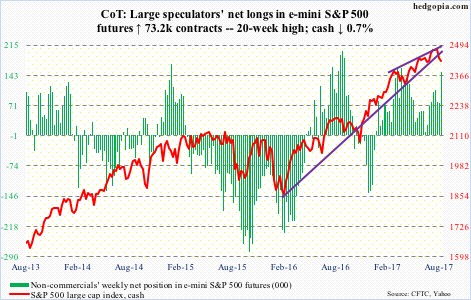
Right on cue, bears showed up near resistance on the cash. The brief relief rally early this week was used as an opportunity to short/sell.
In fact, by Wednesday the S&P 500 rallied to 2474.93 intraday, past resistance at 2463. But there was no conviction behind the move as that session itself ended in a long-legged doji. Thursday, the index dropped 1.5 percent, slicing through the 50-day.
Support at 2400 goes back six months. It was last tested early July. The bulls cannot afford to lose it, and they will need flows to cooperate.
In the week through Wednesday, that was not the case. SPY (SPDR S&P 500 ETF), VOO (Vanguard S&P 500 ETF) and IVV (iShares core S&P 500 ETF) all saw redemptions – $292 million, $907 million and $24 million, respectively.
In the same week, U.S.-based equity funds lost another $5.9 billion – $12.8 billion in the last five (courtesy of Lipper).
Nasdaq 100 index (mini): Currently net long 47.2k, up 4.2k.
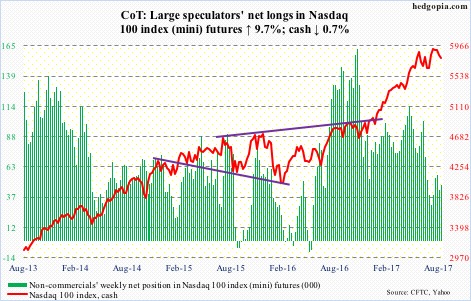
Since July 27, when the cash (5790.91) rallied to a new high 5995.77 but only to see it reverse in a bearish engulfing session, the Nasdaq 100 has made lower highs, including a long-legged doji session Wednesday. Thursday, the bulls were punished for a 2.1-percent drop, losing – for the second time in six sessions – the 50-day.
The tech-heavy index has led this year. The problem is that the leading names such as Apple (AAPL), Microsoft (MSFT), Alphabet (GOOGL), Amazon (AMZN) and Facebook (FB) are primarily responsible for the move.
A ratio between QQEW (First Trust Nasdaq 100 equal-weighted index) and QQQ (PowerShares QQQ trust) is at a 17-year low. Underneath the surface, there is weakness.
Near-term, there is support at 5570, and after that 5450. The latter in particular is important.
In the week through Wednesday, QQQ (PowerShares Nasdaq 100 ETF) took in another $130 million. This followed inflows of $300 million in the prior week (courtesy of ETF.com).
Russell 2000 mini-index: Currently net short 79.6k, up 30k.
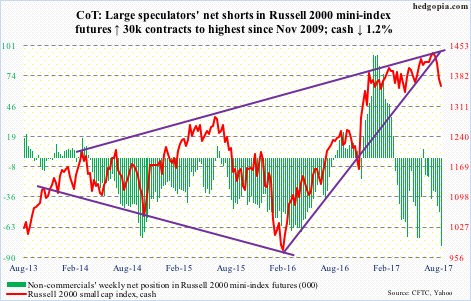
Merely four sessions after successfully testing the 200-day, the cash (1357.79) lost the average Thursday. This was the first time the Russell 2000 traded below the average since June last year.
The index has lost a rising trend line from February last year, as well as dropped out of a rising wedge going back several years.
With this, the Russell 2000 is now back into a months-long rectangle between 1340s and 1390s.
In fact, after last week’s decline, it opened the week with a 1.5-percent rally on Monday. Tuesday, bears showed up at 1396. The good thing for the bulls is that in a long-legged doji session Friday they were able to defend the lower bound. The 200-day at 1375.27 is the nearest hurdle.
In the week to Wednesday, IWM (iShares Russell 2000 ETF) lost $626 million. This followed inflows of $2.6 billion in the prior two (courtesy of ETF.com).
US Dollar Index: Currently net short 2.1k, down 560.
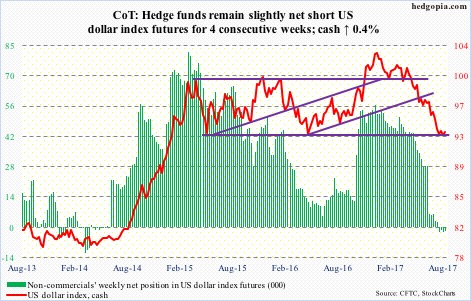
Since it dropped to 92.39 on August 2, the cash (93.36) has printed higher lows. Support at 92 goes back to at least 1998.
That said, dollar bulls have been unable to take out near-term resistance at 93.65. On Tuesday-Thursday, the US dollar index rallied to 94 or higher intraday only to give back all or most of the gains.
As a result, since the afore-mentioned low, the index has been caught in what looks like a bear flag, with the daily chart a little extended.
Non-commercials continue to show disinterest.
The index remains in damage repair mode so long as the August 2nd low is not violated.
VIX: Currently net short 129.4k, down 25.6k.
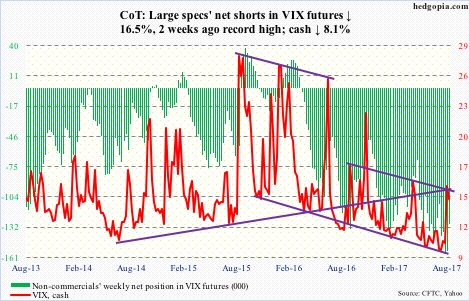
Volatility bulls defended the 200-day (11.92) on the cash.
VIX (14.26) started the week at 15.51, dropped to 11.25 by Wednesday before rallying to 15.55 on Thursday. Volatile!
Even after the recent jump in VIX, the volatility curve – VXST (nine days), VIX (30 days), VXV (90 days) and VXMT (six months) – is still in contango, with the spread between VXST and VXMT -3.21 points.
Several times in the past, a tradable bottom in stocks came about after the curve dropped into backwardation where VXST was five to seven points wider than VXMT.
That said, near term it is possible VIX goes on to once again test the 200-day.
https://hedgopia.com/cot-peek-into-future-through-futures-how-hedge-funds-are-positioned-14/
• DiscoverGold
Click on "In reply to", for Authors past commentaries
Information posted to this board is not meant to suggest any specific action, but to point out the technical signs that can help our readers make their own specific decisions. Your Due Dilegence is a must!
• DiscoverGold
Join the InvestorsHub Community
Register for free to join our community of investors and share your ideas. You will also get access to streaming quotes, interactive charts, trades, portfolio, live options flow and more tools.

