CoT: Peek Into Future Through Futures – How Hedge Funds Are Positioned By Hedgopia | August 12, 2017
Following futures positions of non-commercials are as of Aug 8, 2017.
E-mini S&P 500:Currently net long 77k, down 2.6k.
An extended market used Kim Jong-un as an excuse to unwind overbought conditions.
Thursday’s 1.5-percent drop on the cash (2441.32) pushed it below the 50-day; 2463 is the new resistance. The all-time high of 2490.87 on August 8 has the makings of a major top. We will see.
Down below, there is decent support at just north of 2400. Near term, should the price get there, it likely holds, duration and extent notwithstanding. The daily chart is getting oversold.
Remains to be seen if flows cooperate. In the week ended Wednesday, SPY (SPDR S&P 500 ETF) lost $500 million. But this was offset by inflows into VOO (Vanguard S&P 500 ETF) and IVV (iShares core S&P 500 ETF) – $282 million and $125 million, respectively (courtesy of ETF.com).
In the same week, U.S.-based equity funds lost another $2.8 billion – $6.9 billion in the last four (courtesy of Lipper).
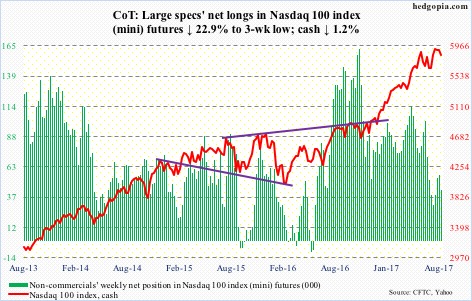
Nasdaq 100 index (mini):Currently net long 43k, down 12.8k.
Like the S&P 500, the cash (5831.53) lost the 50-day on Thursday. But unlike the S&P 500, the Nasdaq recaptured the average in the very next session.
Be that as it may, the Nasdaq 100 failed to make a new high on August 8. The all-time high of 5995.77 on July 27 stands, and that was a huge bearish engulfing session.
Both weekly and monthly indicators are turning down. This is an opportunity for the bears, and they are positioned.
Short interest on XLK (SPDR technology ETF) and the Nasdaq composite remains high. In due course, this in and of itself can contribute to creating a floor, as short-covering takes place.
Near-term, there is support at 5570, and after that 5450.
In the week through Wednesday, QQQ (PowerShares Nasdaq 100 ETF) took in $300 million. This followed outflows of $3.5 billion in the prior two (courtesy of ETF.com).
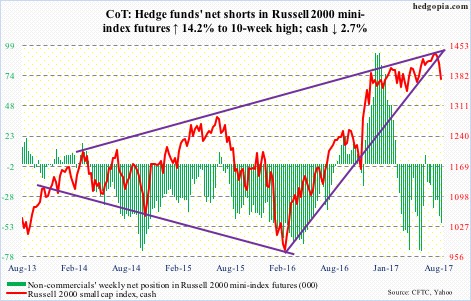
Russell 2000 mini-index:Currently net short 49.6k, up 6.2k.
July was a spinning top on the cash. Last week, the Russell 2000 lost a rising trend line from February last year. This preceded failed breakout attempts throughout this year at a three-year-old rising wedge.
This week, the index fell apart, losing the 50-day and dropping back into a months-long rectangle between 1340s and 1390s.
Friday, it tested the 200-day, and it held. There is room for a relief rally near term.
In the week to Wednesday, IWM (iShares Russell 2000 ETF) attracted another $484 million – following inflows of $2.1 billion in the prior week – but these longs are now under water (courtesy of ETF.com).
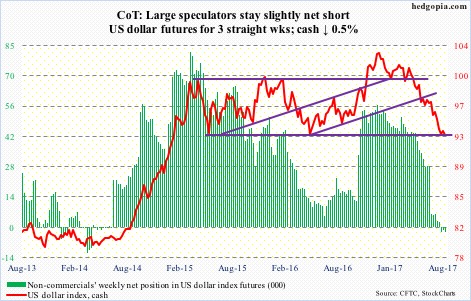
US Dollar Index:Currently net short 2.7k, up 1.1k.
The cash (92.96) continues to struggle to hammer out a bottom. This week’s geopolitical developments and the resultant inflows into “safe-haven” Japanese yen notwithstanding, the US dollar index remains in damage-repair mode as long as the August 2nd low of 92.39 holds.
Support at 92-plus goes back to at least 1998.
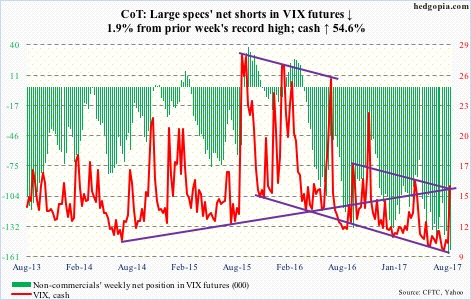
VIX:Currently net short 155k, down 3.1k.
Stretched rubber bands are packed with energy. We saw this unfold in the cash this week. From an all-time low 8.84 on July 26 to 17.28 on August 11 – doubled in 13 sessions.
Leading up to this, as of July-end, volatility bears had built record short interest in VXX (iPath S&P 500 VIX short-term futures ETN). And non-commercials last week had record net shorts in VIX futures.
Volatility this week likely benefited from short squeeze. VIX (15.51) is past both 50- and 200-day, with both slightly turning up.
Near term, though, the daily chart is looking extended, and VIX could be headed lower. Intraday Friday, the VIX-to-VXV ratio jumped to 1.03 – into overbought territory – before backing off.
Click on "In reply to", for Authors past commentaries
Information posted to this board is not meant to suggest any specific action, but to point out the technical signs that can help our readers make their own specific decisions. Your Due Dilegence is a must! • DiscoverGold
Register for free to join our community of investors and share your ideas. You will also get access to streaming quotes, interactive charts, trades, portfolio, live options flow and more tools.


 News
News  Market Data
  Discover