


Tuesday, June 06, 2017 4:47:16 PM
It looks like there's still some upside left, or at least little near-term likelihood of downside. Volume increase has decelerated two consecutive days and is the primary indication that the move higher may be running out of steam. But it's still rising volume on an up day so the nearest-term outlook is still positive.
It's just that now we have to keep a watch out as signs of weakness are likely to begin appearing.
What a nice day! Open low, drop only a little by 10:20ish, start a slow flattish rising trend that had price 2 cents above the open by 11:08, flattish $0.66ish to $0.67ish through ~13:15 and then the rest of the day $0.66/8 and slightly above to close the day at $0.67.
There were no pre-market trades.
B/a just before open was 200:3.3K $0.62/6.
09:30-10:10 opened the day with a 2,080 buy for $0.66 & $0.66 x 27, x 25, x 8, $0.65 x 2.6K. B/a just after open was 2.5K:10.9K $0.64/6. Then came 9:32's b/a 3.5K:10.9K $0.64/6, 9:37's 400 $0.6593/$0.66, 9:38's 424 $0.66, 9:47's b/a 3.6K:10.3K $0.64/6, 9:50's 11.2K $0.66, 9:54's b/a 4.1K:3.6K $0.6450/$0.66, 10:02's b/a 4.1K:3.7K $0.6450/$0.66, and the period ended on 10:10's 100 $0.6525.
10:11-10:47 during the initial fourteen no-trades minutes had b/a at 10:20 of 4.9K:3.7K $0.6450/$0.66. Trade began variable-volume, but mostly extremely low/no-volume and some usual early high-volume minute interruptions, $0.645/$0.66 on 10:25's 3.8K $0.6525 (4.4K)/50. B/a at 10:33 was 4K:400 $0.6451/$0.6550, 10:47 3K:1.3K $0.6450/$0.66. The period ended on 10:47's 17.1K $0.65 (13.7K)/$0.66 (1K)/$0.65 (700)/$0.6451 (600)/$0.65 (1.1K).
10:48-11:23 began a mostly extremely low/no-volume climb on the interspersed high-volume minutes after 10:48's 100 $0.6525. 10:59-11:00's 12.7K did $0.6509/57/10 (OHC) and $0.6590/11/$0.66/99 (OLHC). B/a at 10:58 was 2.3K:1.4K $0.6511/$0.66. 11.07's 9.8K did $0.6566/$0.67/$0.66 (OHC). B/a at 11:17 was 1.2K:2.3K $0.6531/$0.67. The period ended on 11:23's 200 $0.67.
11:24-12:11 began extremely low/no-volume +0.6532 on 11:24's 100 $0.6532. Pecking the bids 100/200 shares a minute $0.6532 occurred through 11:40, 11:41 did 4.7K $0.6532, and pecking the new $0.6530 bid resumed through 11:58. B/a at 11:28 was 1.2K:1.9K $0.6532/$0.67, 11:47 2.2K:1.9K $0.6530/$0.67. 11:59 interrupted the pecking, doing 300 $0.6530/$0.6615 (OH). 12:01 resumed pecking the $0.6530 bids with 11/200 share minutes through 12:09. B/a at 12:02 was 3K:1.9K $0.6530/$0.67. The period ended on 12:10's 2.1K $0.67 (1.4K)/$0.6530/$0.6647 (600) and 12:11's 100 $0.6530.
12:12-13:19 began $0.65/$0.6691, with rising highs, doing mostly very low volume but a fair number of infrequent high-volume one-minute spikes through 12:33. This all began on 12:11's 100 $0.6530. B/a at 12:17 was 9K:2.2K $0.65/$0.6698. Highs began to weaken at 12:33. B/a at 12:34 was 12.1K:2.1K $0.6500/$0.6698, 12:48 2.7K:3.1K $0.6508/66 (bids rising), 13:02 2.1K:1.1K $0.6529/$0.6650, 13:17 1.2K:1.1K $0.6560/$0.6650. The period ended on 13:19's 200 $0.656.
13:20-15:59 stepped up on 13:20's 9.9K $0.6604/05/06/04/49/48/05/50 (1.1K)/98 (3.1K)/97/$0.67 (1.8K)/$0.68. Trade began very low/medium-volume $0.6694/$0.6788, with falling range. B/a at 13:32 was 4K:275 $0.67/8, 13:48 4.1K:100 $0.66/$0.6789. At 13:51 range was $0.66/$0.6744. Volume switched to extremely low/no-volume. B/a at 14:02 was 4.2K:100 $0.66/$0.6789. 14:07-14:38 was just pecking bids with 100/200 share minutes $0.66 only. B/a at 14:18 was 4.4K:100 $0.66/$0.6789, 14:34 4.5K:100 $0.66/$0.6789. 14:39's 1.6K interrupted price doing $0.6600/94/$0.67 (1K)/$0.6789 (400) and that opened range back up to $0.66/0.67.89. B/a at 14:43 was 200:100 $0.66/$0.6789, 14:54 400:100 $0.66/$0.6789, 15:02 1K:100 $0.66/$0.6789, 15:17 3.4K:1.6K $0.66/8, 15:32 3.4K:1.6K $0.66/8, 15:47 3.4K:2.1K $0.66/8,
There were no AH trades.
Excluding the opening and closing trades (didn't qualify), there were 12 larger trades (>=5K & 7 4K+) totaling 84,637, 31.41% of day's volume, with a $0.6555 VWAP. For the volume, the count seems reasonable and the percentage of day's volume seems normal too. The VWAP is below the day's $0.6584. With the buy percentage (see below) weakening and settling in "no man's land", my guess would be that most of the larger volume was MMs and/or shorters sitting on the bid doing covering buys. It could be larger retail or institutional investors but the day's volume, as well as the larger trades volume, seem a bit low for that to be the case.
The movements in VWAP and buy percentage were disconnected today. This suggests that bids were holding up pretty well throughout most of the day because the reducing buy percentage implies a rising sell percentage but the VWAP did not drop. This adds support to MMs/shorters taking most of the larger trades as these two players will do a lot of sitting on the bids, for various reasons detailed in the past.Ending Period Period Period __Per. Trade_ Period_ % Day_ Per. End
Period Volume Low High _Dollar Val._ VWAP___ Volume Buy ~%
10:10 16733 $0.6500 $0.6600 $11,015.89 $0.6583 6.21% 82.78% Incl 09:50 $0.6600 4,837 4,000
10:47 86113 $0.6450 $0.6600 $56,075.64 $0.6512 31.96% 57.08% Incl 10:32 $0.6550 14,000 10:41 $0.6500 14,000
10:46 $0.6500 4,300 10:47 13,700
11:23 30858 $0.6500 $0.6700 $20,329.15 $0.6588 11.45% 57.27% Incl 10:59 $0.6557 4,000 11:00 $0.6590 4,000
12:11 14900 $0.6530 $0.6700 $9,762.90 $0.6552 5.53% 52.85%
13:19 51910 $0.6500 $0.6698 $34,160.30 $0.6581 19.27% 49.50% Incl 12:28 $0.6625 8,500 13:05 $0.6560 4,300
13:16 $0.6650 5,000
15:59 67550 $0.6600 $0.6800 $45,148.61 $0.6684 25.07% 45.27% Incl 14:36 $0.6600 4,000
The spreads seen in the periods, especially later in the day, suggests this situation as well. Usually only retails will come up to hit the offers when the gap is so wide and the lowered buy percentages suggests they were loathe to do this.
On the traditional TA front, movements were:
This is the fourth day of generally improved metrics and two consecutive strongly positive days suggests there may be some more leg left in the up. The rate of volume rise declined for the second consecutive day though so it may be a short leg left. This seems especially likely considering the VWAP and buy percentage movements above.__Open_ ___Low_ __High_ _Close_ Volume_
Today 7.32% 5.39% 3.85% 3.08% 13.01%
Prior 0.82% 0.33% -0.79% 4.84% 23.68%
On my minimal chart the most significant thing is price challenged the descending channel's (descending blue lines) resistance and was rejected. Assuming the constructed channel is valid, this suggests a leg down could begin. But it was the first day of challenge and another challenge could be mounted immediately. The challenge would explain the falling volume on the up day as uncertainty about whether the line would hold, along with likely profit taking, would cause additional selling and reduce buying, seen in the breakdown above.
At last price ceased bottoming at $0.61 and pushing the experimental 13-period Bollinger band lower limit.
The close was again well above the rising fast EMA's $0.6519 (was $0.6349) and the slow EMA's $0.6476 (was $0.6443) readings. The close was above the open. Price was completely above, and far above, the short-term descending channel (descending blue lines) bottom line, ~$0.61.
The fast EMA crossed above the slow, marginally. The readings for the slow and fast are $0.6519 and $0.6476 and both are rising.
The volume bars continued making the desired "cupping" pattern, but as noted above, the rate of volume rise is slowing. This may be nothing more than natural hesitancy when challenging a a resistance though. We'll have to wait and see if we see volume come in and push us through the resistance.
On my one-year chart, for the fifteenth consecutive day we did not trade completely below all SMAs, all of which, but for the 10-day SMA, are still falling and still all in order: 10 < 20 < 50 < 200. For the first day we traded completely above the 10-day SMA and barely penetrated the 20-day with the low, trading completely above it otherwise.
Yesterday the oscillators I watch had weakening in ADX-related and improvement in every other oscillator. RSI is at neutral and momentum is slightly above neutral. Below neutral were MFI (untrusted by me), Williams %R and full stochastic (out of oversold).
Today had improvement in every oscillator. Above neutral are RSI, momentum, Williams %R (entered overbought), full stochastic, Below neutral are accumulation/distribution, MFI (untrusted by me) and ADX-related.
The experimental 13-period Bollinger limits, $0.6078 and $0.6732 ($0.6095 and $0.6700 yesterday), went from yesterday's flat to diverging with falling lower limit and faster-rising upper limit, yielding a rising mid-point.
All in, the only negatives here are the rate of volume rise decreasing for the second day and the intra-day breakdown's declining buy percentages ending in "no-man's land". That latter ending value doesn't assure near-term weakness though - it just says it's not giving us a clue other than uncertainty in folks not leaning either negative or positive by much.
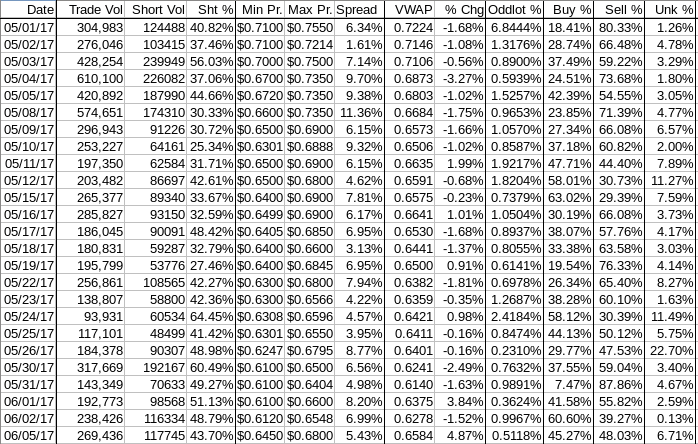
Percentages for daily short sales and buys moved in the same direction, down, and the short percentage is just below my desired range's upper limit (needs re-check) while buy percentage went to "no-man's land", offering neither positive nor negative indications,
The spread narrowed and is still wide enough to suggest some movement likely, but not strongly suggestive.
VWAP was up almost 5%, quite a good result.
The VWAP's rolling average of the last twenty-four movements, after holding steady for three days at an abysmal 19 negatives and 5 positives, improved to 18 and 6 respectively. Change since 05/01 is -$0.0640, -8.86%, and the averages of the rolling 24-day period seen in the last few days (latest first) are now -0.3689%, -0.6415%, -0.7567%, -0.8905%, -0.7494%, -0.6808%, -0.6688%, -0.7140%, -0.8520%, and -0.8128%.
Note the rolling averages have begun a trend of improvement.
All in, this stuff looks pretty reasonable and would offer no cause for me to project near-term weakness. However, be aware of the buy percentage in "no-man's land", which does suggest the strong bullishness has dissipated, at least for today, and we may see signs of weakening appear shortly.
A cautionary tale, so to speak.
Bill
Join the InvestorsHub Community
Register for free to join our community of investors and share your ideas. You will also get access to streaming quotes, interactive charts, trades, portfolio, live options flow and more tools.

