


Friday, May 27, 2016 9:15:38 AM
Today I have to waffle because there's conflicting suggestions from various facets of what I examine and try to evaluate. I hold neutral with little movement expected but consider that Friday's are often low-volume with opportunities for (manipulated or not) price moves. Being a long weekend adds to the uncertainty.
Considering the apparent strong support at $1.53, on both the charts and seen in the bids b/a buy imbalance seen intra-day, I can't see a big move lower in the cards.
So in aggregate I'm neutral on today with allowance that the environment is ideal for holding price high(er) to support CPSTS's use of the ATM and/or selling by financiers.
Envision the action today as a very low volume upside-down teacup with the bowl left lip at 9:34's $1.54 rising to the peak (bottom of the cup) $1.60 at 9:52, the bottom 9:53-10:33's $1.57/9 (a bit ragged on the low though), and that dropped to the right lip at 11:04's $1.54/5. The ear is on the right 11:05-:27's $1.53/5 and is followed by a very long tea tray - 11:28-15:57's $1.53/4. The last three minutes produced the normal EOD volatility, but on very low volume, and we closed flat on the day.
My intra-day thoughts included MMs sitting on the bid (because the b:a quantities were so far out of kilter for so long - see below) to accumulate a bit for the next bump up which they will cause, MMs doing covering buys at attractive prices (yesterday's VWAP was $1.5474 and the prior day was $1.6206), and MMs seeing little-to-no buying or selling interest just decided to make money the old fashioned way, "providing liquidity".
For those that forgot, that's when they sit on the bid or ask and let others hit their bids or offers, for which the exchanges pay then a fee on each transaction. If the MM hits a bid or offer, "taking liquidity", they are charged a fee on each transaction!. For their offers that get hit, keep in mind the MMs are exempt from the REG SHO "naked short rules" and it's one of the primary ways they make money - naked short, which helps suppress price, and the cover at the lower price.
IOW, "Sell high and then buy low" instead of "Buy low and then sell high" as us mere mortals must do.
There were no pre-market trades.
09:30-09:52 opened the day on a 1,221 sell for $1.55 along with another 1.6K at that price. Then came a steady mostly low/no-volume rise, with higher volumes making some of the steps up. This began on 9:33's 196 $1.5480, 9:34's ~6.4K $1.54/5 (intra-day low $1.54), 9:37/-:38's ~2K $1.56, 9:42's 100 $1.57, 9:43-:50's no trades, and 9:51-:52's ~7.9K $1.56->$1.59->$1.60 (intra-day high) ended the period.
09:53-10:34 stepped down, beginning on initially medium/high-volume through 9:57 and then very low/no-volume, and went sideways $1.57/9 to end the period on 10:34's 615 $1.58.
10:35-10:58 began a mostly low, some low, volume $1.56/8 on 10:35's ~2K $1.56 and ended on 10:58's 1.3K $1.56.
10:59-15:57, after three no-trades minutes, began stepping down on 11:01's 100 $1.55, did 11:02-:04's ~9.3K $$1.55->$1.54 (matches low), and 11:08's 150 $1.53 (new low) put in a bottom that initiated very low/no-volume $1.53/5 interrupted by 11:24's ~4.5K $1.54 and 11:32's ~9.7K $1.53, and switched to $1.53/4 at 11:28, where it remained to end the period on 15:57's 429 $1.53.
Buy percentage began to curl up from 12:15's nadir of 36.98% to 12:30's 37.5%, 13:30's 38.89%, ... peaking at 15:30's 44.14%, near our normal at EOD. Low volume was interrupted by sporadic one-minute volume spikes.
At 13:40 b/a was 39.5K:3.5K $1.53/4 and it remained substantially out of balance, getting no better than ~37K:~5K until the last few minutes of the day.
15:58-16:00 brought the normal EOD volatility when 15:58's ~10.7K $1.53/4 was followed by 15:59's 776 $1.54->$1.55 and closed the period and day on 16:00's 2,548 buy for $1.55.
There was one AH 200 sell for $1.53.
Excluding the opening and closing trades (didn't qualify), there were 12 larger trades (>=5K & 5 4K+) totaling 63,549, 33.54% of day's volume, with a $1.5610 VWAP. Somewhat unusual that the larger blocks VWAP was almost a penny above the day's VWAP of $1.5512. Very (most?) often the VWAP is slightly below the day's VWAP. Appears to be a result of a substantial portion of the larger trades coming in the early higher-priced part of the day, which accounted for ~36.7% of day's volume. That may be why we stayed low the rest of the day - the MMs, who control the market, may have taken advantage of little demand to hold price down and make covering buys for their shorts. When shares covering the real orders they may have processed flow into their control they will be short-term long and will hold price up a wee bit to increase profit by selling those shares.
Speaking of shorts, I'm guessing that short percentage will be elevated as the sizes and prices of the larger trades suggest fewer inter/intra-broker trades, suggesting greater numbers of MM shorts as a percentage of days volume.
On the traditional TA front, movements were:
 Ending  Period  Period  Period __Per. Trade_ Period_ % Day_ Per. End
 Period  Volume     Low    High _Dollar Val._ VWAP___ Volume Buy ~%
  09:52   19439 $1.5400 $1.6000    $30,460.08 $1.5670 10.26% 21.27% Incl 09:34 $1.5500 5,461 09:52 $1.6000 5,361
  10:34   37327 $1.5700 $1.5900    $59,027.24 $1.5814 19.70% 54.72% Incl 09:57 $1.5899 9,699 10:12 $1.5700 4,100
                                                                         10:12 $1.5700 4,200 10:14 $1.5849 5,000
  10:58   12556 $1.5600 $1.5800    $19,661.92 $1.5659  6.63% 50.05%
  15:57  103202 $1.5300 $1.5540   $158,595.24 $1.5367 54.47% 42.10% Incl 13:20 $1.5399 4,728 14:01 $1.5400 4700
                                                                         14:01 $1.5400 5,200 15:22 $1.5400 4,300
                                                                         15:22 $1.5400 5,700
  16:01   13994 $1.5300 $1.5500    $21,577.12 $1.5419  7.39% 42.62% Incl 15:58 $1.5400 5,100
On my minimal chart, unlike yesterday when the low penetrated below $1.53, our current support, today bottomed right on the support. This is the fourth consecutive day closing above support. With the last two days being down days and volume falling the suggestion is there's no strength (yet?!) to the downside.__Open_ ___Low_ __High_ _Close_ Volume_
Today -4.32% 2.00% -3.03% 0.00% -70.13%
Prior 3.18% -1.96% -0.60% -4.32% -57.22%
Further, the intra-day b/a I mention above suggests good support at $1.53 and the former potential support/resistance (lower rising orange line) could come into play again. Today it's ~$1.47/8 and rising ~$0.00667/day and so would be roughly $1.49 tomorrow. It should be noted that line never "settled in" as firm support or resistance but was rather a "battleground" point.
The biggest point of concern is that price has been "pushing" my experimental 13-period Bollinger's upper limit. We need to hold range long enough that the Bollinger can catch up. For the moment this "pushing" suggests pressure to move price range lower.
On my one-year chart trading is still above the long-term descending support.
The oscillators I watch went mixed with a flat RSI and Williams %R, a rising momentum and MFI (untrusted by me), and a weakening full stochastic, accumulation/distribution and ADX-related. All but ADX-related and accumulation/distribution are above neutral and nothing is overbought or oversold.
The 13-period Bollinger limits, $1.3380 and $1.6174 ($1.3226 and $1.6066 yesterday) are still diverging (could flip tomorrow) but the lower limit has flipped to rising. This is good as it suggests a higher lower bound likely if a range drop occurs. The mid-point, to which reversion is common, is now ~$1.47, substantially in agreement with the minimal charts rising potential support (lower rising orange line).
All in, I remain neutral to slightly positive based on the conventional TA due to the mixed nature of the oscillators, the continued honoring of the former resistance, now support, falling volume suggesting no strength (yet!) to the downside, and the big b/a buy imbalance seen at the support of $1.53 seen intra-day today.
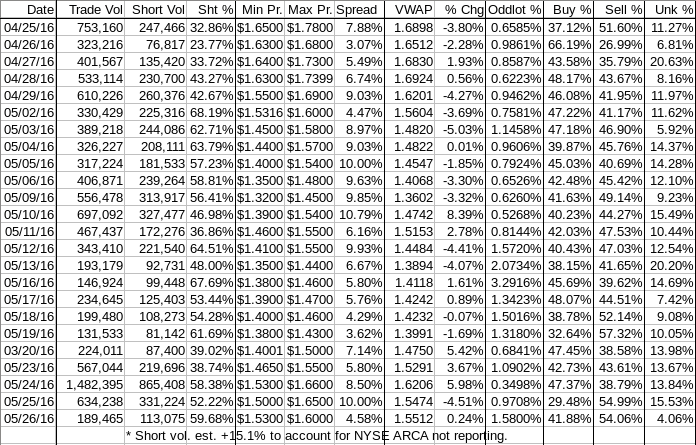
Percentages for daily short sales and buys moved in the same direction, which is a "normalcy" indication, and the buy percentage is trying to get back to our "normal' (which would still be insufficient for sustained appreciation). The short percentage is well above my desired range (needs re-check) but may look worse than it really is because I've not yet been able to discern if the NYSE/ARCA short reporting the ended was actually migrated to the FINRA reporting facility. Maybe I'll have enough indication this weekend to tell.
Also, I suspect, as mentioned above, that the MMs had to flag short a greater number of trades.
We'll never know.
The spread narrowed and is now in a normal range so it's not delivering any indications either way. I do however believe that when it looks like we've been doing a little consolidation, a short-term breather in this case, a "normal" spread is both a result and confirmation of that activity. This suggests to me a slightly positive exit from the consolidation is likely.
VWAP movement added another positive, albeit quite small, to our trend, giving us now twelve negative moves in the last nineteen readings and seven positives. The percentage movement was quite small though and are often followed by negative moves. Considering the volume, conventional TA, ... I can't see any evidence one way or the other if this will be the case again.
Add in that tomorrow is Friday, often low volume and weak prices, and I would lean slightly negative here. However, weak volume is the environment for easiest manipulation to support use of the ATM and/or selling by the financiers. Add in the apparent strong support of $1.53 and the intra-day big buy b/a imbalance seen there and I wouldn't be surprised to see a VWAP increase.
All in, I have to get neutral here. Too many considerations leaning both ways to make a reasonable decision.
As always, much is experimental and should be treated as such.
Bill
Join the InvestorsHub Community
Register for free to join our community of investors and share your ideas. You will also get access to streaming quotes, interactive charts, trades, portfolio, live options flow and more tools.

