


Tuesday, November 24, 2015 9:43:20 AM
Today looks like a follow-on from yesterday, which opened high and essentially tanked for the rest of the day, offering any shorters, especially MMs I think, some very attractive covering buy points. This may have put the MMs short-term long and today may have reflected that as we opened low and immediately climbed to recover most of yesterday's price loss and then had, essentially, two very long flattish periods for the rest of the day. Recall that I believe MMs will hold price up in this situation to garner more profits as they close out those short-term long positions. Once price range was up there it essentially stayed flattish there as MMs (I think) just sold into the "high" bids all day.
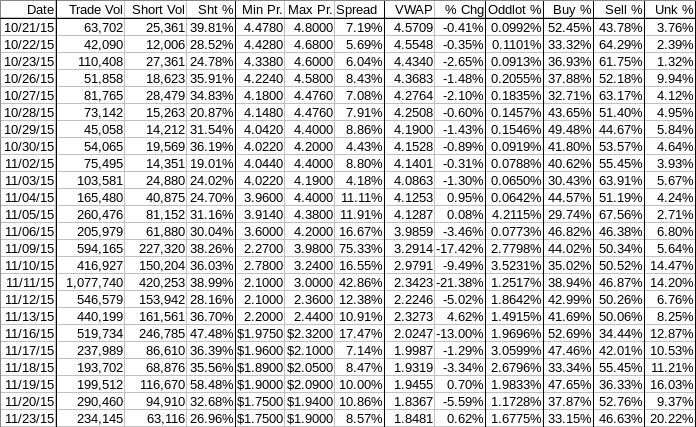
This seems supported by the buy and unknown percentages during the day. The buy percentage peaked at ~38%/~39% at 10:45/11:00, the same point at which we established the day's high and the highest trading range of the day, lasting ~1 hour. Thereafter the buy percentage never got above ~37% and weakened for the rest of the day. Meanwhile the unknown percentage was unusually high, hitting ~27% at 11:15 and ending the day at ~20%. This indicates a lot of trades going at bid/offer mid-point, something retail can't do unless they use ATM (At The Market) orders and that would normally result in a trade at the bid or offer, unless an MM (or it's HFT(?) bot "jumped ahead" and stole the trade. The high unknown suggests this was the case and would make sense if an MM was short-term long, had gotten the trading range elevated relative to the MMs' cost basis and the MM wanted to take profits while the taking was good (and easy).
There were no pre-market trades.
Trading opened with buy of 3,996 shares at $1.79 and traded $1.80 also in that same minute. Then 253 shares dropped to $1.75 two minutes later and it started a slog higher three minutes later with a two-minute ~7.2K move to $1.80 followed by no volume until 9:40 did $1.79/$1.81 on 2.6K and ended the period at 9:48 for $1.81/4. 9:49-10:19 continued moving up with 27.8K doing $1.82->$1.84 the first two minutes, 27.25K $1.82/3 at 9:51 and then fell back to no/low-volume with prices still slowly rising, hitting $1.85 at 9:58 and doing verylow-volume $1.84/5 and ending at $1.85. 10:20-10:41 began with a two-minute 13.1K drop to $1.83 and went right to no/low-volume $1.83/4 trading, ending the period at $1.84. 10:42-13:00 continued very low-volume at $1.84/5, started a series of mostly low-volume steps up at 10:48 and hit $1.90 at 10:52, and, after a couple minutes, began mostly low-volume $1.87/9 trading which narrowed to $1.88/9 at 11:09, opened back up to $1.87/9 at 11:41, ending the period at $1.87. 13:01-14:56 dropped range to $1.86/8 on 1.5K the first minute and then went no/low-volume in that range, ending the period at $1.88. 14:57-15:46 just compressed to $1.86/7 on no/low volume until 15:11 brought low/medium-volume for the rest of the period, ending at $1.86. 15:47-16:00 first minute did ~17.5K taking price to $1.84 and did $1.84/5 on low and medium volume ending the day with a very small 979 share sell at $1.84.
There were no AH trades.
Excluding the opening and closing trades (didn't qualify) there were five larger trades (>=5K plus a 4.6K that looked like part of a 5K) totaling 58,465 shares, 24.97% of day's volume, with a $1.8449 VWAP.
On the traditional TA front, movements of the open, low, high, close and volume were -6.28%, -0.57%, -2.06%, 2.22%, and -19.39% respectively vs. yesterday's -3.05%, -7.37%, -5.37%, -7.69%, and 45.59% respectively. Only the close is a positive movement in these numbers. However, if you check my non-traditional table below you'll see the negatives apparently belied by the move in the VWAP.Ending Period Period Period Per. Trade_ Period_ % Day_ Per. End
Period Volume Low High Dollar Val. VWAP___ Volume Buy ~%
09:48 26220 $1.7500 $1.8300 $47,341.64 $1.8056 11.20% 33.03%
10:19 68887 $1.8200 $1.8500 $126,005.35 $1.8292 29.42% 29.12% Incl 09:49 $1.8200 9,400 15,600
09:51 $1.8300 8,500
10:41 18270 $1.8300 $1.8500 $33,661.80 $1.8425 7.80% 36.62%
13:00 56903 $1.8400 $1.9000 $107,026.18 $1.8809 24.30% 37.51% Incl 11:03 $1.8900 9,400 11:52 $1.8799 4,600
14:56 14240 $1.8600 $1.8800 $26,574.27 $1.8662 6.08% 36.81%
15:46 21104 $1.8600 $1.8700 $39,338.58 $1.8640 9.01% 36.14%
16:00 24658 $1.8400 $1.8600 $45,634.72 $1.8507 10.53% 46.85% Incl 15:47 $1.8600 10,965
BTW, ignoring yesterday's down price up volume, today's higher close (and VWAP if we use that) and higher volume than Thursday could be considered to be the return of the "volume cupping pattern" I wanted to see. Friday is ignored because it fit with my { ... Friday may break the pattern though because Friday's are often when some exit to avoid being exposed to weekend exogenous events. }
But there's other traditional TA things to consider too.
On my minimal chart we traded almost exactly within the support and resistance of the new short-term descending wedge I identified. Our time within the wedge isn't where we normally expect a break out but it's such a narrow wedge that an early break wouldn't surprise me.
On my one-year chart the price continues riding the descending long-term channel's support. Every oscillator I watch improved marginally. All are still oversold or below neutral, for those that don't have "oversold" markings.
The 13-period Bollinger Band continues sinking it's mid-point towards price, as I feared might happen, rather than price rising to the mid-point.
All in, staying within the new short-term wedge and improved volume (ignoring Friday - see above) offers hope. I'll still be awaiting a trend before getting optimistic again.
Yesterday, while discussing what I though might account for the "straight down" behavior, I said { If this is what happened today we could see price held up tomorrow. }.
Voilà! Right on cue! VWAP up even though buy percentage was substantially lower than yesterday's, as was short percentage.
Percentages for daily short sales and buys went in the same direction but are both well below where I think they should be to indicate positive price movements in the cards. If the MMs were short-term long and exited there yesterday we could see weakness today.
Price-spread contracted some and was the result of up, rather than down, behavior. Since we're in a down trend again, for sure, it's wide enough to be of concern though, although it's much less certain at this value and on a day with a better VWAP and volume.
All in, less pessimistic than yesterday but still a long way from optimism.
As always, much is experimental and should be treated as such.
Bill
Join the InvestorsHub Community
Register for free to join our community of investors and share your ideas. You will also get access to streaming quotes, interactive charts, trades, portfolio, live options flow and more tools.

