News
News  Market Data
  Discover
Support: 888-992-3836
Copyright © 2023 InvestorsHub Inc.


Register for free to join our community of investors and share your ideas. You will also get access to streaming quotes, interactive charts, trades, portfolio, live options flow and more tools.
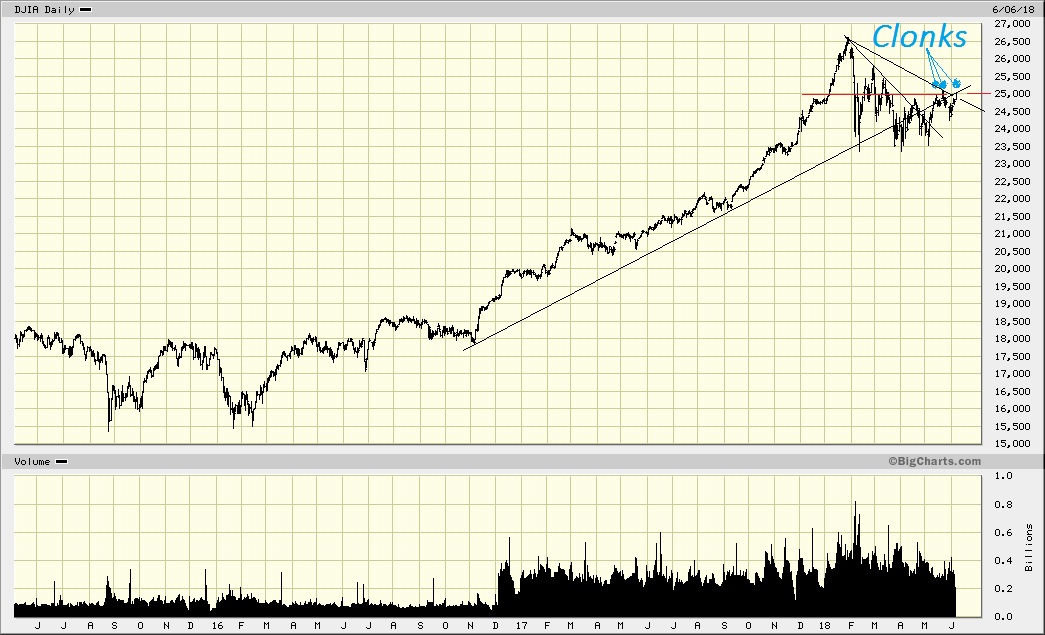
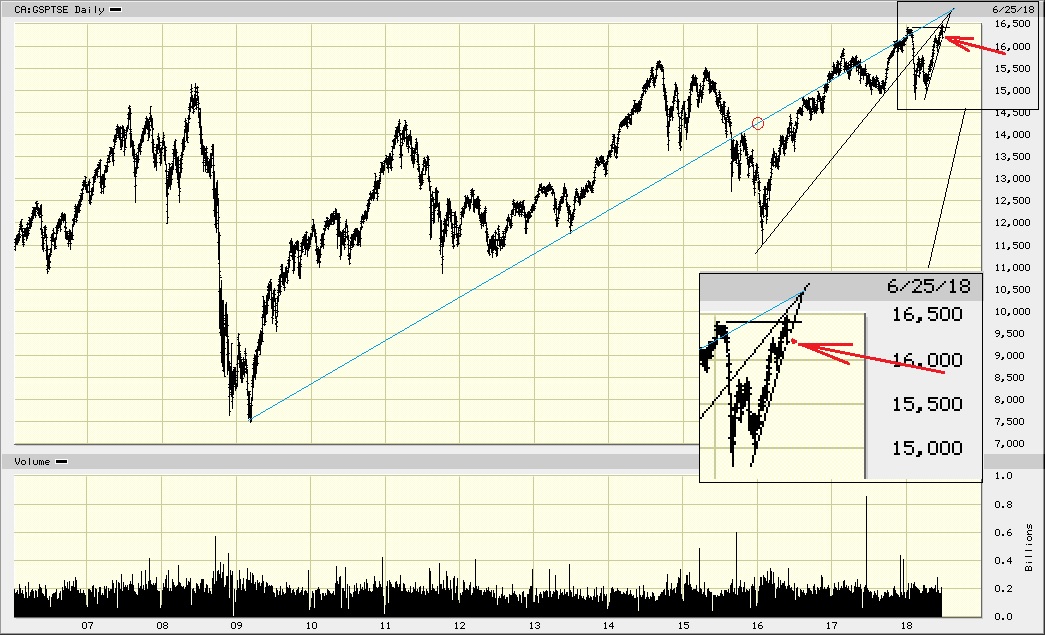
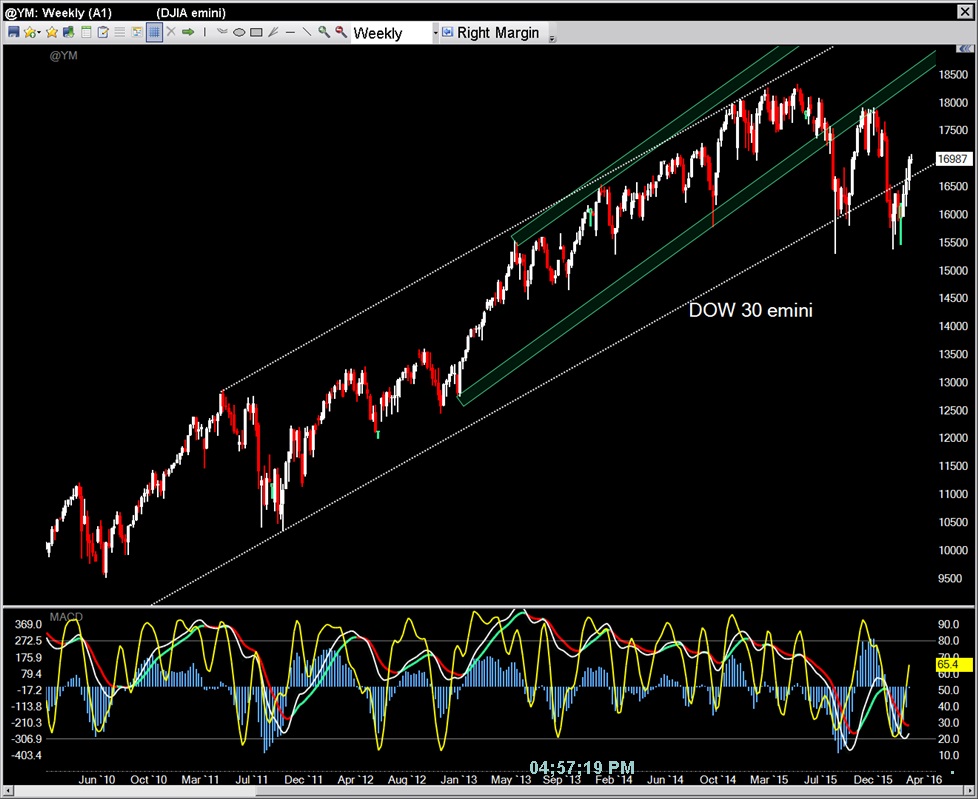
The Dow Jones Industrials Average, etc. :
This from Wednesday June 6th :
Was noting the Clonks and the 25,000 :
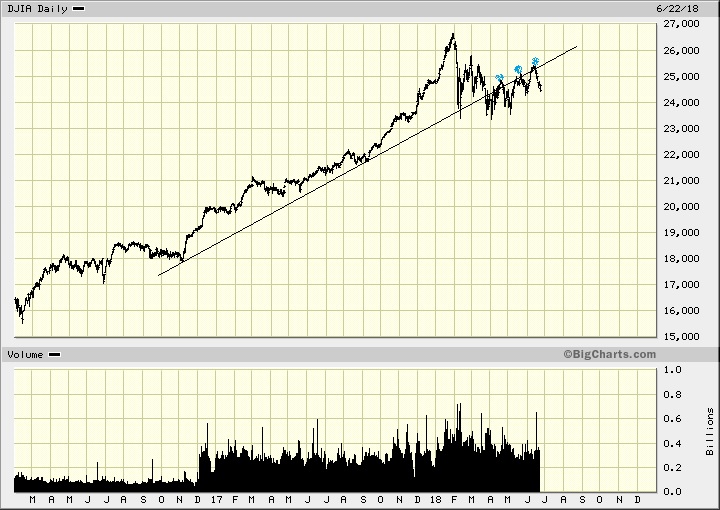
This from Friday June 22nd : (13 trading days later)
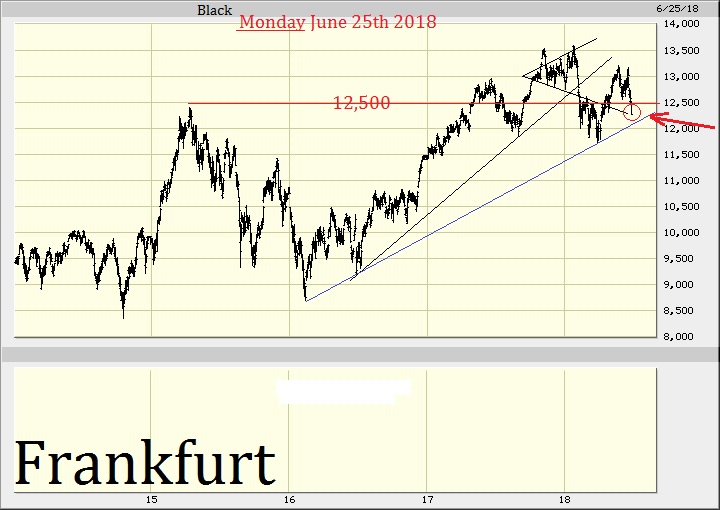
This from the next trading day - Monday June 25th :
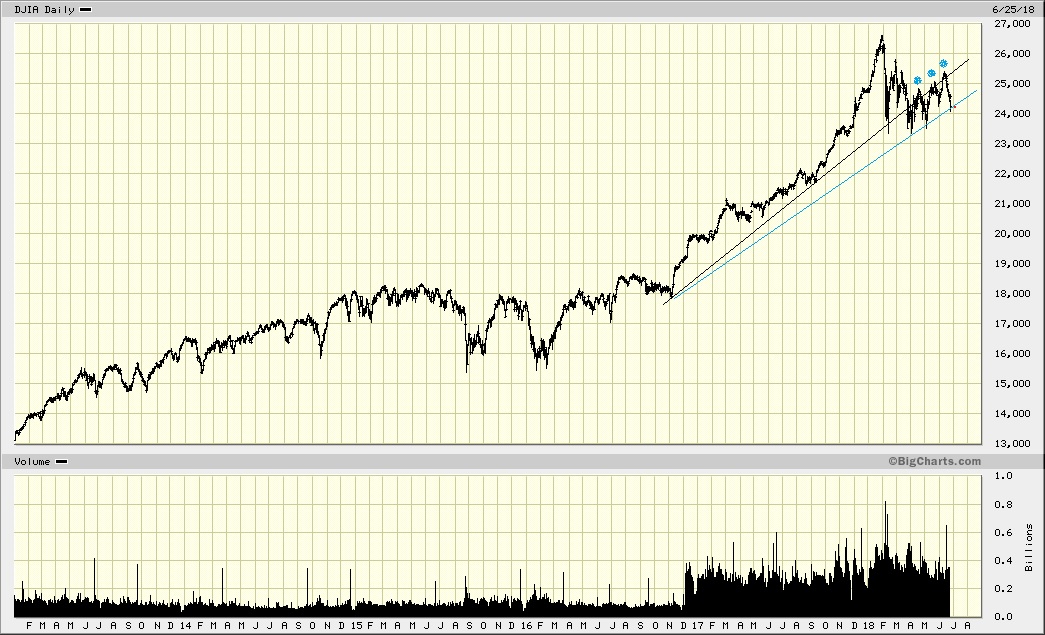
Now we've no choice but to (closely) monitor that Blue Line !.....as well as the 24,000
.
Meanwhile :
The Toronto 300 Composite Index.......(fwiw)
12 yr chart :
2 yr chart :
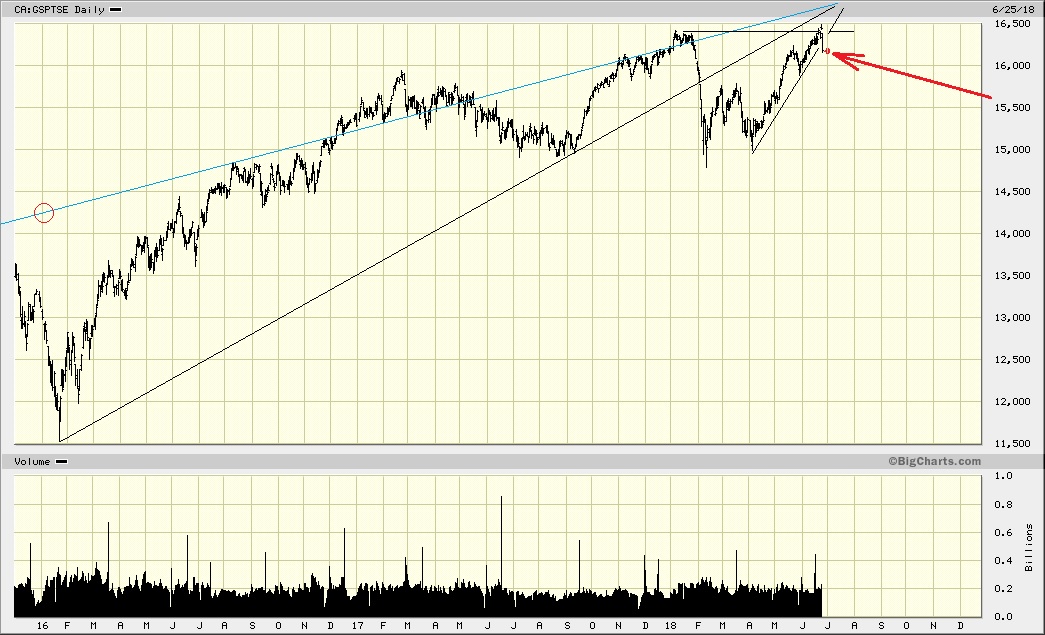
Monday June 25th - Down 266 (1.66 %)
.
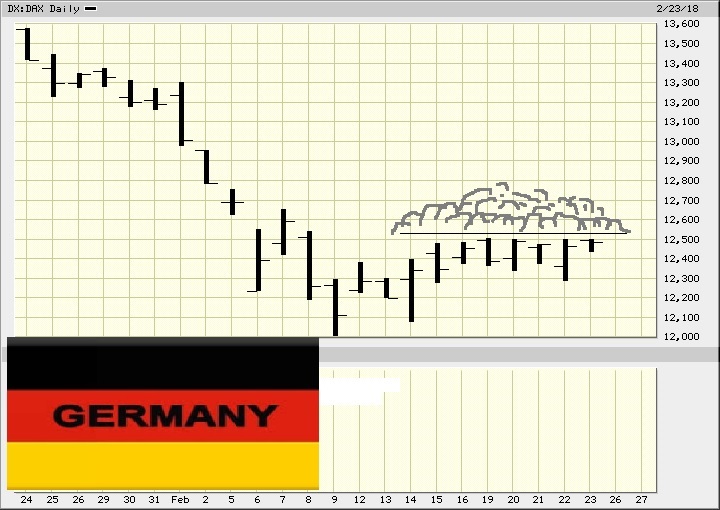
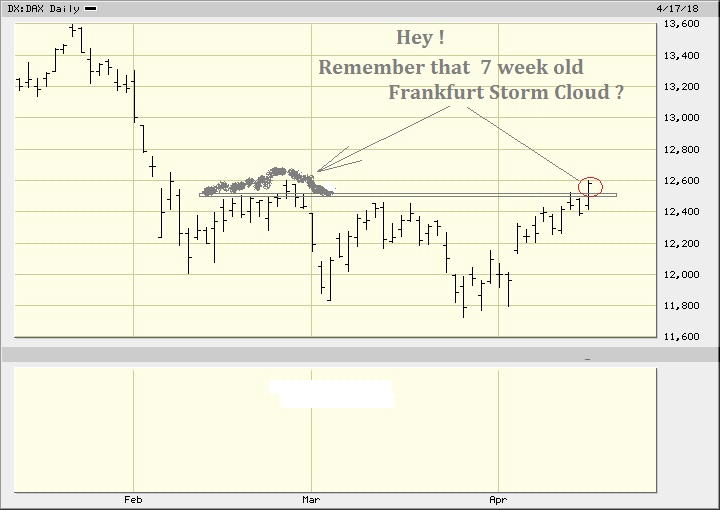
And then there was Germany (not to bother with Asia here).....
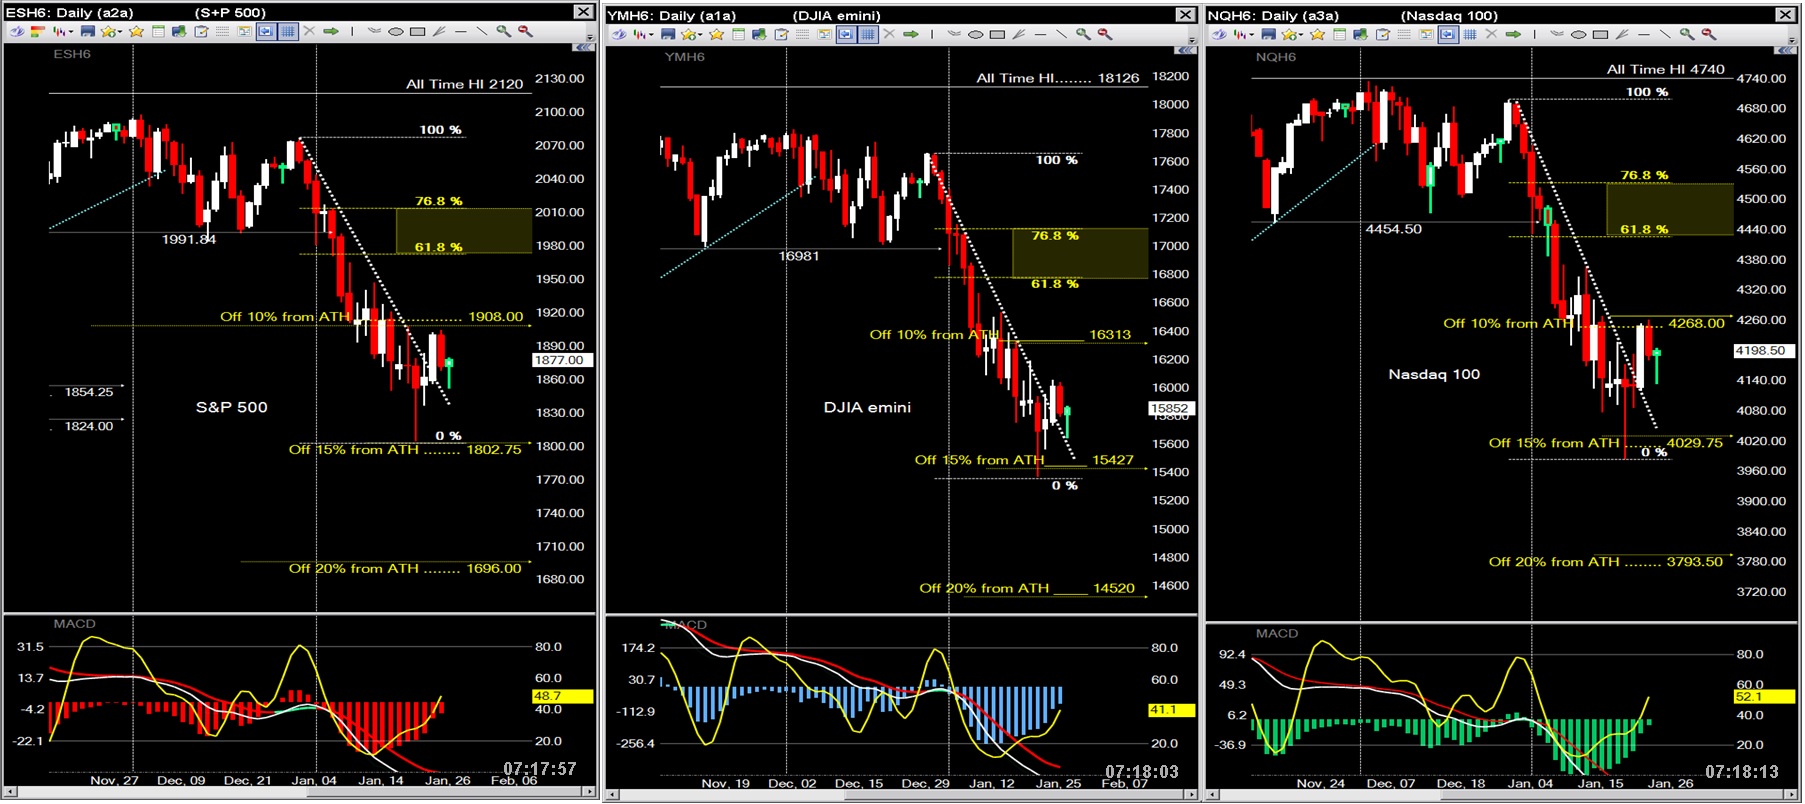
Assuming one can make a bit of sense out of all this :
The Original : From February 23rd : (The Original identification of the import. of 12-5)
7 weeks later :
Four days after The Original (Feb. 27th) :

Four months after The Original :
One week after The Original :

Four months after The Original :
Yes,

.
FUTS continuous contract DAILY & MONTHLY


ELECTION 2016
Massive volumes
.jpg)


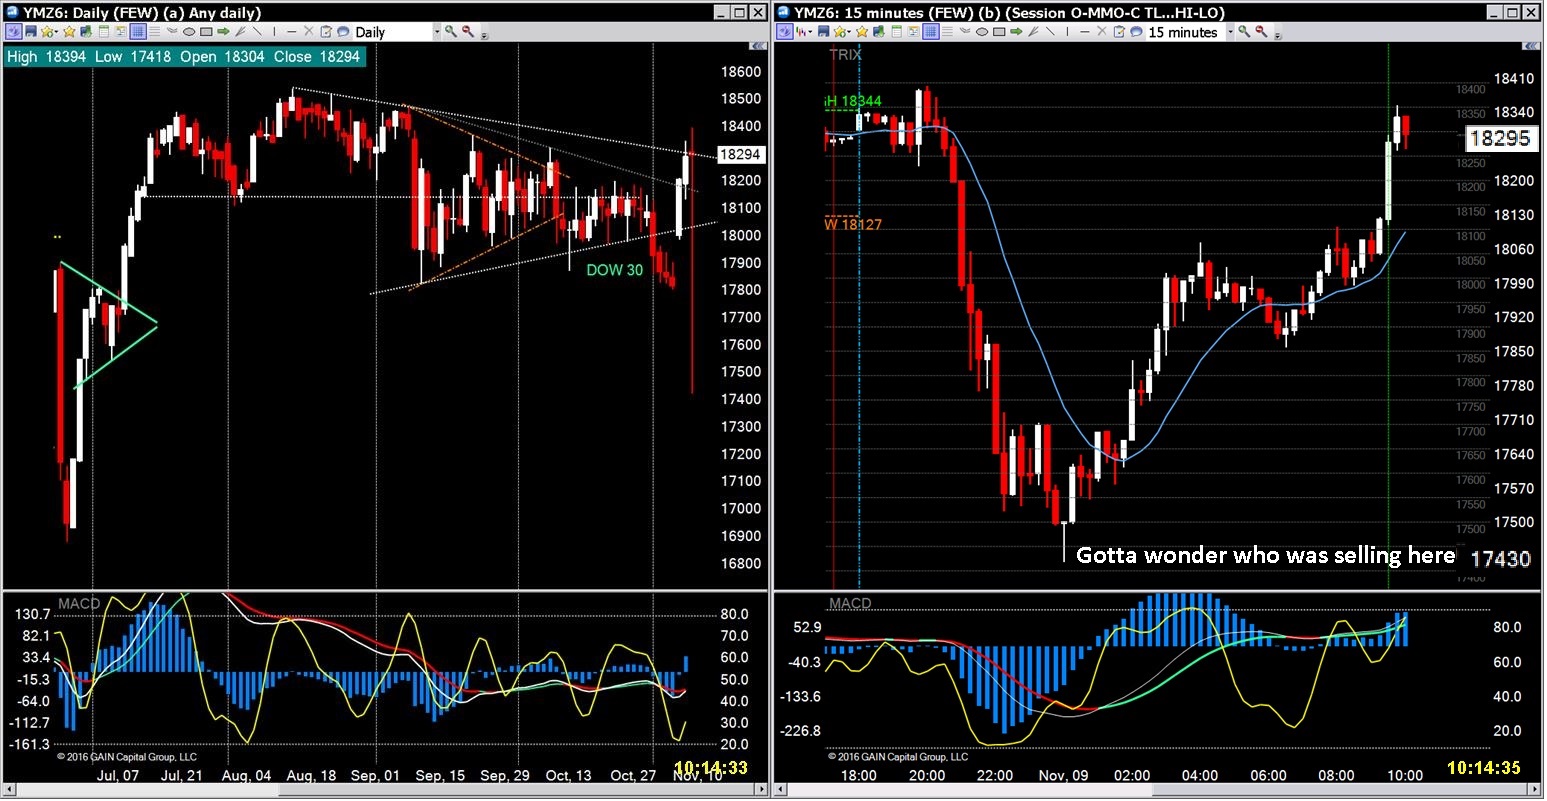
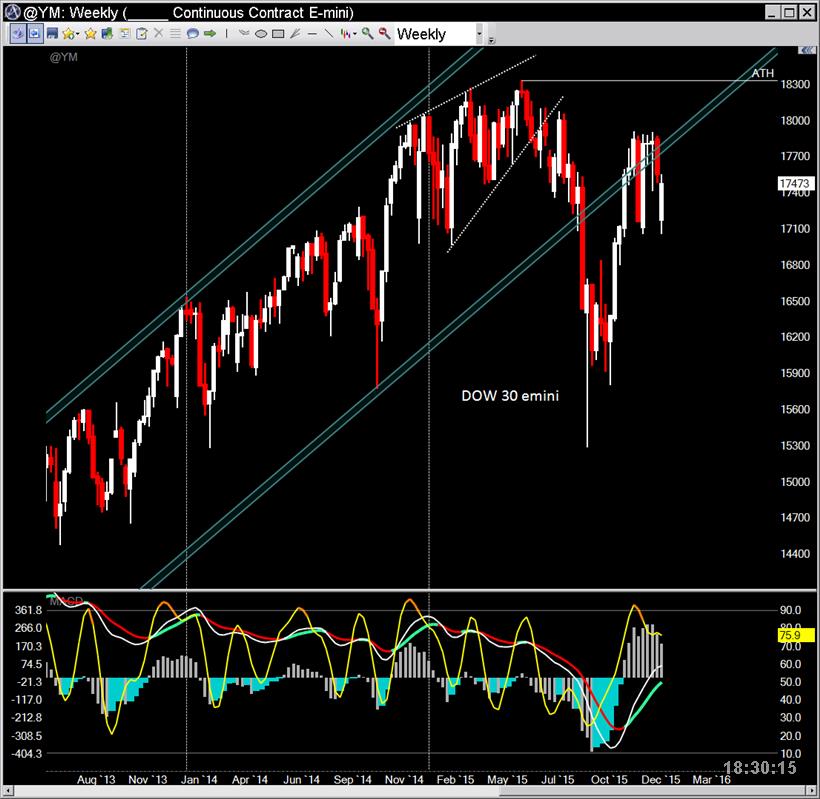
FUTs continuous contract weeklies


I prefer to watch multiple time frames at-all-times
3 month Daily FUTs...
Daily and session charts

Minute based session charts
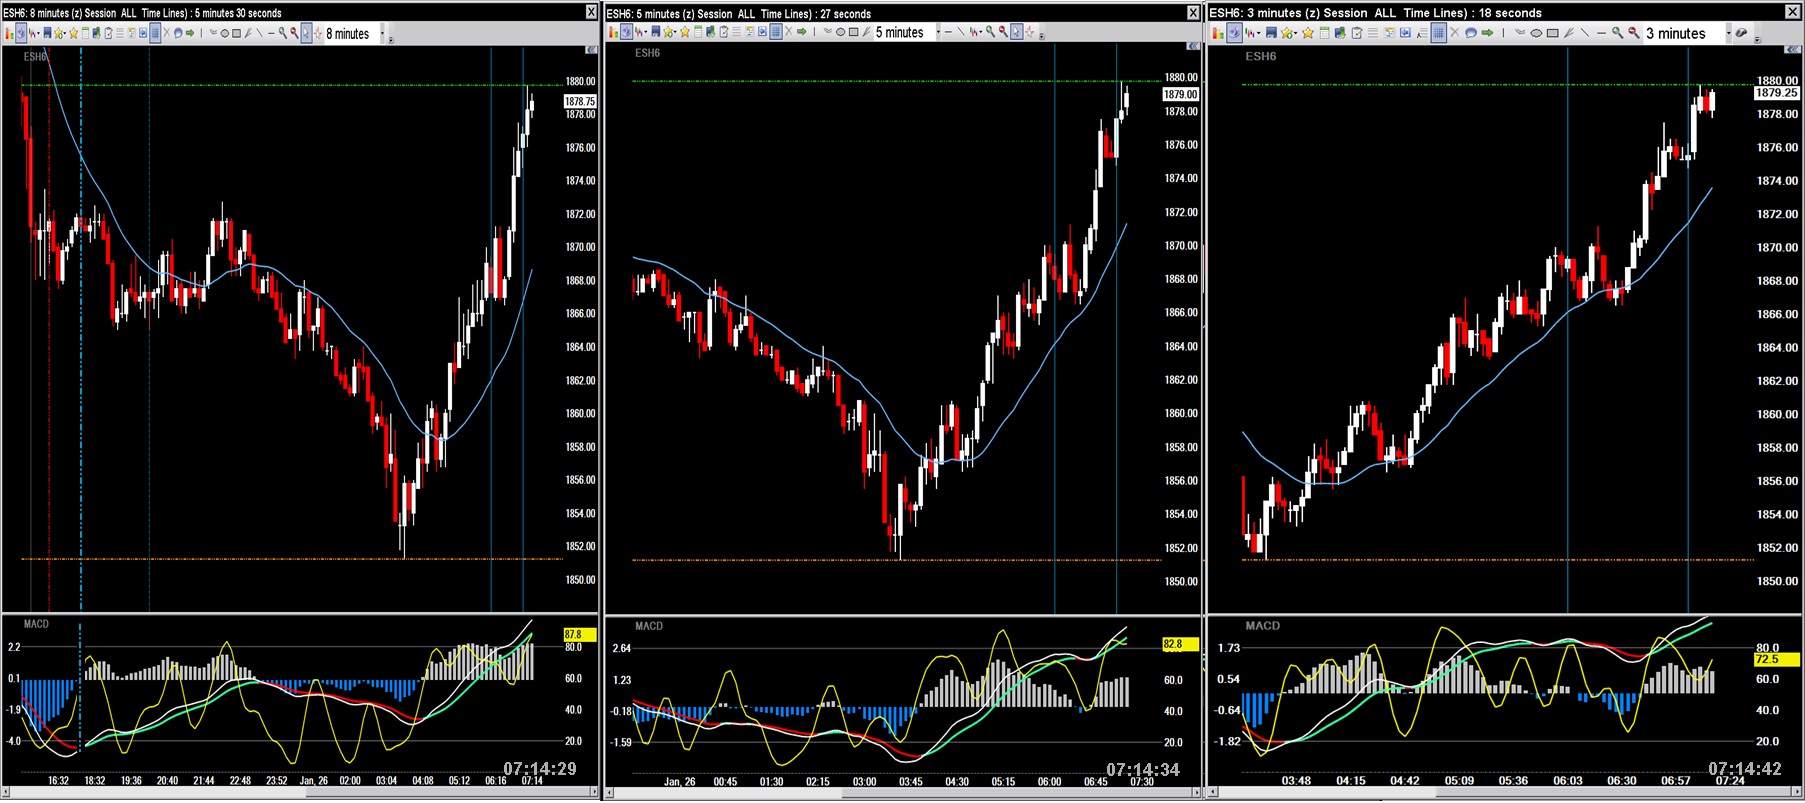
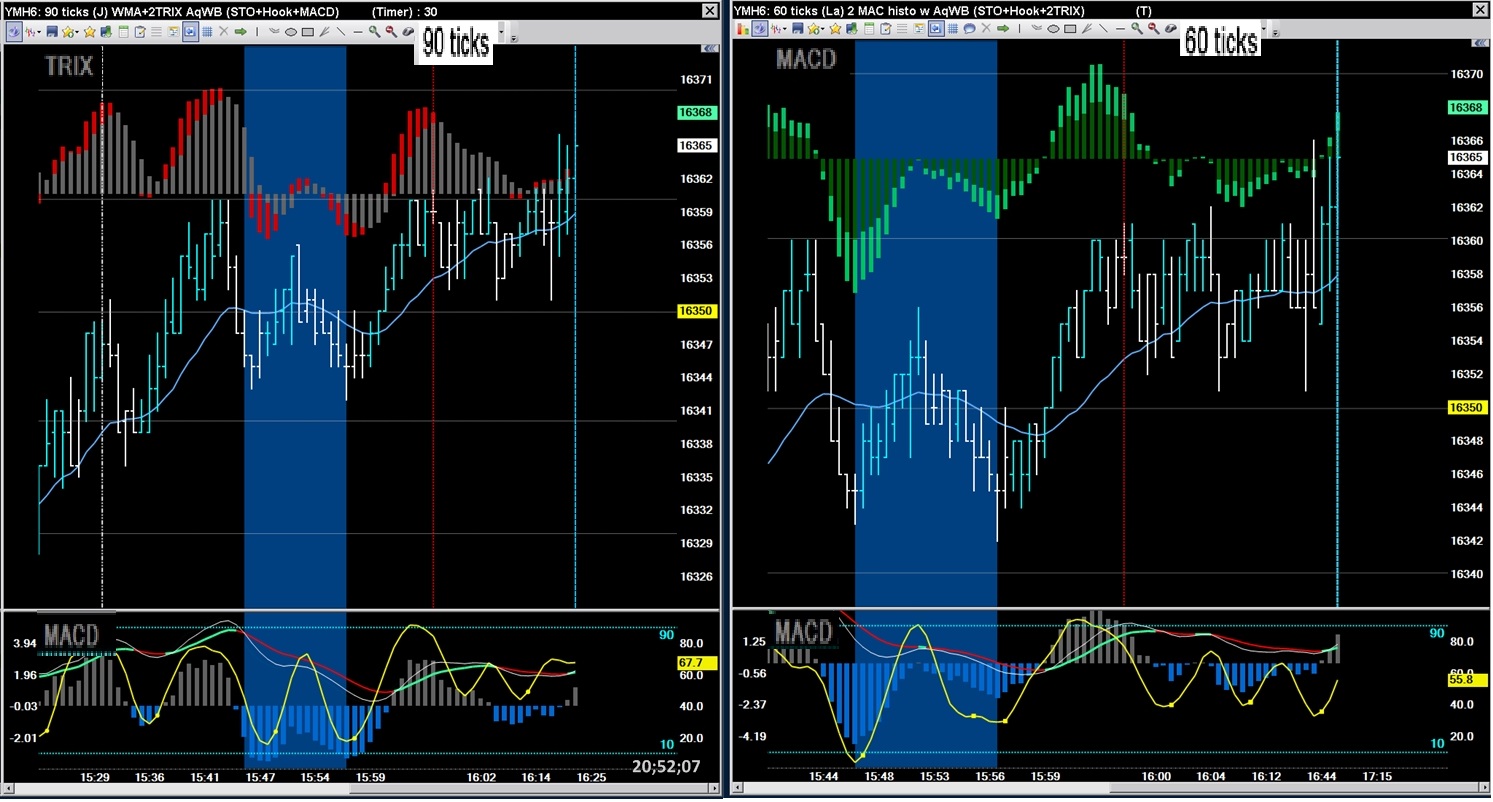
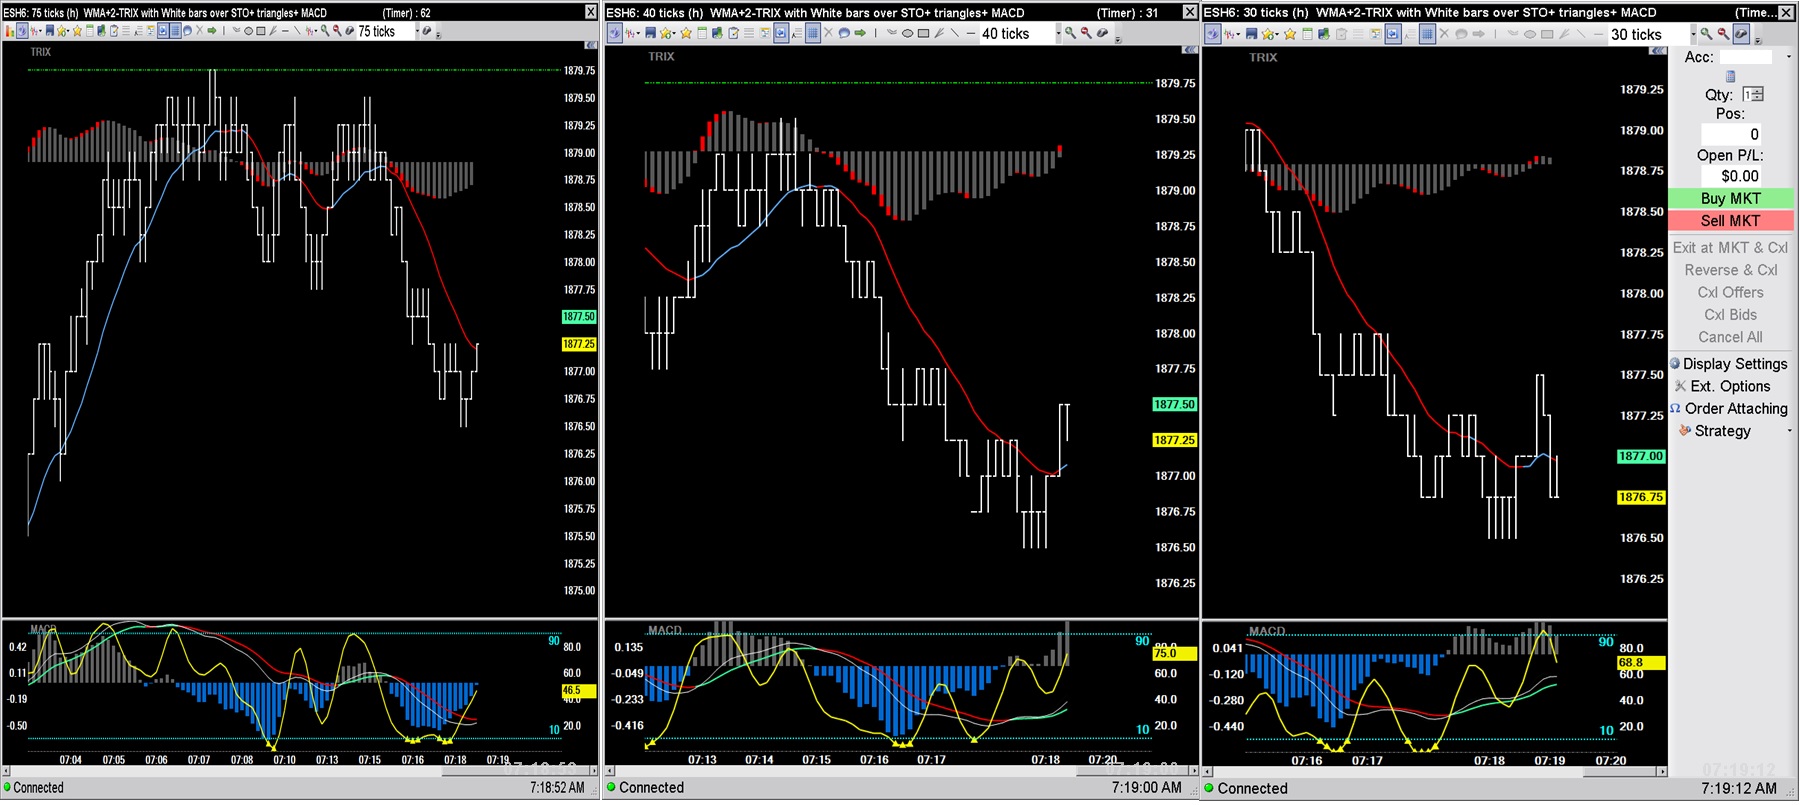
Tick based T-Mode charts
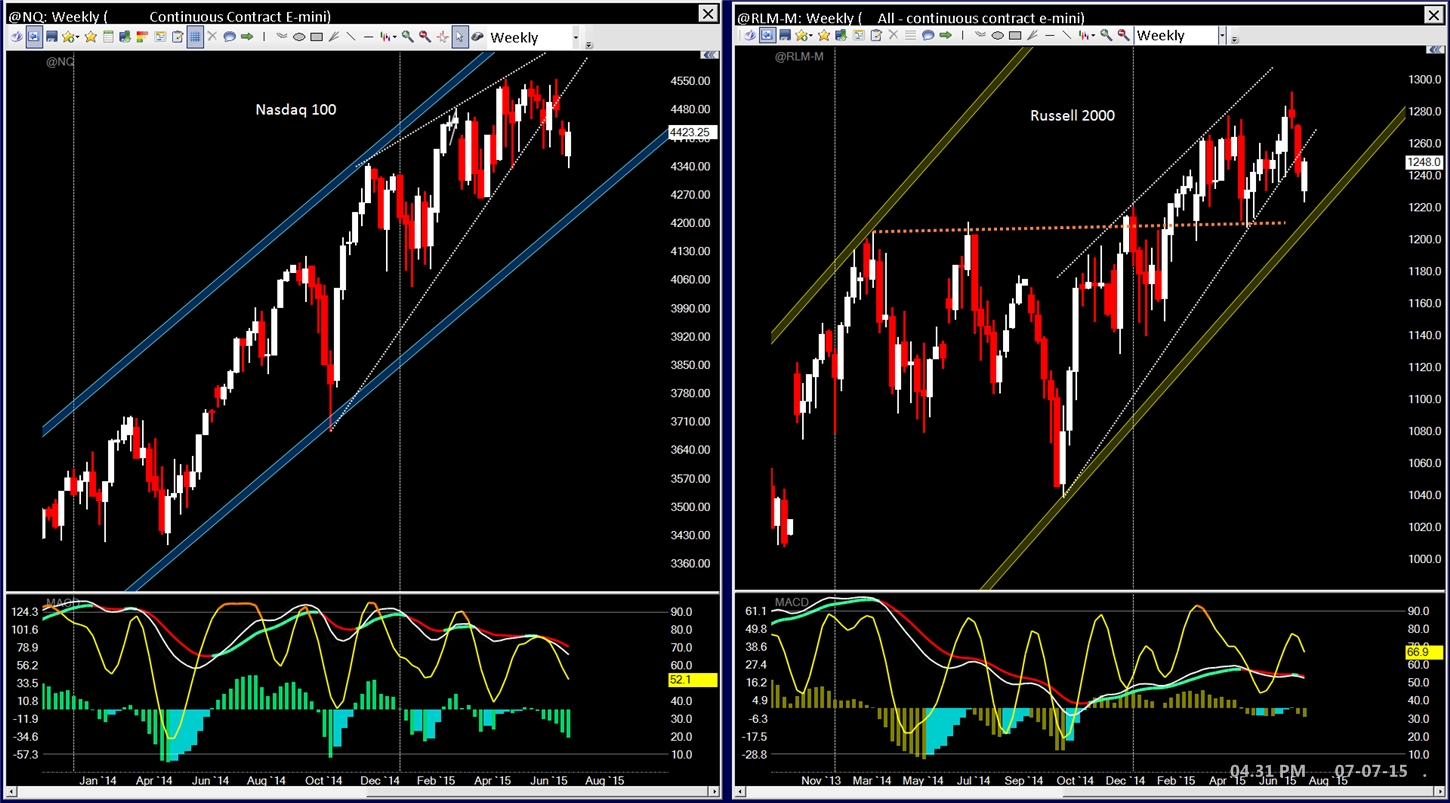
Weekly FUTs vs Daily FUTs ... opposite patterns
Re-testing the break-down levels from rising wedges on the weeklies
while the dailies break-out of descending wedges...
Price is behaving in proper fashion with respect to the T/A wedge pattern - on both time frames.
Technically you should respect the longer term pattern and time frame more-so than the shorter...
So, let's be clear !
Now that the weekly's short term upward re-test of the rising wedges' break-down levels has happened
I'd expect price to reverse and continue to move down, as per rising wedges rules...
Which means the daily's breakout levels of their declining wedges will be re-tested
so I expect a reversal back down towards their break-out levels...as per declining wedges rules...
ummm, clear?
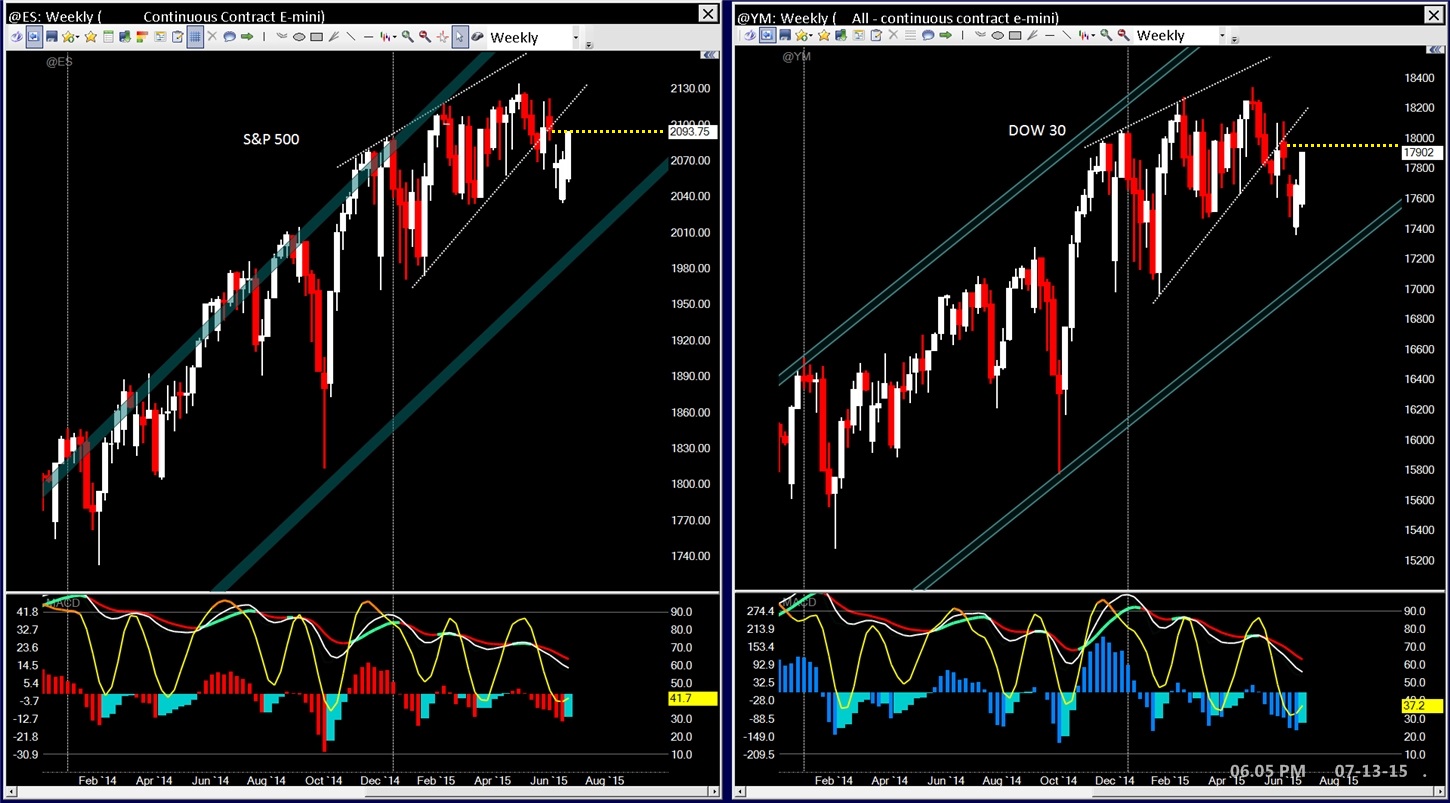

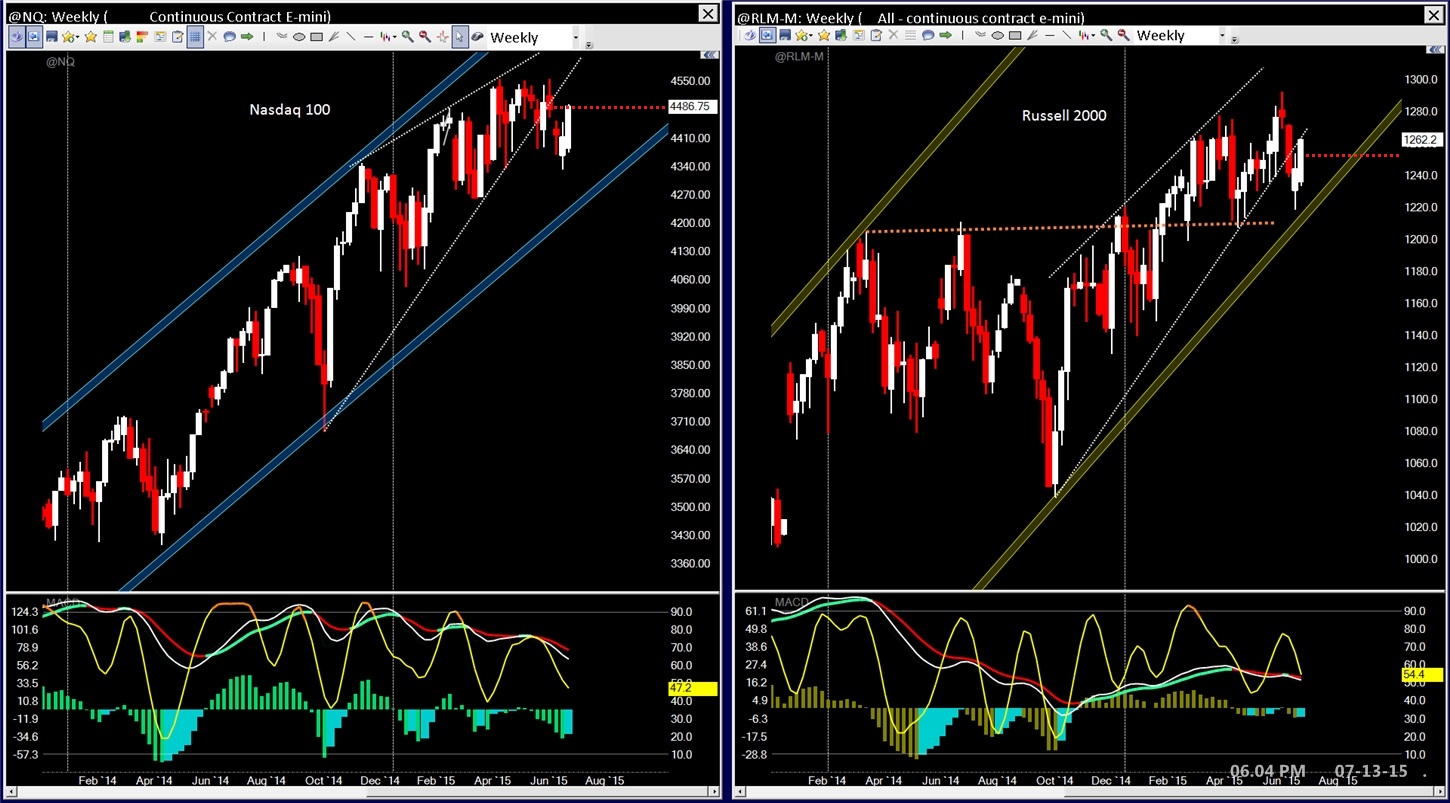
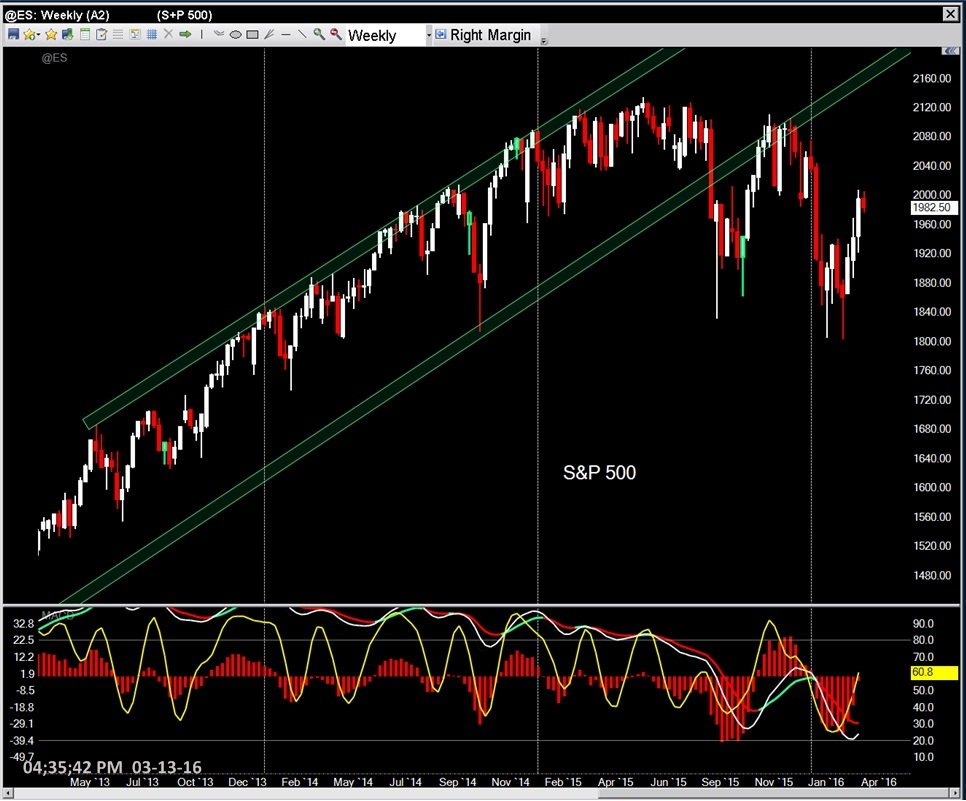
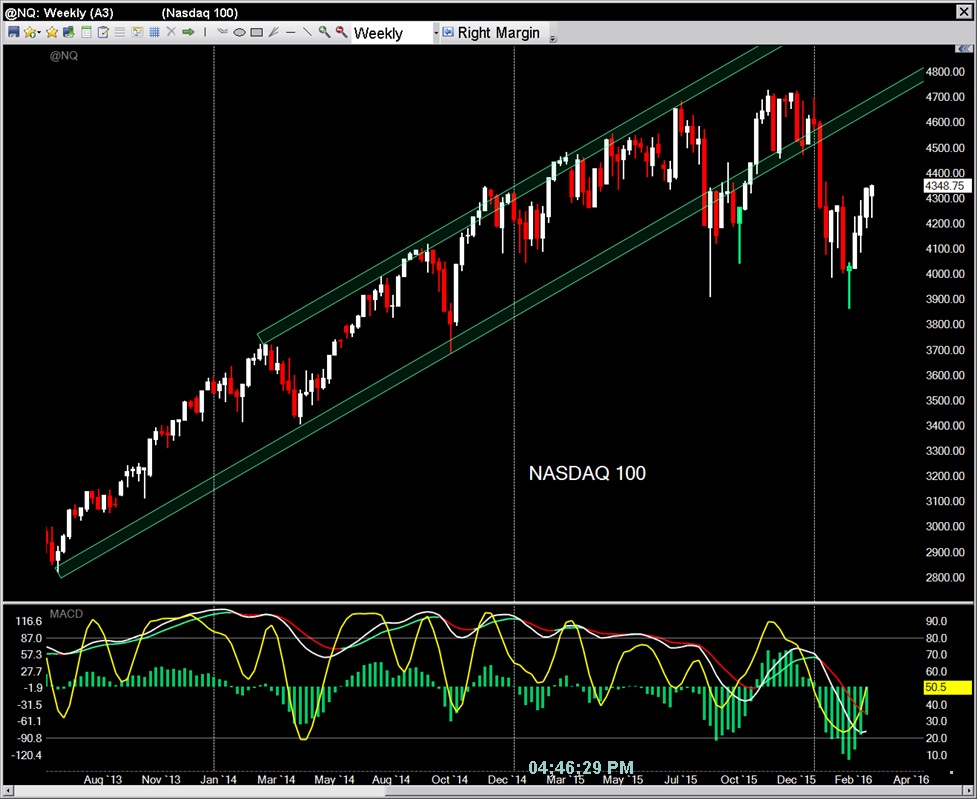
Weekly FUTs

The week in review...
Spinners on the ES and YM suggest next week is up.


FLO trade - the Friday before OEX ... A nice pull back for entry at the close

The weekly FUTs using the continuous contracts...
Long legged spinners on the big boy's charts @ the lower trend lines of their respective rising wedges.


FLO trades update...3 for 4 buy-ins went higher with minimal draw-down...
FLO trades blog

June has arrived and heading down
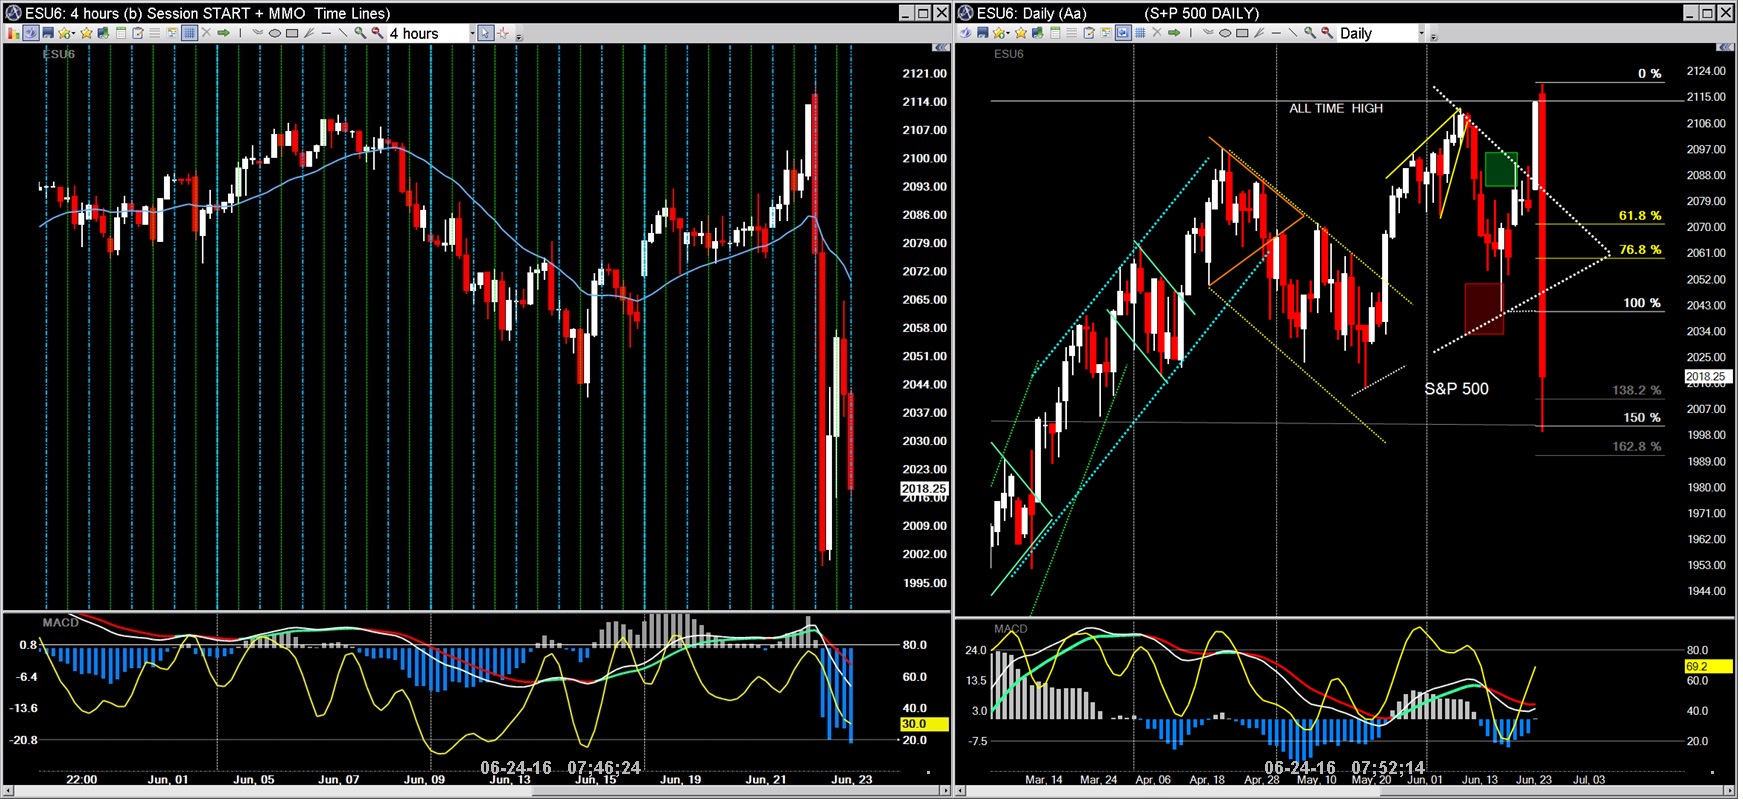
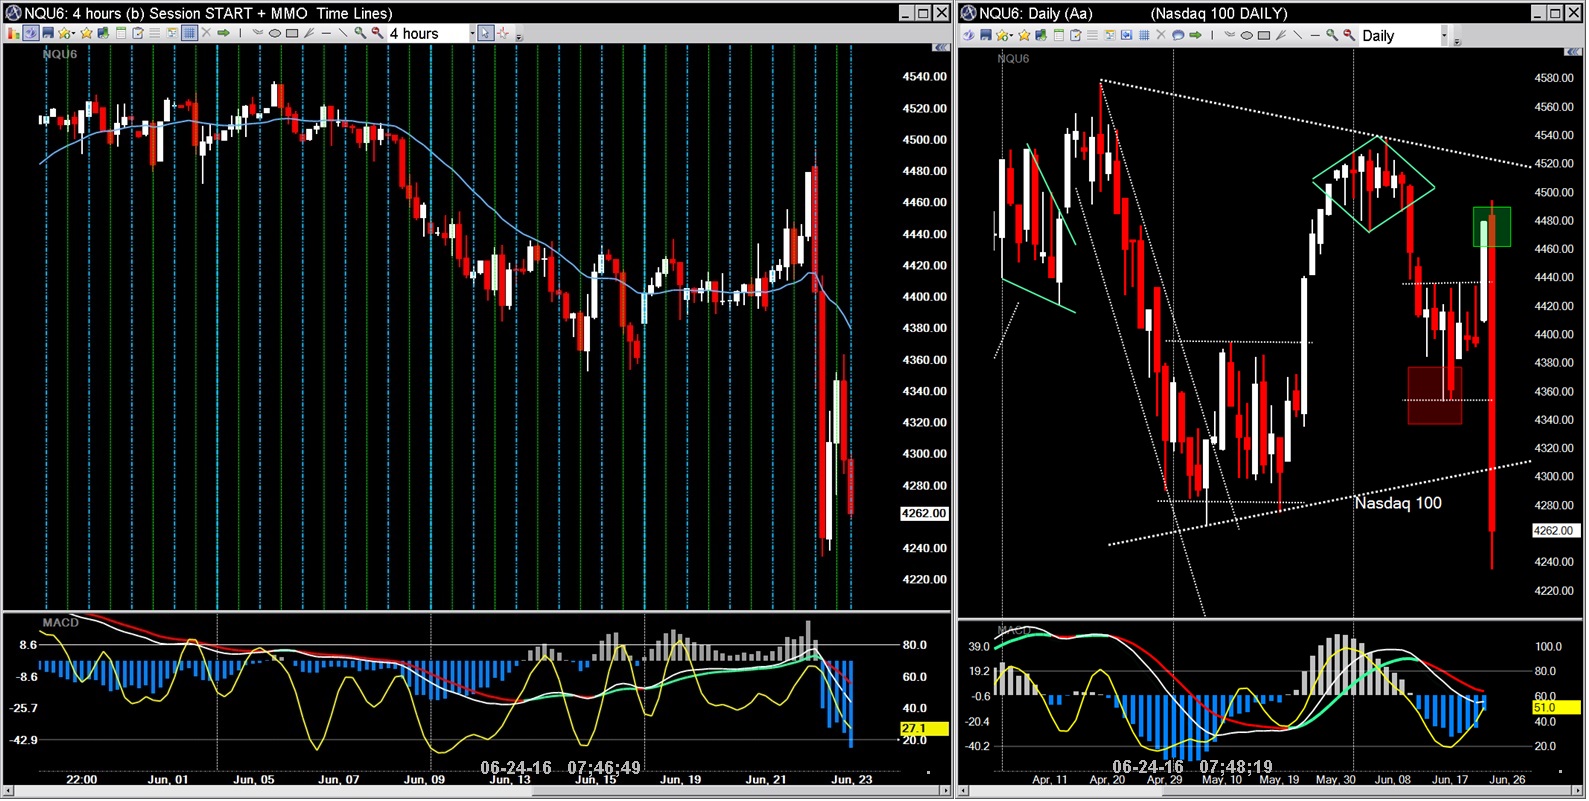
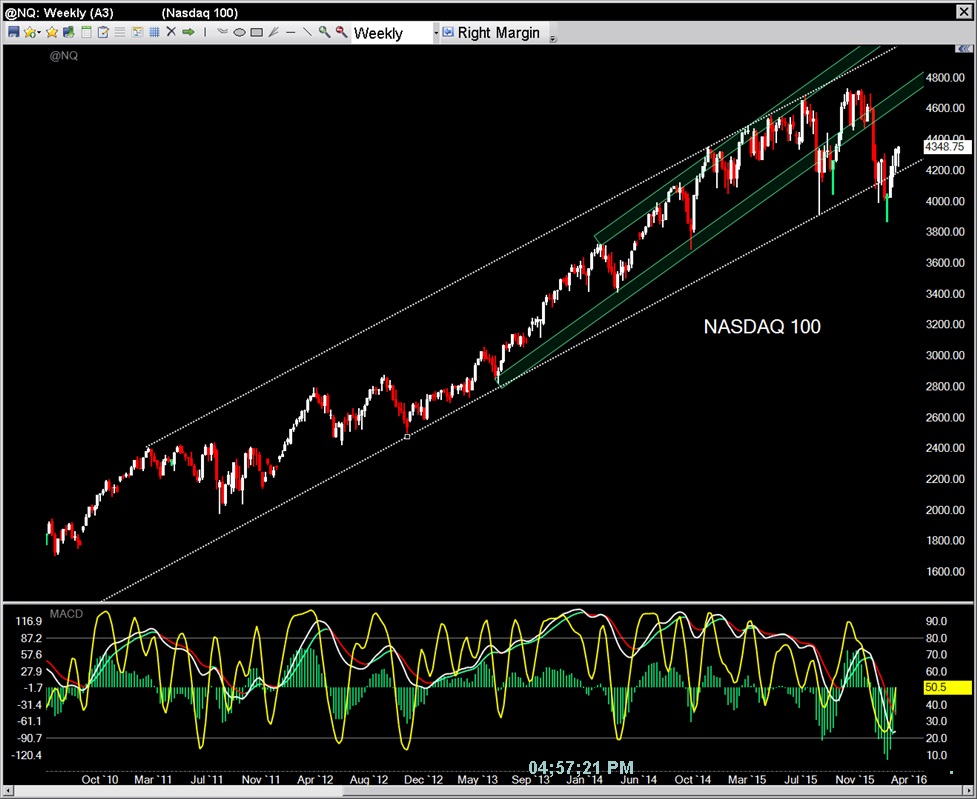
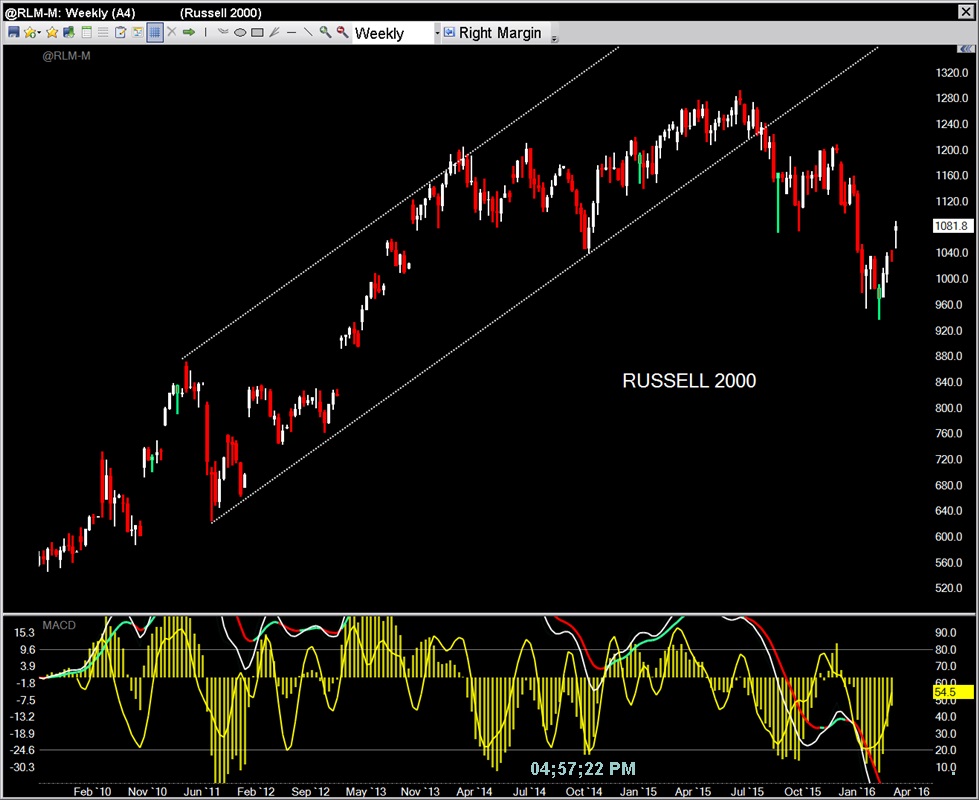
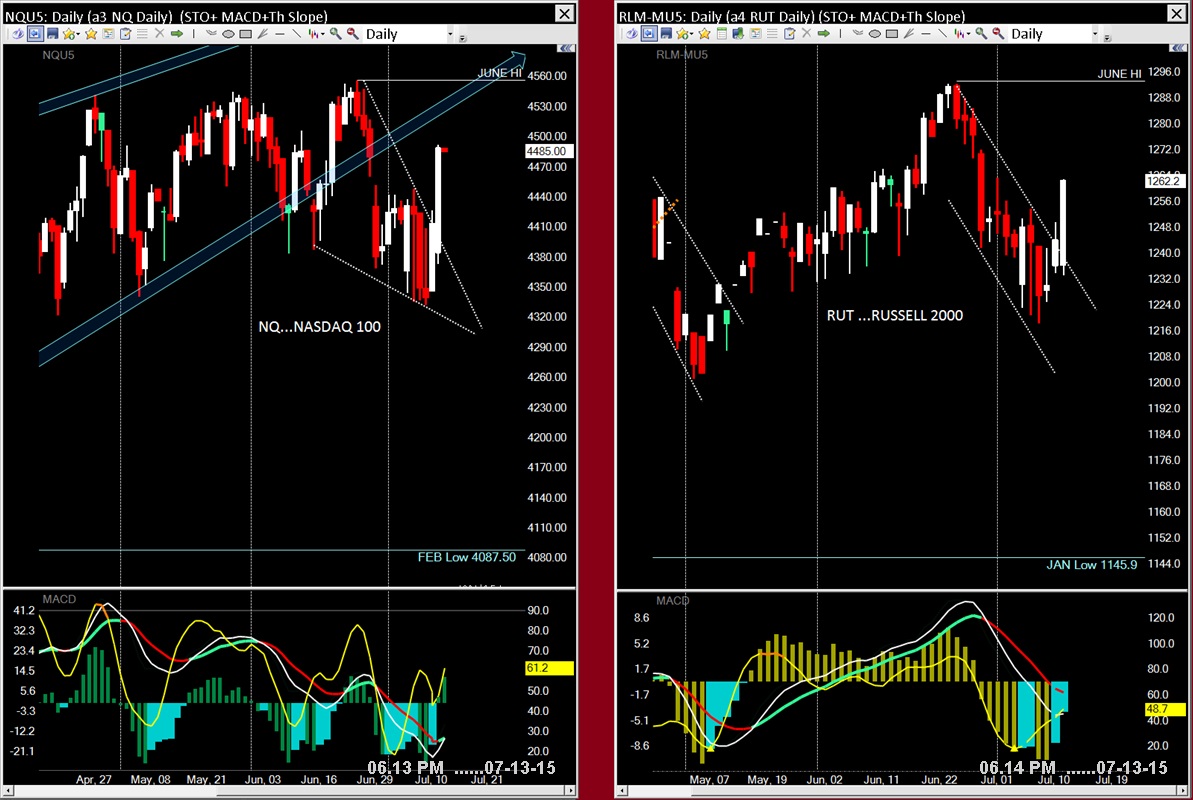
The ES,YM and NQ closed lower week-over-week while the RUT went it's own way.


Ominous rising wedges on the weeklies...


Eventful week...
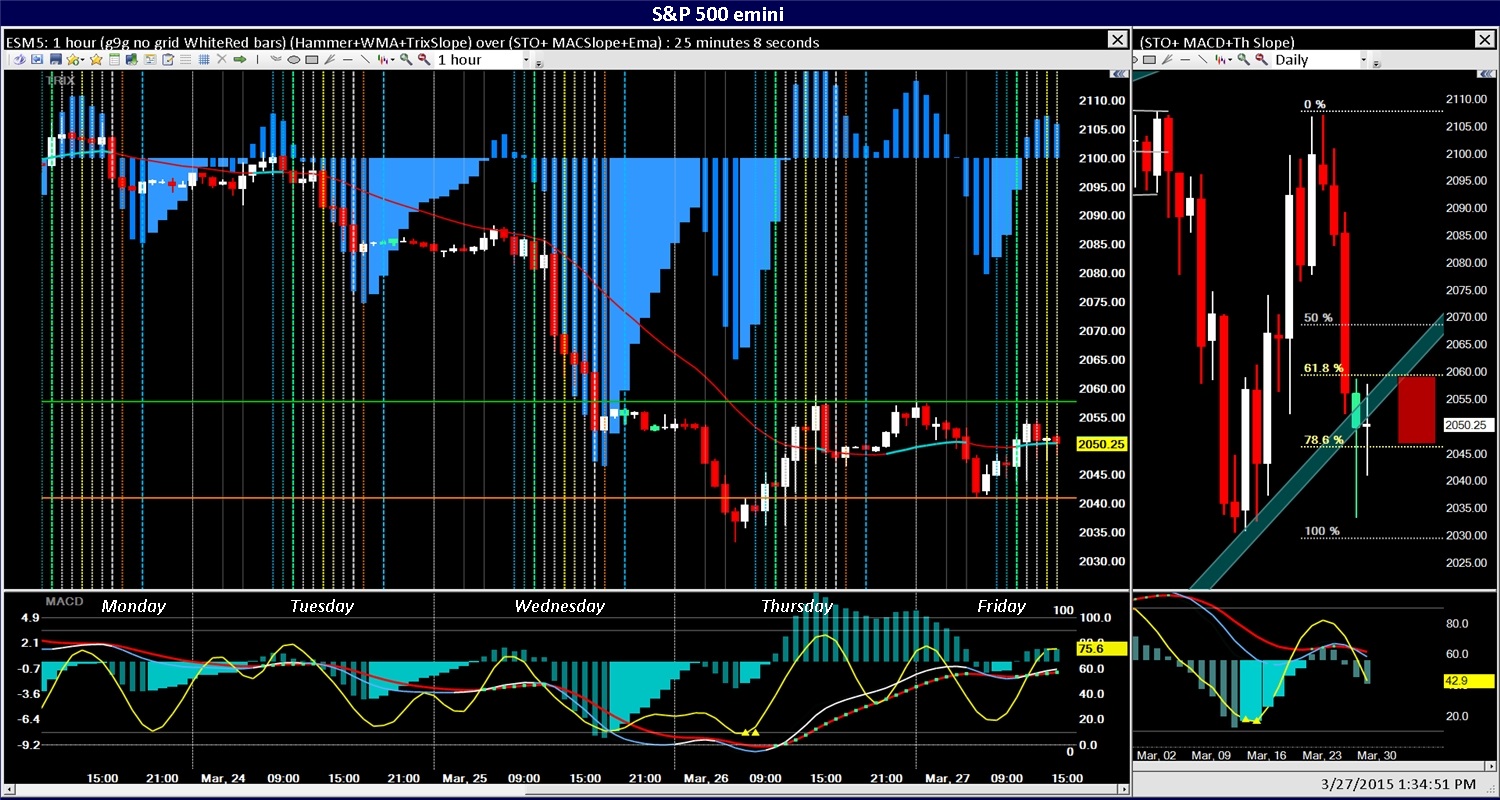


3rd week of March...
Turn around at the lower wedge lines ...

Friday's close suggested a pop for Monday's open...

6:00 pm Sunday - And it's off to the races...

March OEX entry for FOS trades ...
We had an accommodating pull back for this month's OEX entry after gaining on Thursday.
There are supportive technicals for this entry; stochastic is over sold, the MACD histogram slope is moving up
and the lower wedge line may provide support for a reversal of the move down from February's highs.
We shall see what happens for this Friday B4 OEX entry...March's 1st Monday entry was a disaster...

First week of MARCH...today's swoon is significant IMO.
Seems that the highly anticipated turn has finally come...the ides of March are upon us.
Rounded tops, MACD EMA cross and stochastic direction suggests more to come.
My targets are the 38% to 50% Fibonacci areas at the lower wedge lines, then perhaps on to the full BZ retrace levels (61.8% to 78.6%).


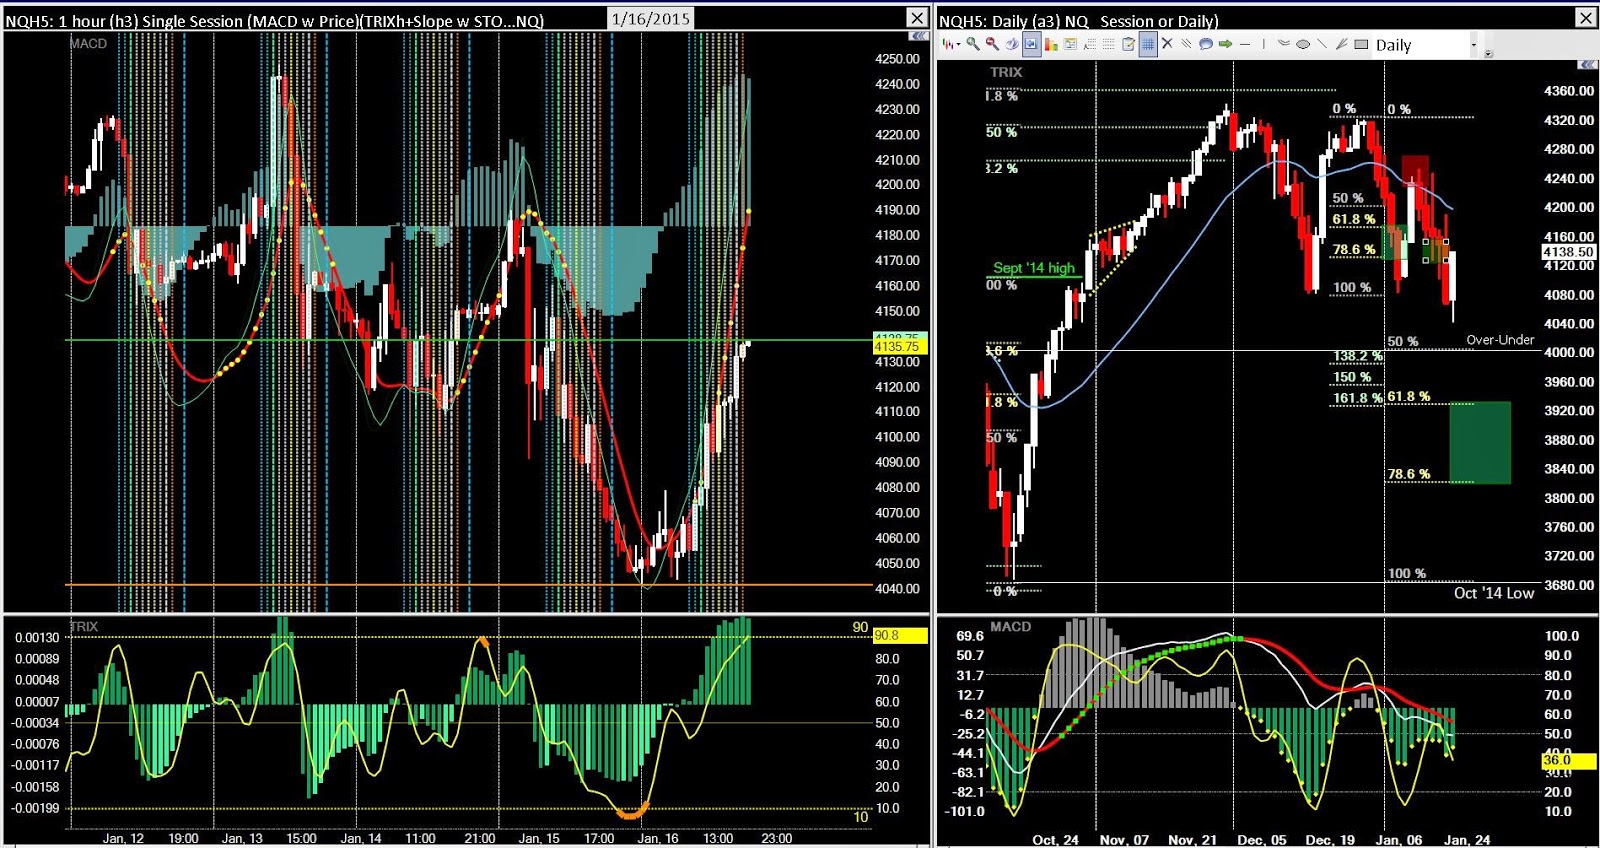
Jan 2015 - 3rd week
Another week, another reversal...We had the ECB QE news before the majors opened Thursday....


Also - this Monday will be the last of January.
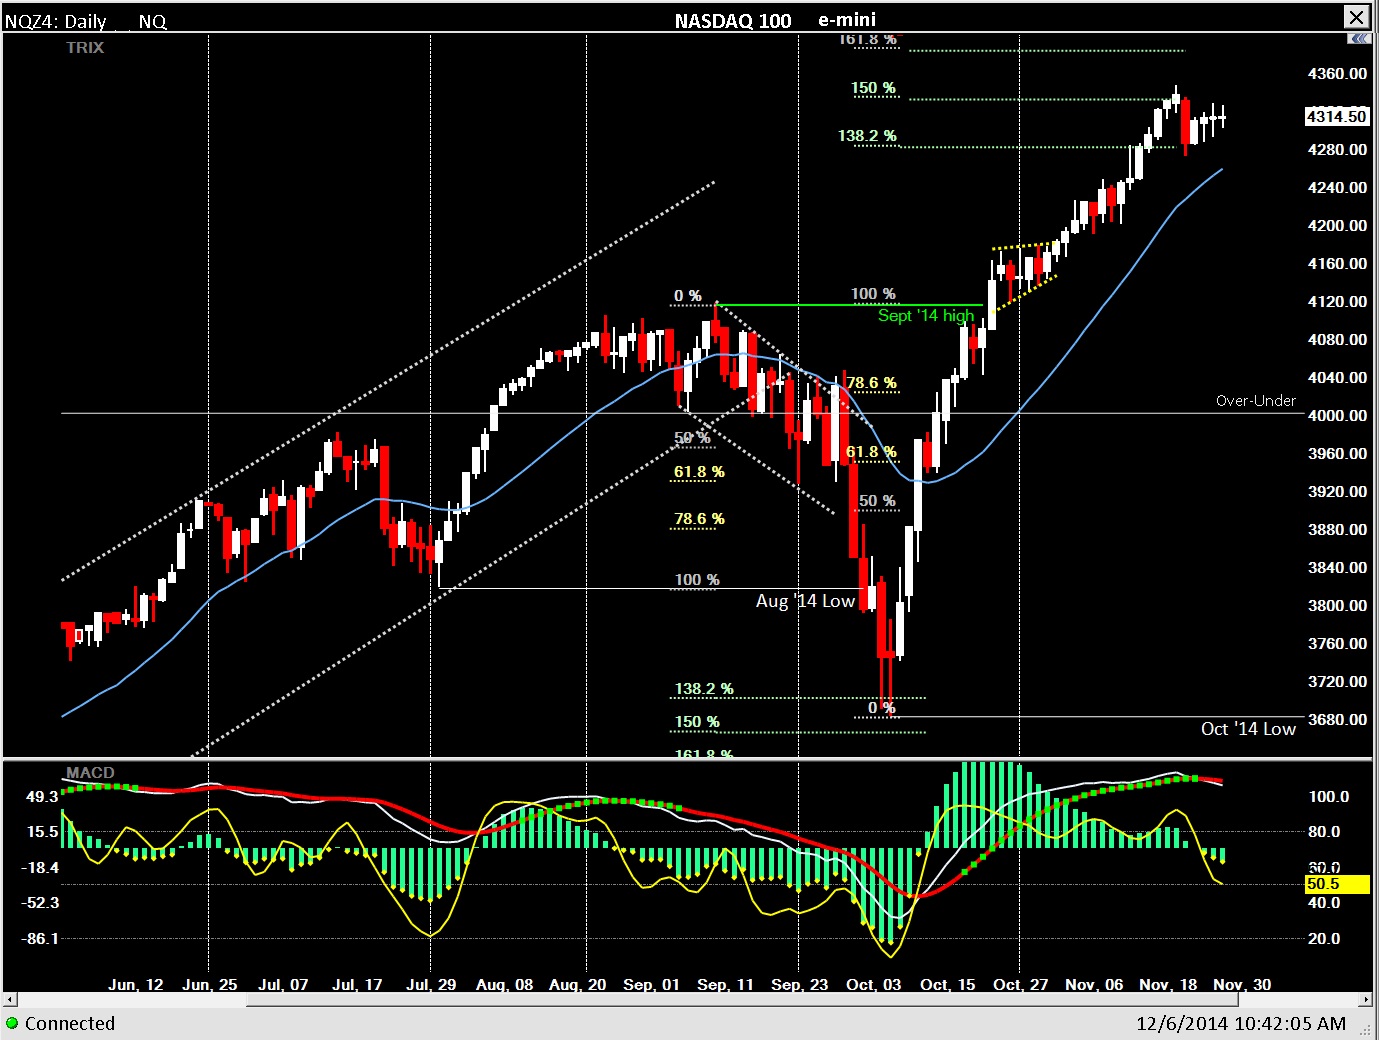
January 2015 - 1st and 2nd week charts
Interesting reversals for the 1st complete week of the year.
Session charts - the ES, YM and NQ had histogram divergences at the lows last Tuesday...the RUT did not.
On the dailies - all but the NQ rebounded 'perfectly' from their BZ retracements of December's High/Low runs...
The NQ overshot its BZ to print a divergent double bottom.
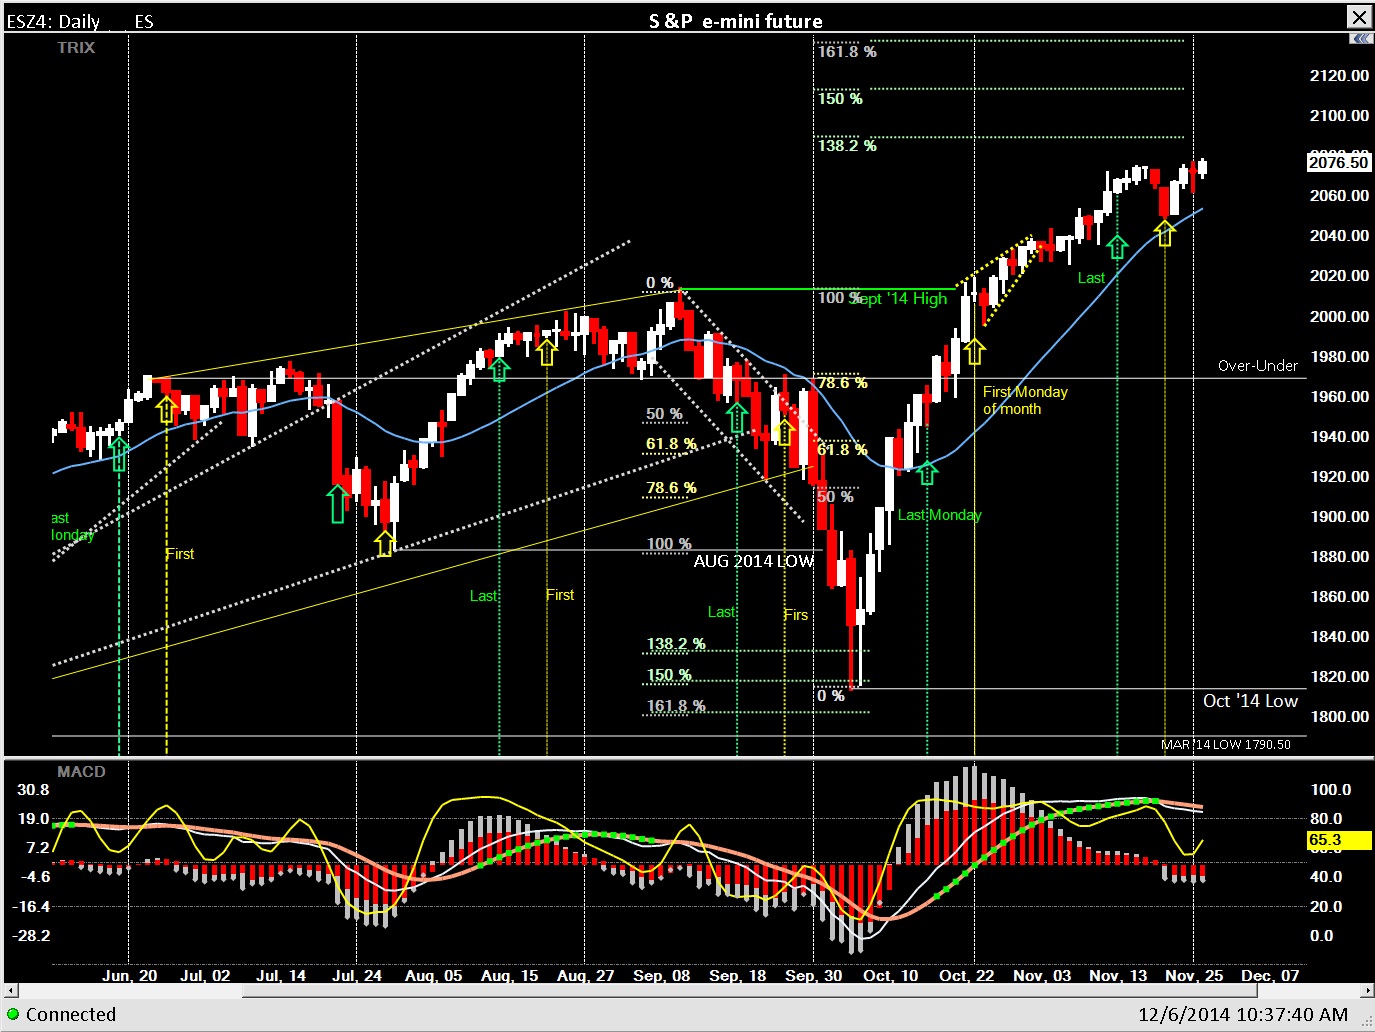
Below those charts are interesting reversals for the 2nd week...this time down. The ES and the YM have broken out
of their rising wedges and retested those levels Friday. Also interesting is that all but the NQ's retrace BZ areas (Oct to Dec run up)
co-inside closely with the Fibonacci extensions of the low to high runs of December.
1st week


2nd week


What a difference a day makes...(or week)
The NQ zipped right on thru it's 78% retracement of the former rally with the rest of the FUTs right on its heels.
Looks like 100% is within reach before we're oversold enough for any bounce.

December 12/31/2014 EOM
Ending the month with two down days...the YM and ES closing about where they started ...
The NQ closed lower while the RUT closed higher. All had mid-month swoons.


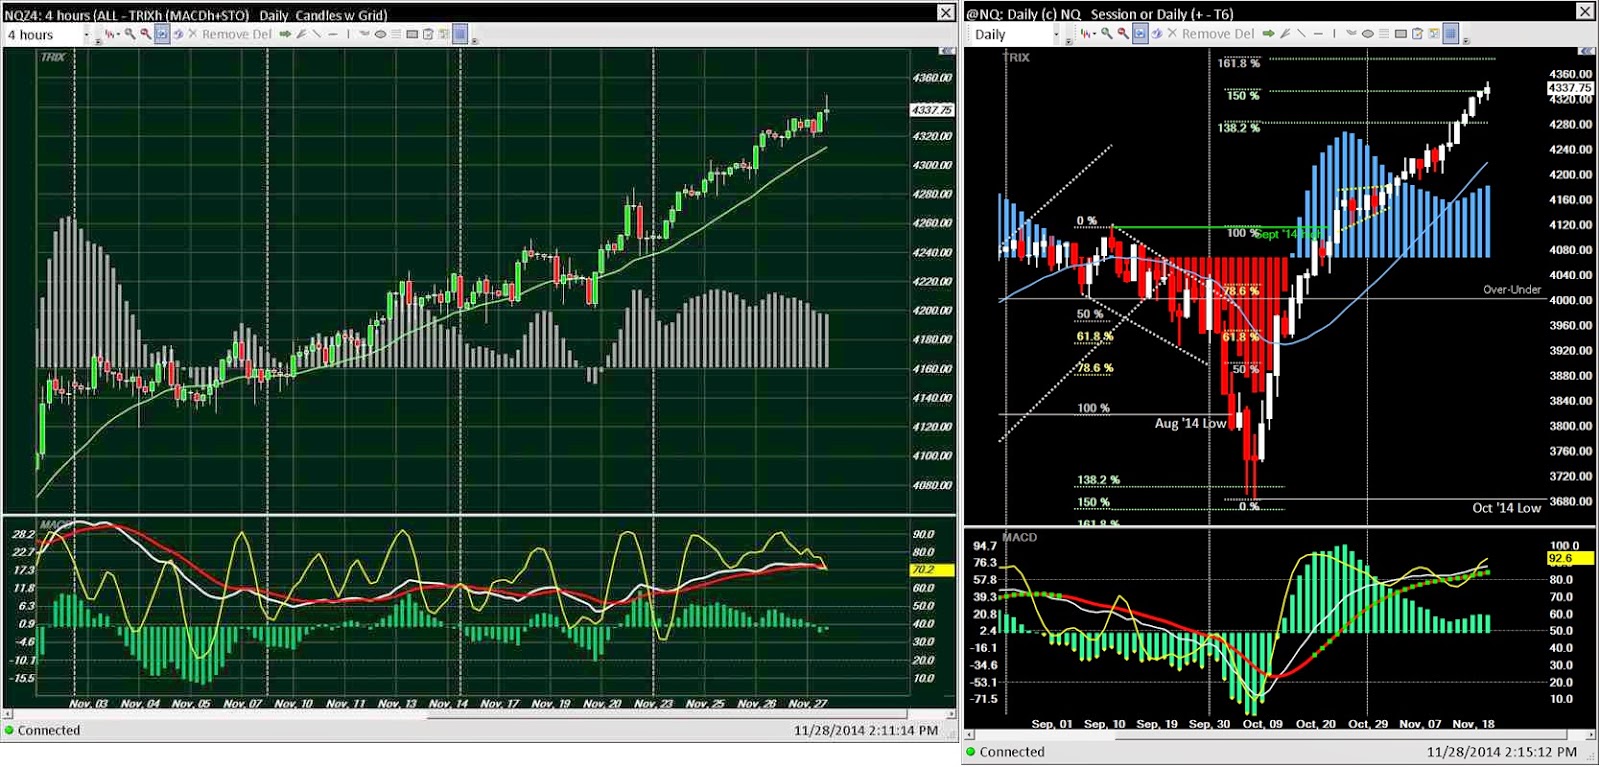
Here's the 4 hour-per-bar charts:


December 12/19/2014 EOW
Reversed last week's swoon with back-to-back long candles on Wednesday and Thursday.
One hour per bar for the week's sessions over the daily charts


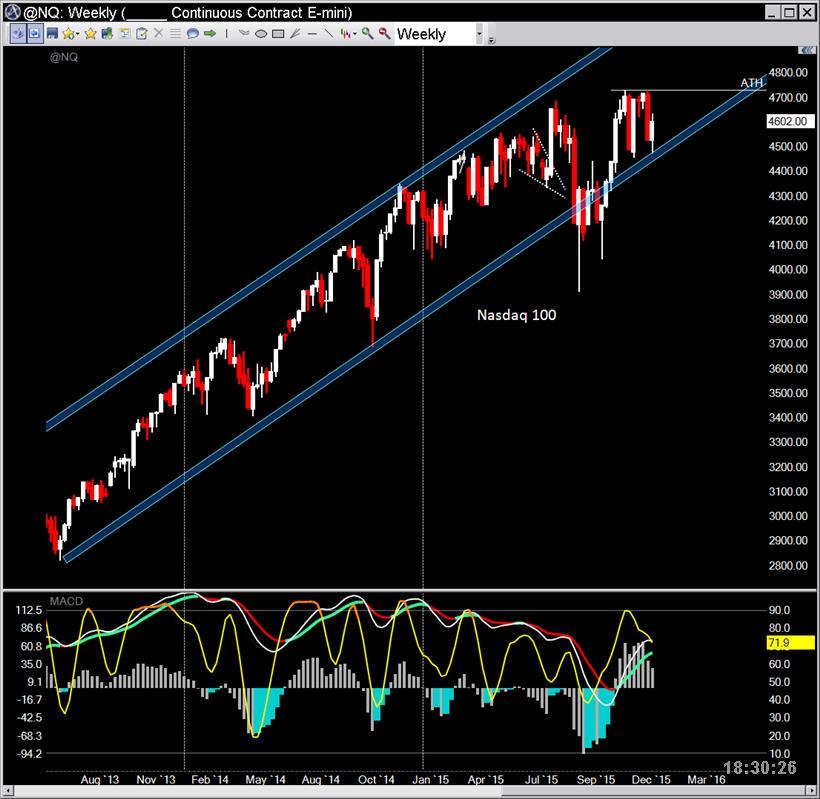
FUTs FIB EXTENSIONS - proxies for the majors...e-minis
The Nasdaq 100 and Dow Industrials have reached into their extension areas
with the S&P 500 not far behind.
So if they are leading, the Russell needs to do some catching up...
Bullish Patterns I see in them all:
I like the long tailed tweezer candlesticks at the October lows - very reliable patterns on any time frame.
Other bullish patterns that you can speculate about as to their validity are the multiple inverted H&S and 'V' bottoms.
I also find it interesting that the RUT's Aug top and Sept bottom both reversed with a Diamond pattern...
(they are supposed to be continuation patterns, not reversals - - aren't they?)


DEC '14 - First week of the month charts...
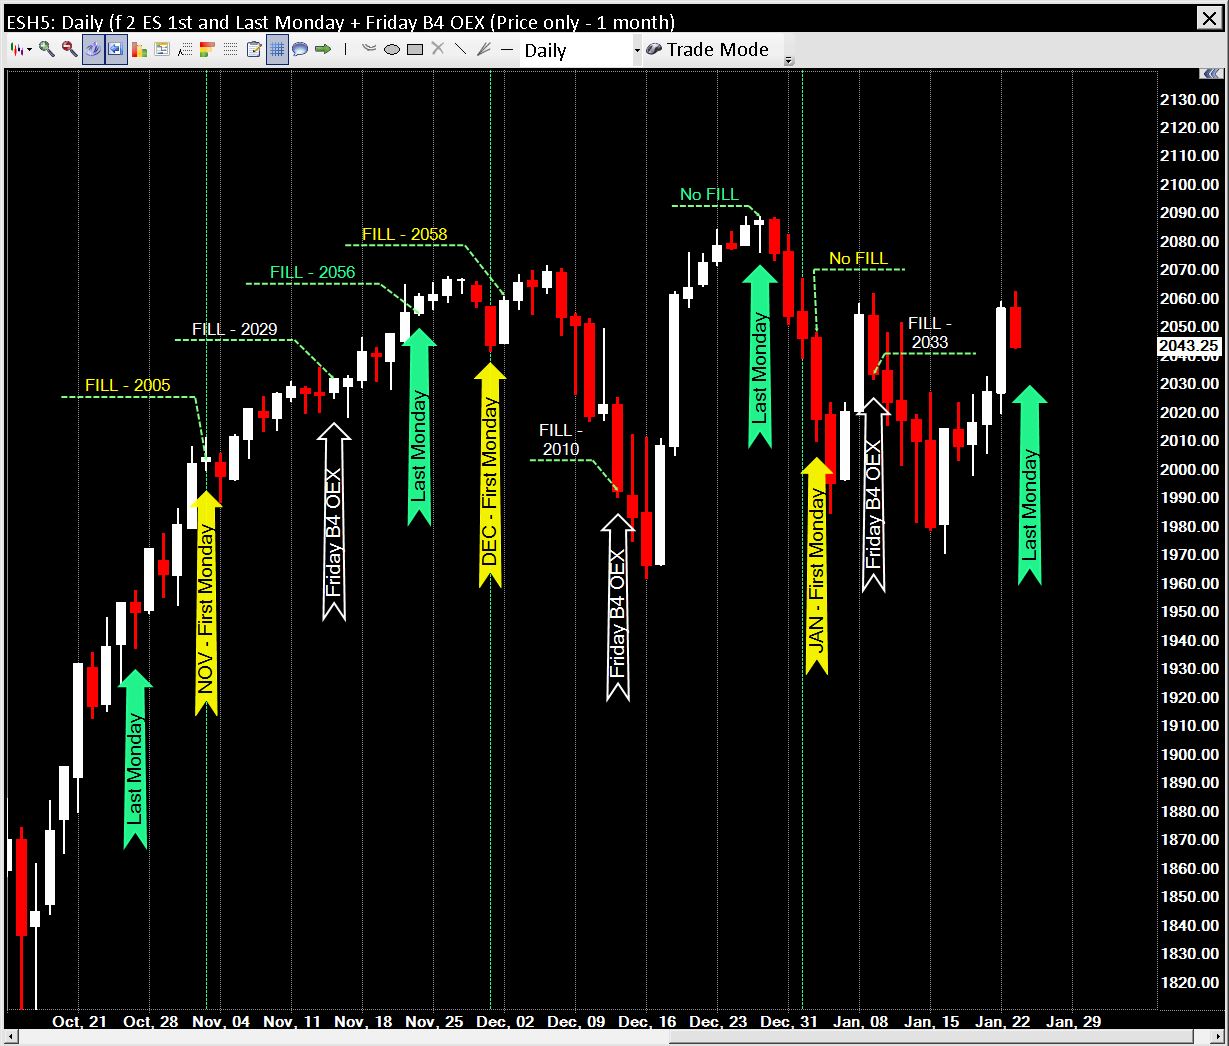
Also included Larry William's 1st & Last Monday plus Friday B4 OEX chart.


November 11/28/2014 EOM
Trended up all month except for the RUT...
4 hour per bar chart for the month combined with dailies for the ES, YM, NQ and RUT

.jpg)

NOV 21 2014 EOW - still making ATHs except for the RUT
OEX week and there was a bit of volatility, especially Thurs-Fri...
Combined daily and 5-session charts for the 3rd week of the month...


Mid-November and September's swoon is forgotten . . . October's recovery led to November's all-time-new-highs.
For the 1st week in November I drew flags on the RUT & NQ and ascending wedges on the YM & ES
correlating to NR7 patterns that completed last Monday.
The NR7 was suggesting a reversal might be in the works; Tuesday's overnight sessions looked like we were heading lower.
But the NQ and RUT both broke to the upside from their flags with the NQ leading a lonely charge up.
...the rest were basically sideways for the week.


Gaining back more than 60% of the Sept-Oct plunge, the ES and NQ leading with 3 white-soldiers...
YM and RUT lagging - recovering 50 %.
Didn't take very long albeit the gains came on lower volume than the down days leading into the selling volume climax...


October mid-month - if we have reversed - we need some targets...
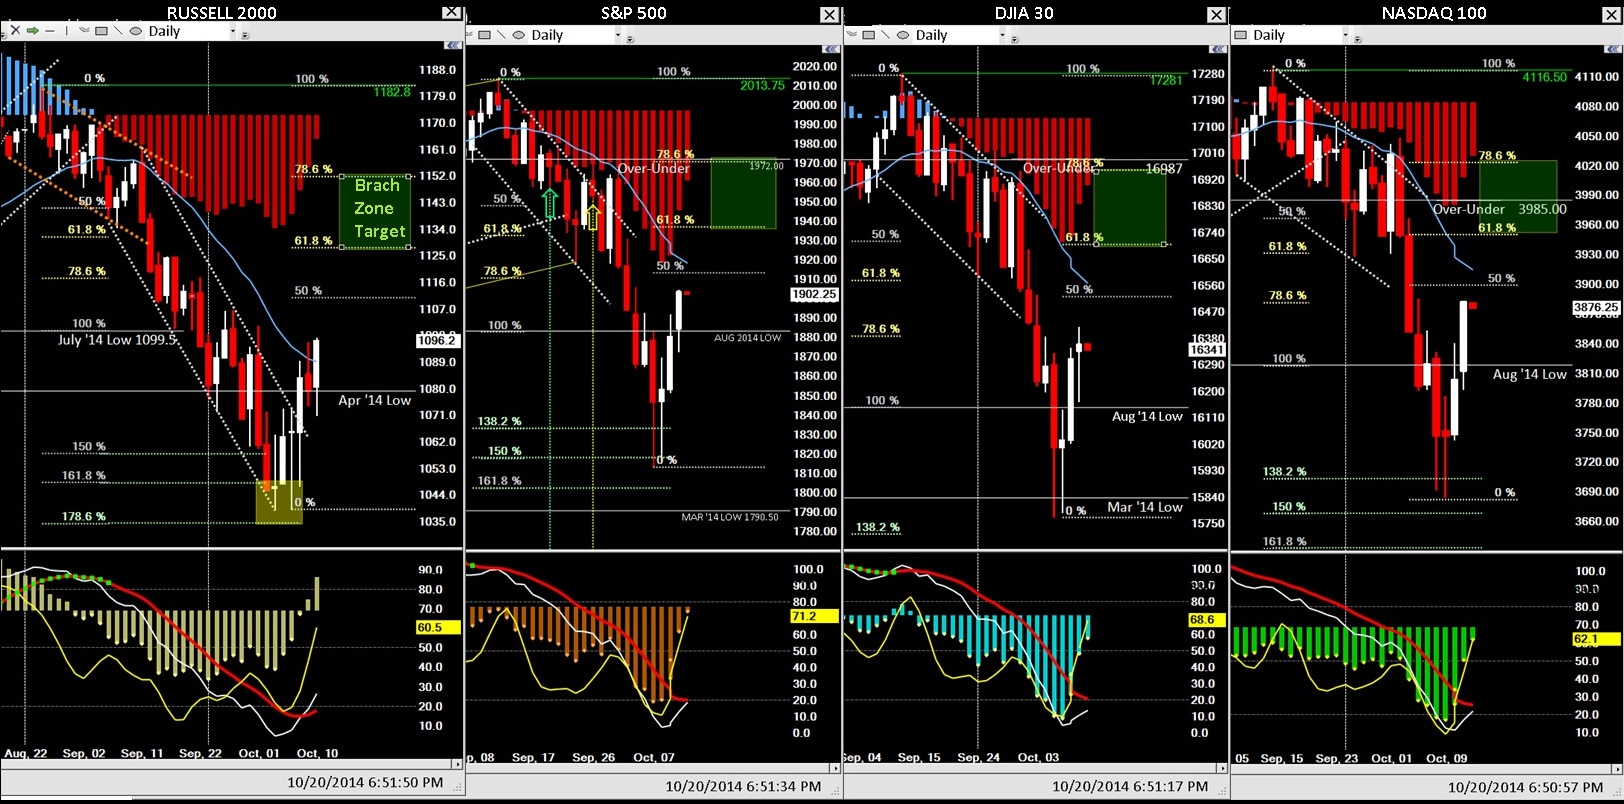
SEPT 2014
Daily thru the last week in September:

4 hour charts for the last week in September:


FUTs daily patterns - megaphones, double-bottom and channel break
Nice week, eh?
ES's mega-phone is perfect...above the over/under line and heading back to 2000-ish.
YM's is not as perfect but price is back above the over/under.
RUT's double bottom makes it 3 of 4 bullish pattern possibilities...
The NQ broke down, testing it's lower channel support line...but is back above it.


AUG 2014 EOM
First the 5 session tick charts showing the last week in August...the FUTs spent the week in relatively narrow ranges


But the 4 hour per bar charts for the entire month show the strong rallies/recoveries, trending up for the last three weeks...


Short term daily charts...

Tough day at the salt mines...excuses excuses excuses

JULY 2014 EOM
YM & ES dropped month-over-month in the last week.
NQ about where it started the month and the RLM has been dropping all month.
4 hour/bar for the month ...


Dailies to date...


JUne 2014 EOW 1st week of the month
5 session tick charts
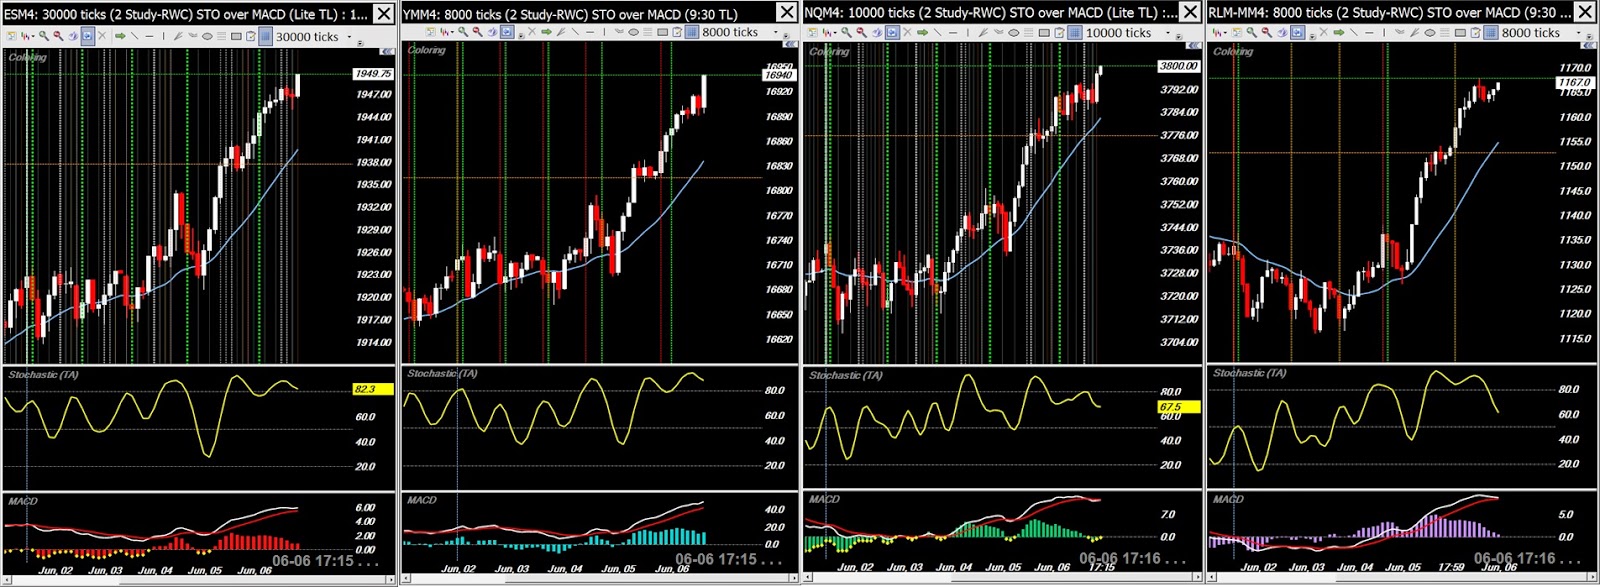


1st week of June - 1 hour charts:


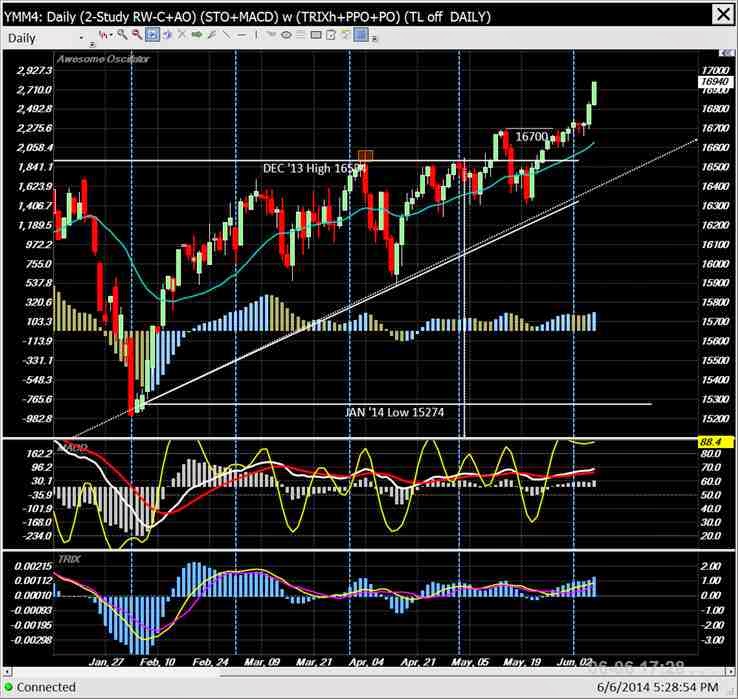
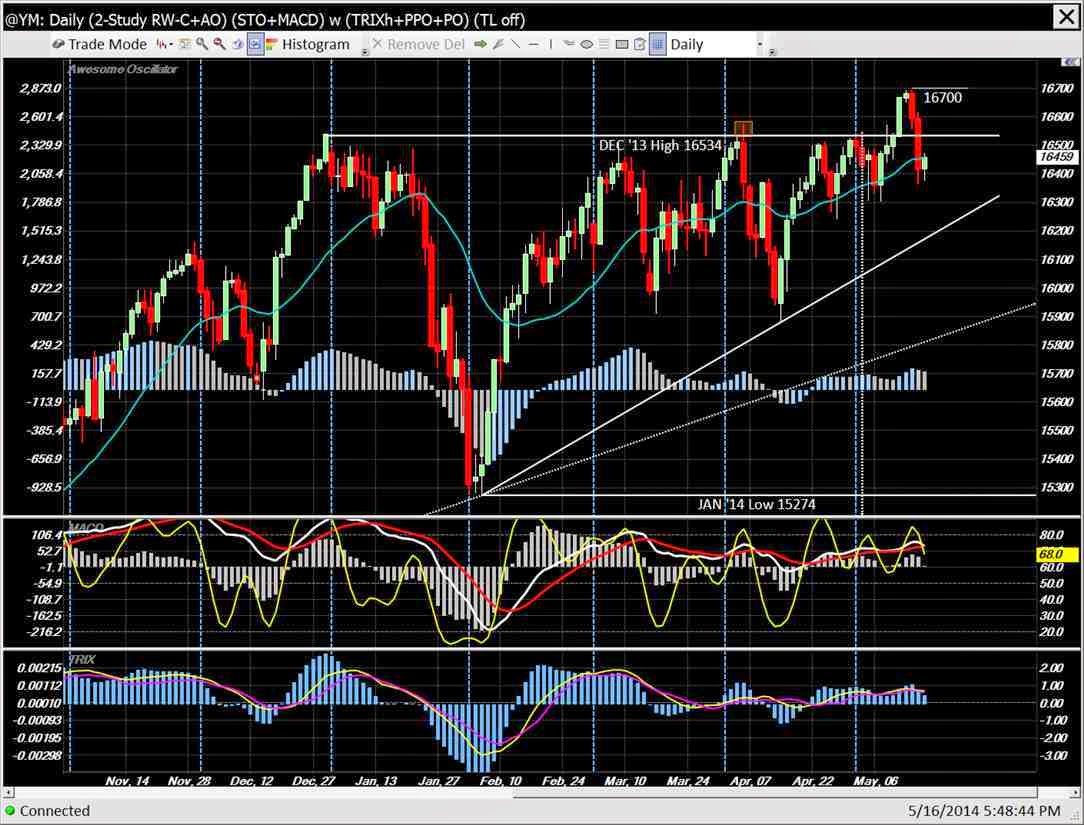
1st week of June - 6 month daily YM
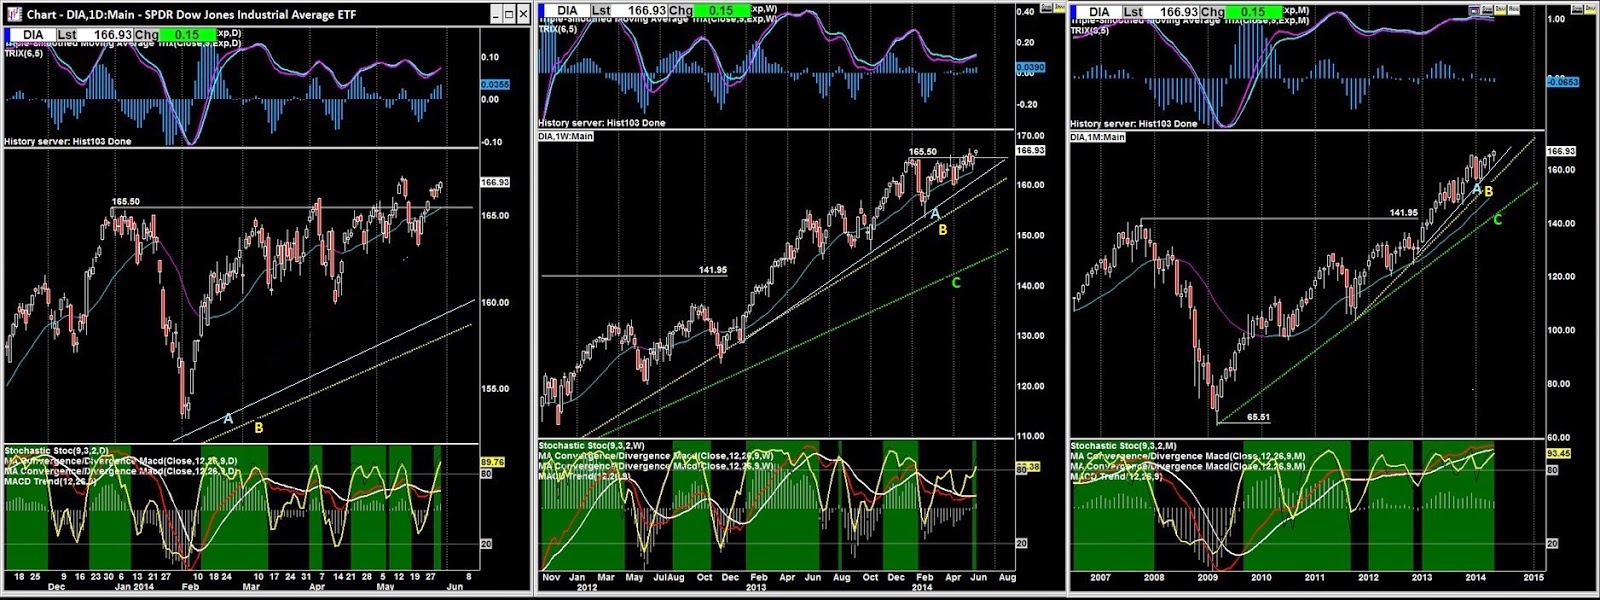
2014 YTD - Daily, Weekly, MONTHLY ADD'l Charts for perspective
Using ETFs as proxies for their respective Indices and Futures because my futures data does not go back far enough...
Comparing trend lines spanning approximately 1 year. 2-3 years and 5+ years since 2009's low.


May 2014 EOM . . . . . .
4 hour charts spanning May's activity...The four Futures markets I follow were all up from April's levels...
So much for "Sell in May and go away" this year.


Here's the 3 month continuous contract dailies ... The YM and ES are still chugging along, the NQ has rebounded
nicely from April's low but the RLM is lagging...
Stochastics show that all are over-bought and due for a correction to start June off...


May 2014 EOW 4th week of the month
5 session tick charts


4th week of May - 1 hour charts:


4th week of May - YM 6 month daily

4th week of May
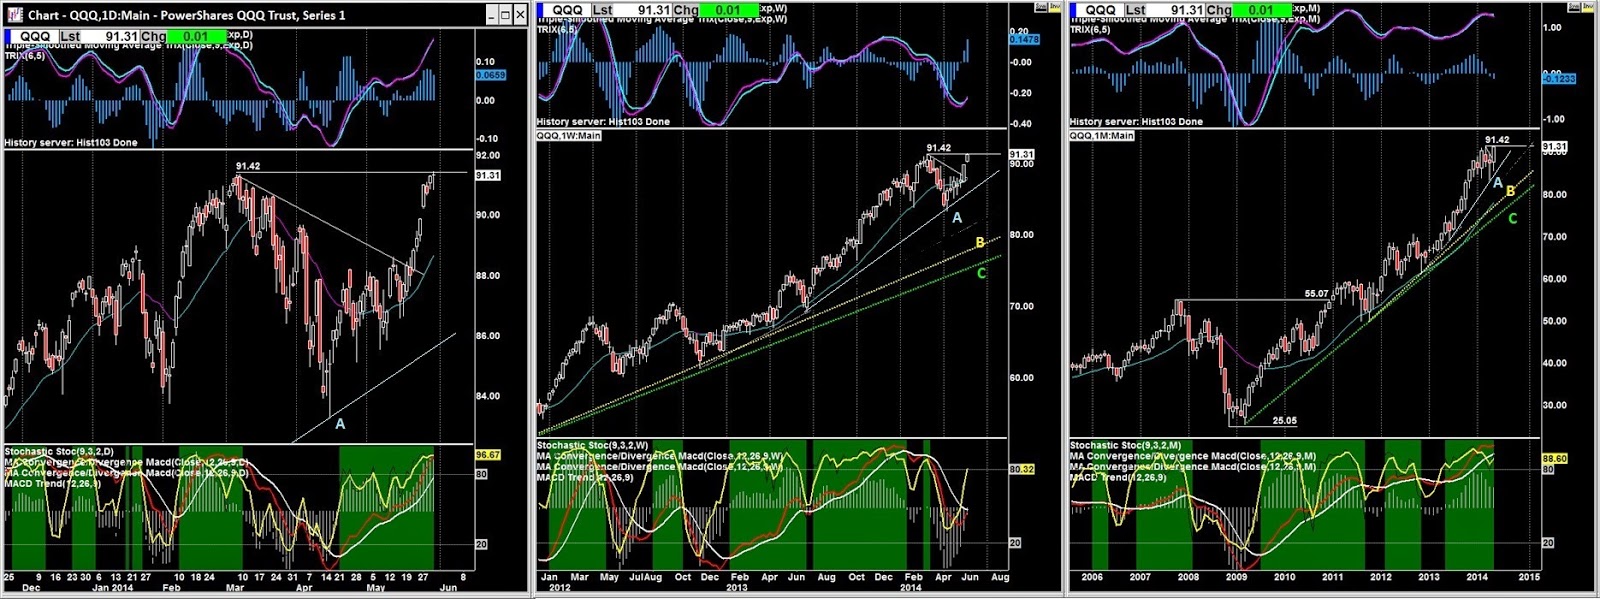
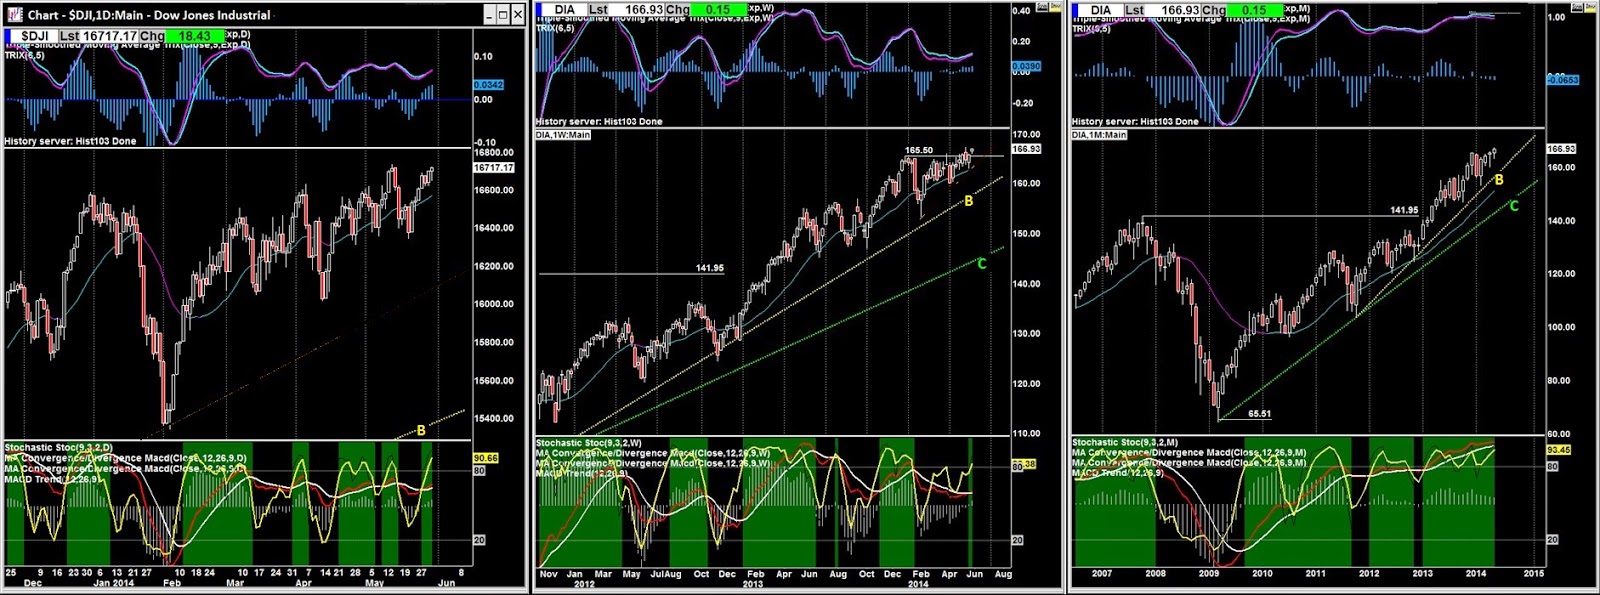
ETF as proxies for their indices - Dailies followed by Weeklies...
Comparing price action since JAN/FEB's lows, the YM and ES pretty much held the line while the Q's and IWM sold off thru APR/MAY...
The QQQ has recovered nearly all its drop. Perhaps the IWM/Russel 2000 might be a better play if you're summer-rally-bullish...
I'm thinking the markets are anticipating a government sea change this November...Out with the liberal anti-capitalist government
of the past 6 to 8 years...America seems to be getting fed up with their idiot socialist agenda games...
If there is to be a summer rally this year it may run thru the elections


May 2014 EOW 3rd week of the month
5 session tick charts


3rd week of May - 1 hour charts:


3rd week of May - YM 6 month daily
3rd week of May - ETF dailies
May 2014 EOW 2nd week of the month
5 session tick charts


2nd week of May - 1 hour charts:


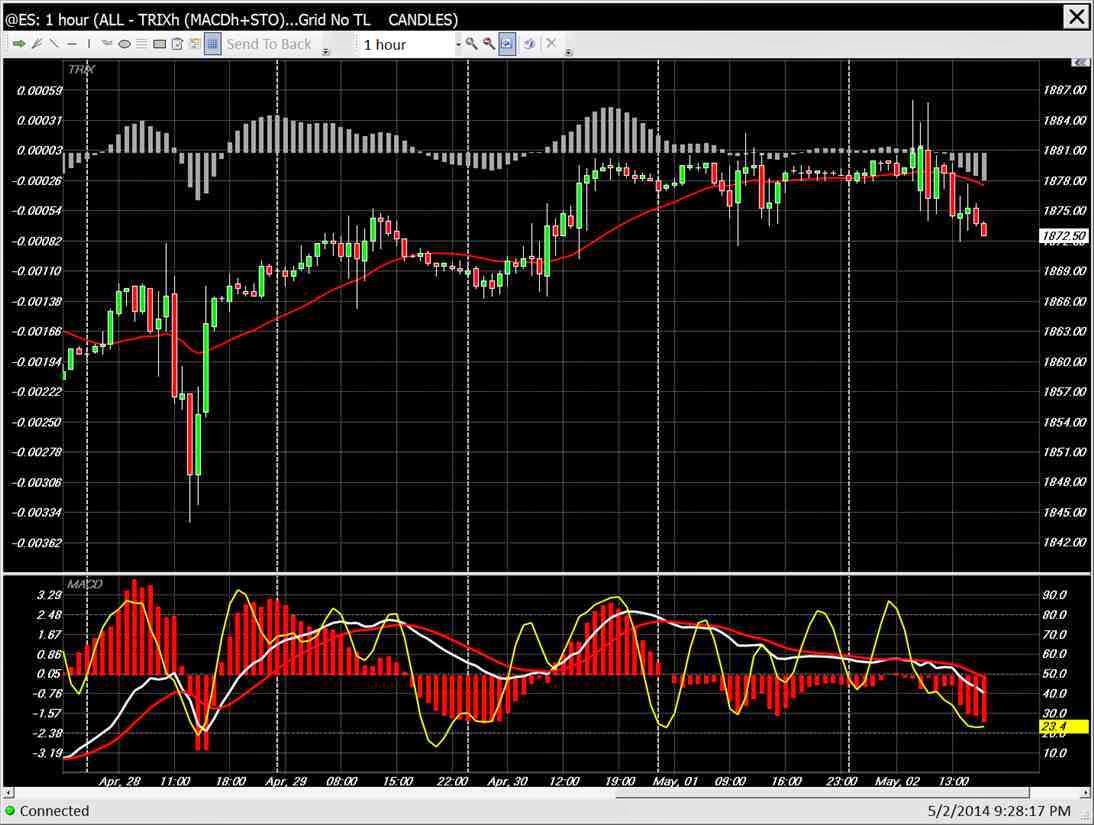
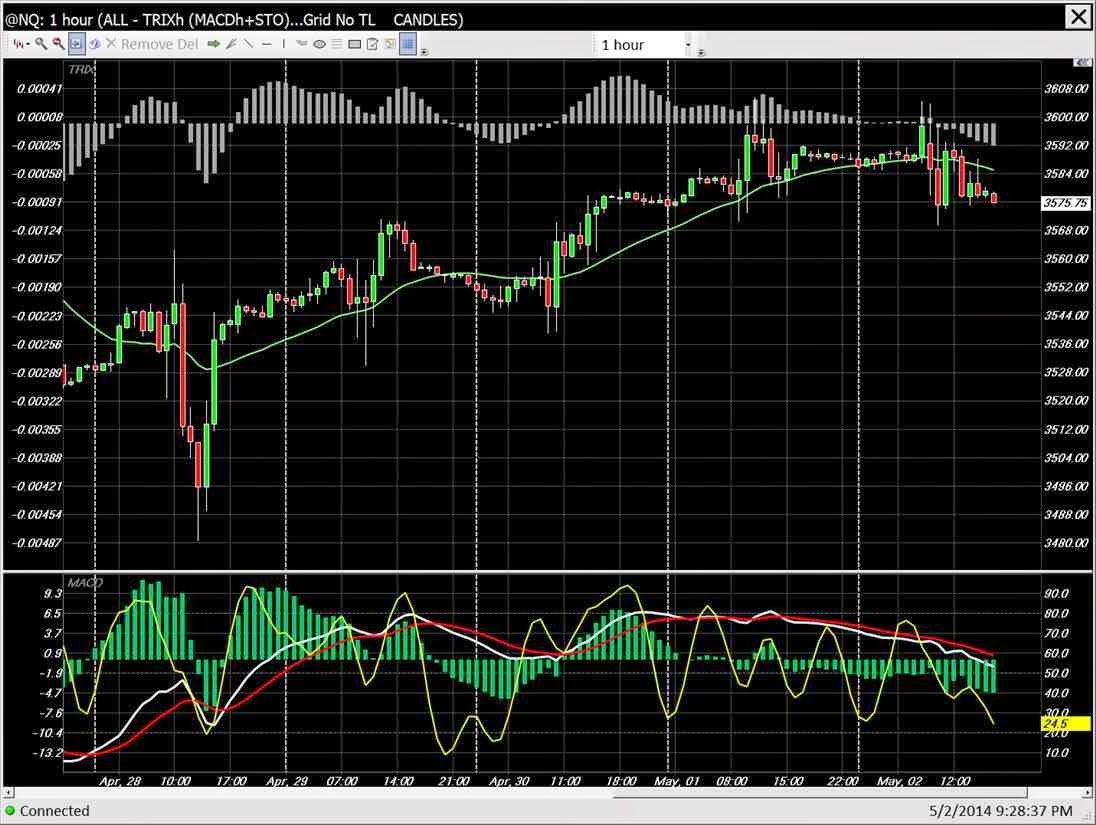
May 2014 EOW 1st week of the month
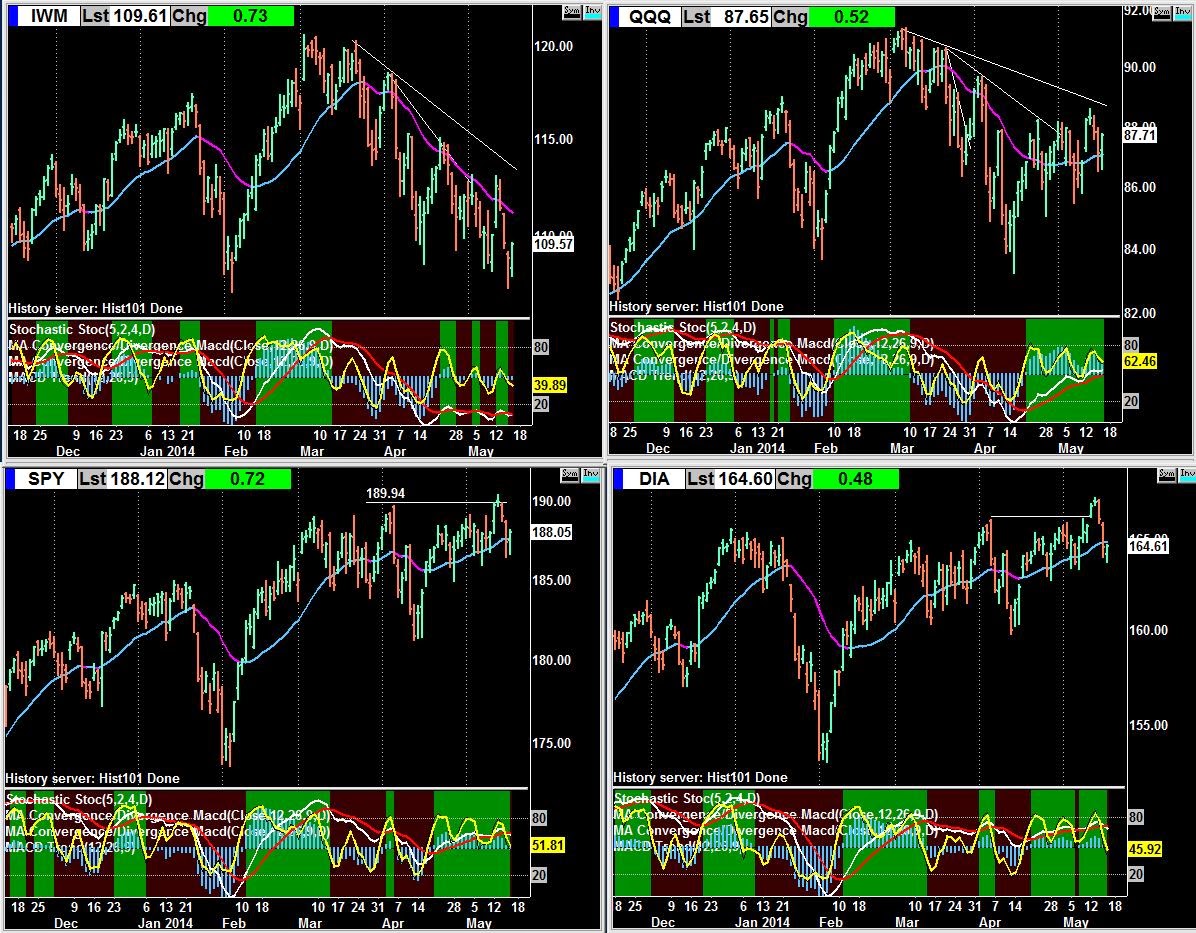
One day sessions - Friday's patterns...bullish wedges in 3 of 4 markets (5 wave?)...the NQ is doing its own thing...


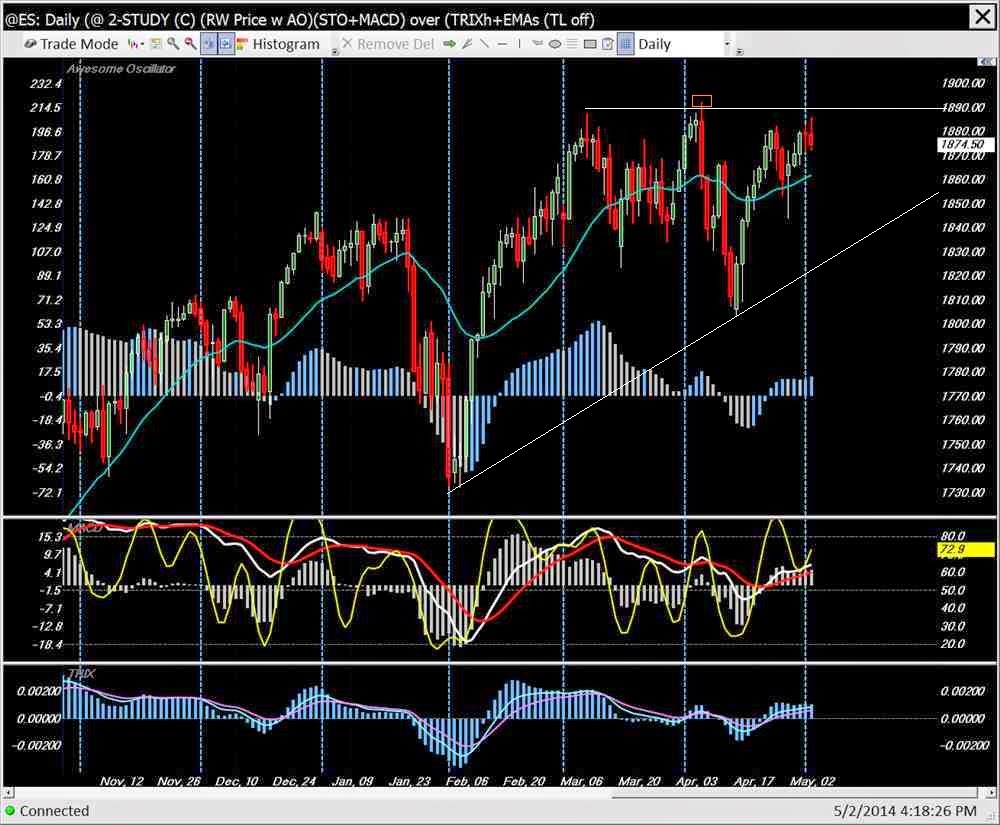
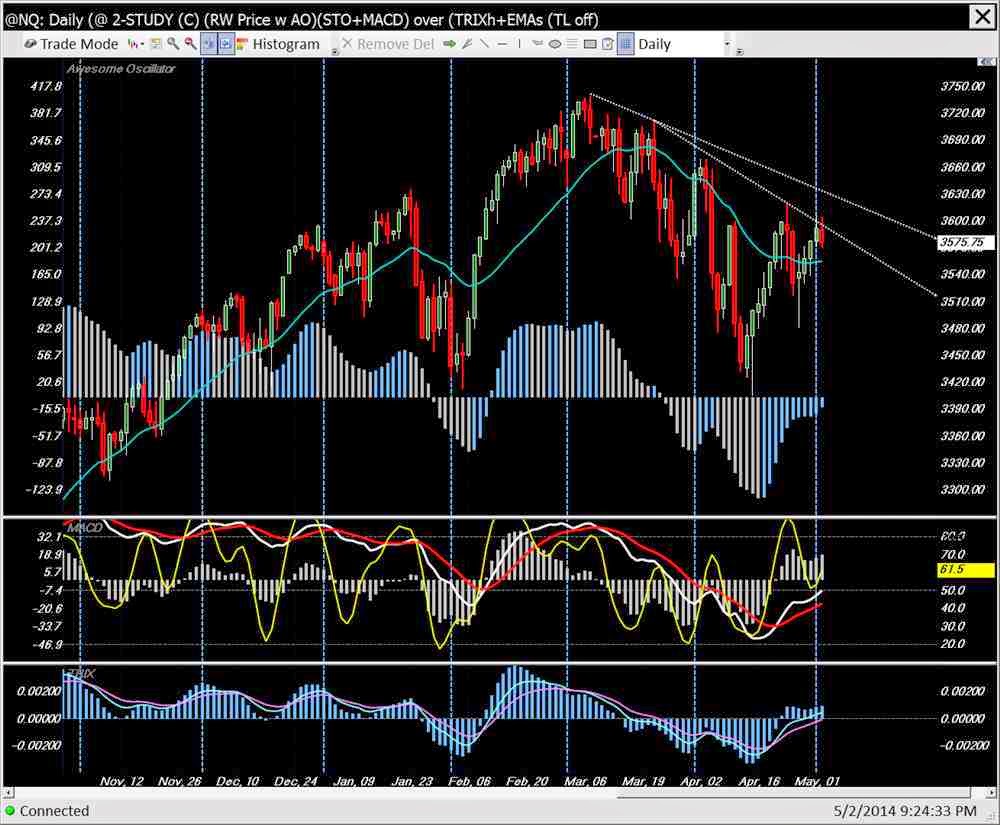
1st week of May - 1 hour charts:


1st week of May - bullish patterns on 2 of 3 FUTs six month daily charts.

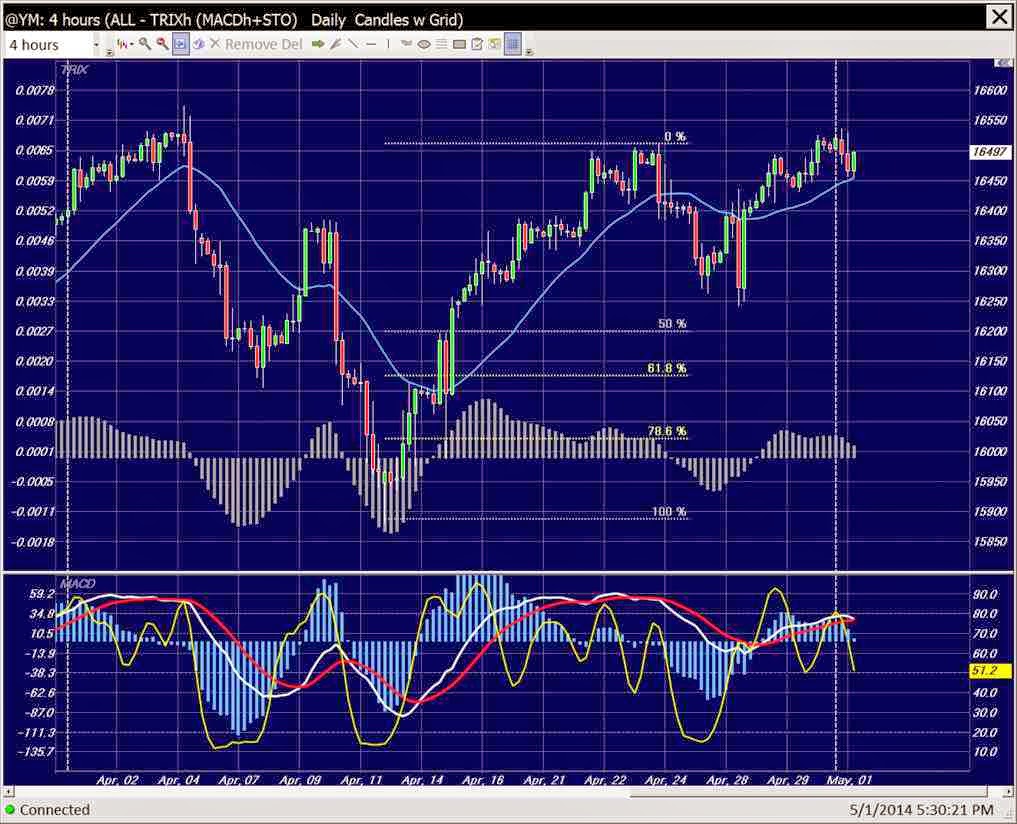
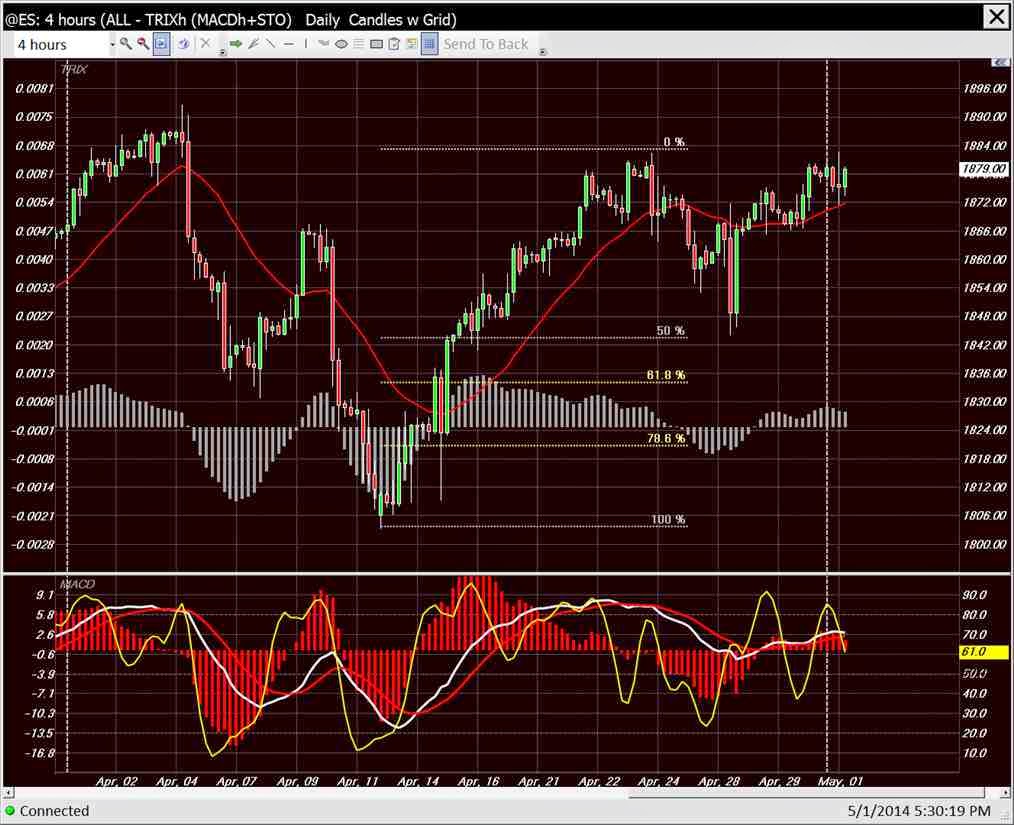
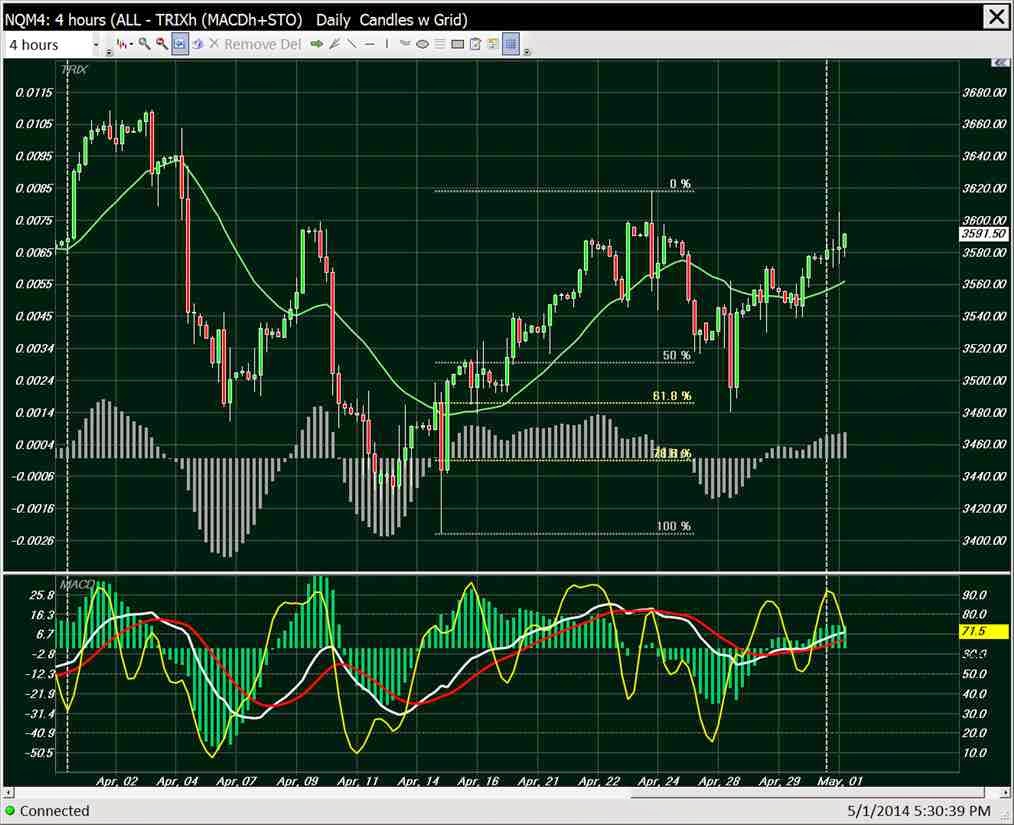
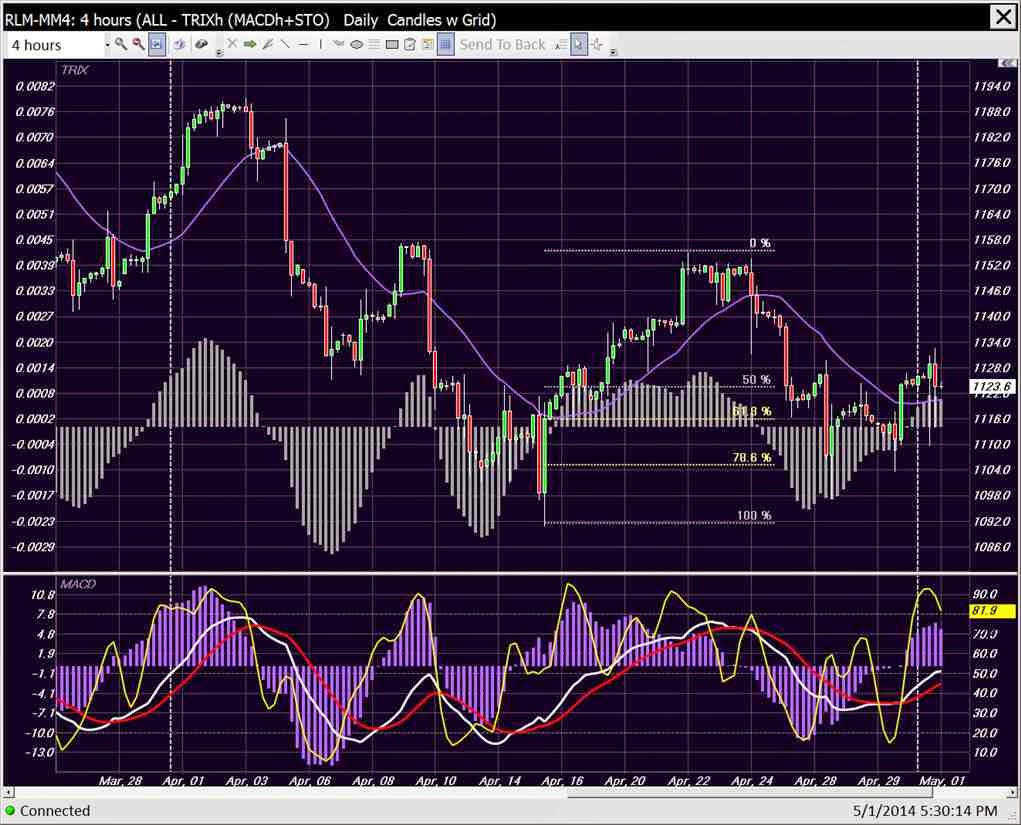
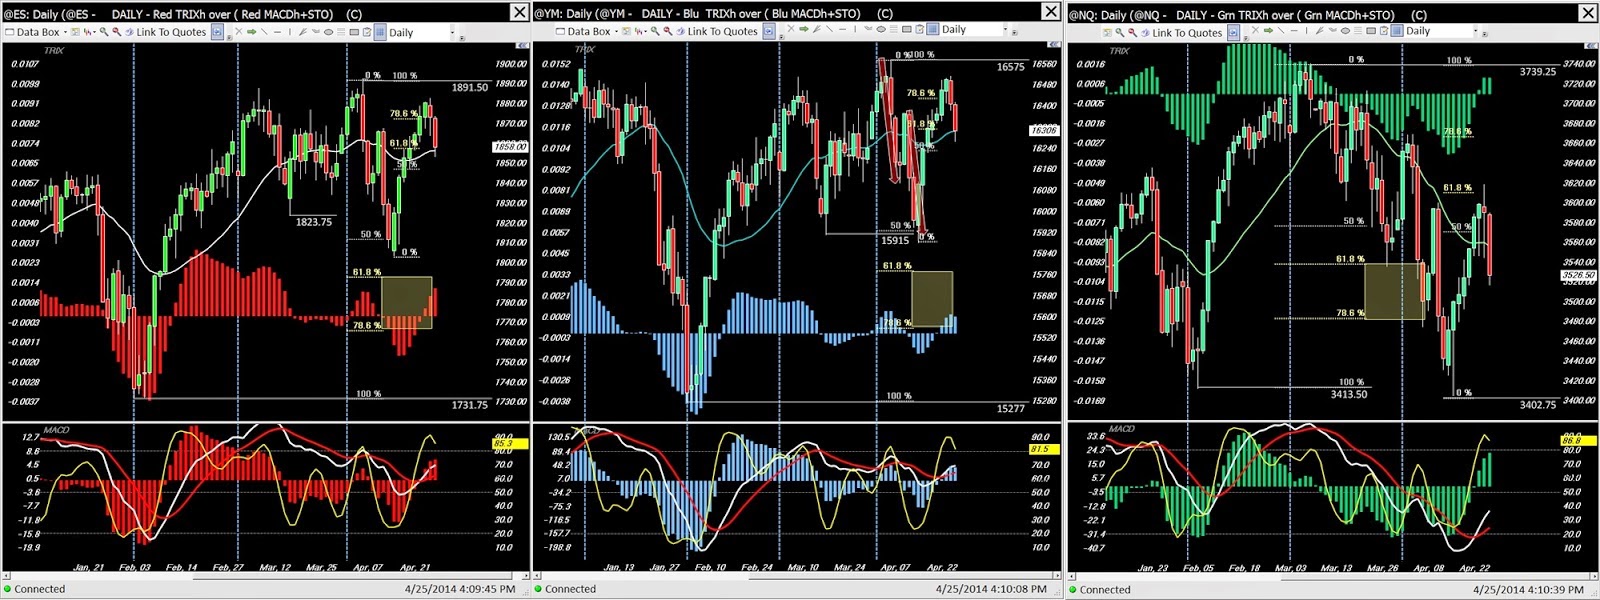
April 2014 EOM . . . . .
4 hour bars spanning April.
The YM, ES and NQ basically unchanged since March with the RUT down a bit...
April 2014 EOW 4th week of the month
Mostly sideways until Friday...
First the DOW followed by the ETF index proxies showing what happened this week.

4 th week of April...60 minute over tick charts for comparing the 5 days...


4 th week of April...Daily futures charts
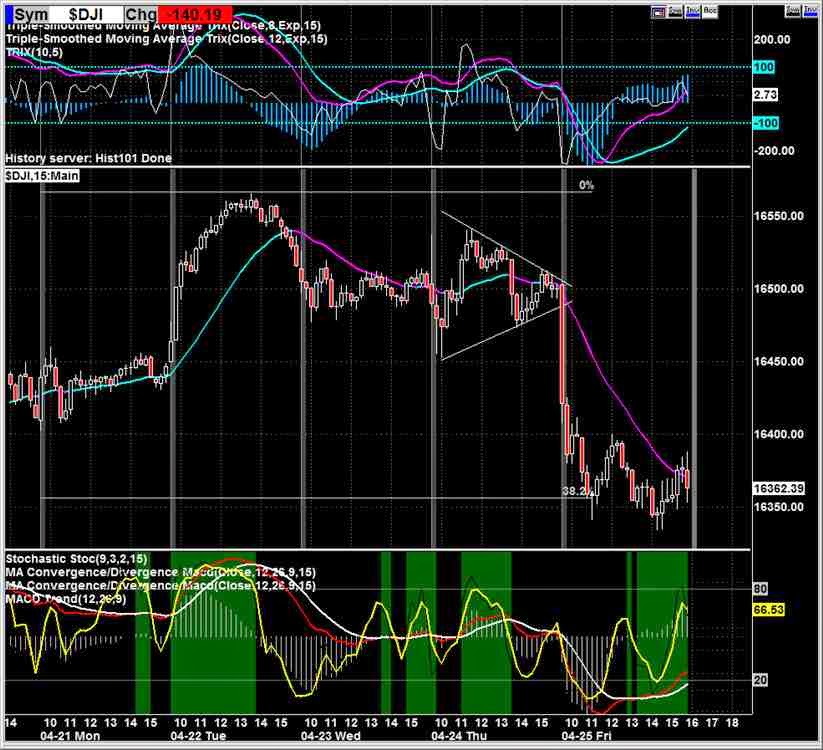
April 2014 EOW 3rd week of the month
...short week due to Good Friday.
Nice retrace back to last week's highs in the DOW -
It took 2 days to sell off and all 4 days of this week to recover.
3rd week of April tick charts


3rd week of April minute based

The ETF proxies for the 3rd week of April

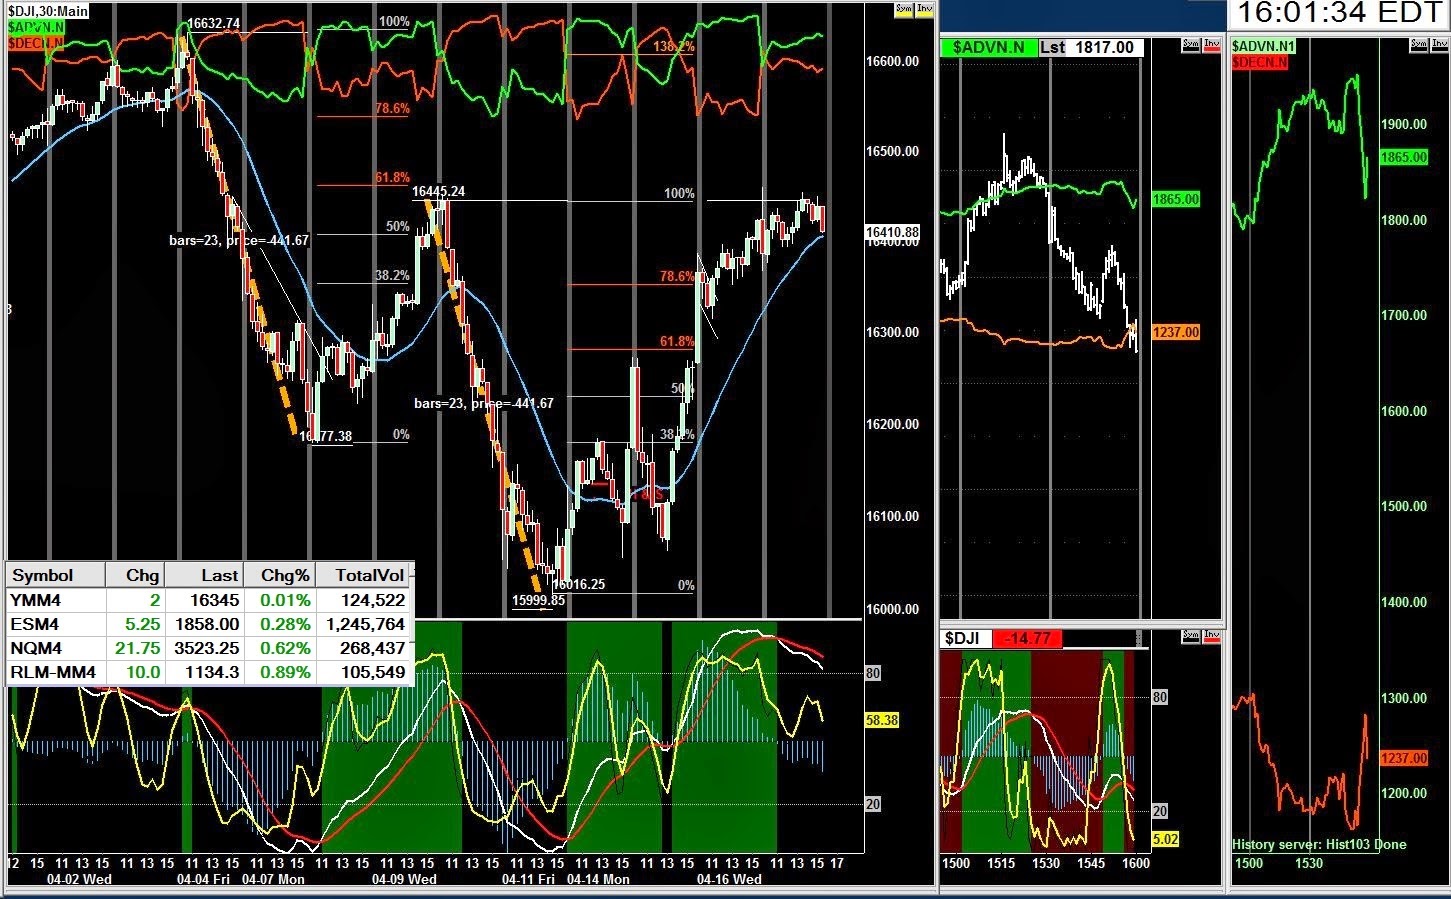
April 2014 EOW 2nd week of the month
Coming off last week's decline the FUTs rallied Mon-Tues but were not able to completely reach into their
Brach Zone retrace levels on Wednesday before dropping further Thurs-Fri.
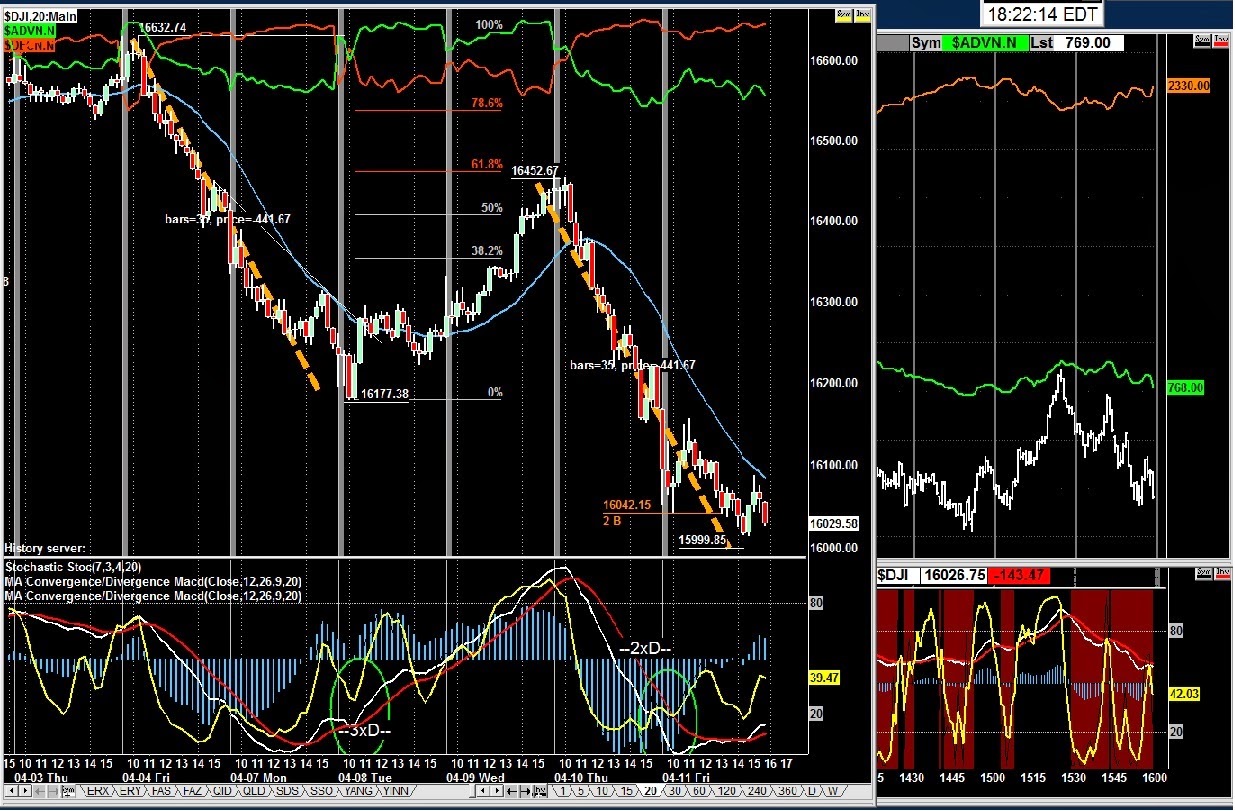
The DOW completed a measured move down to 16000. Hard to gauge whether we bounce a bit from here due
to the indicator divergences or if Friday was just a pause in a bigger drop to come.
2nd week of April minute based charts


April 2014 Add'l charts . . . .
Just found the differences between Leaders/Laggards interesting...
4 sets of 2 charts each, roughly 2 weeks of sessions followed by 3 month dailies.
If these are leading...

then these are lagging...

But who's leading whom?
Does not dropping as much or as fast count as leading?
Since March, The NQ & RLM printed LL's and LH's, the very definition of downtrends...

while the YM & ES printed new highs...

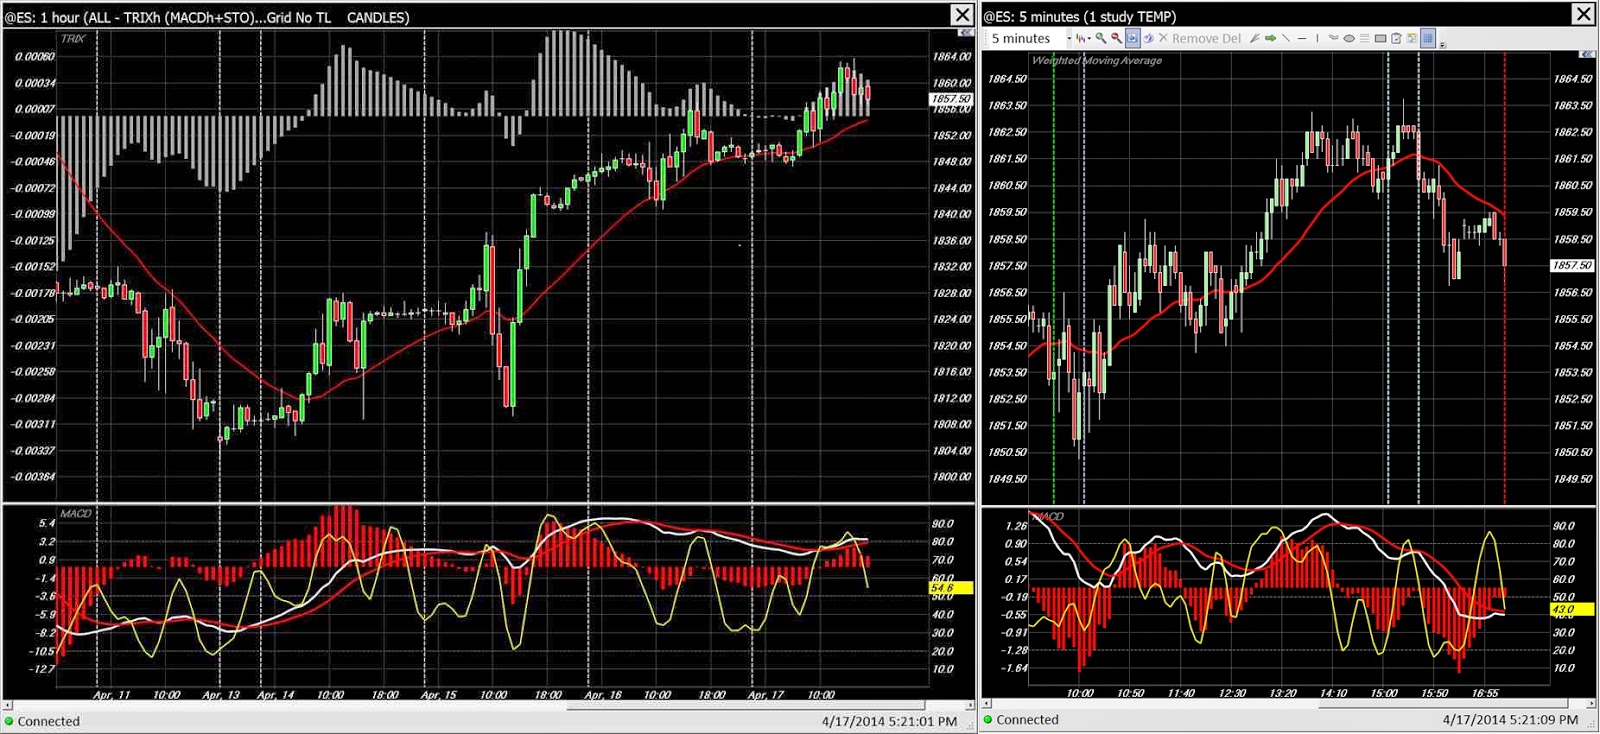
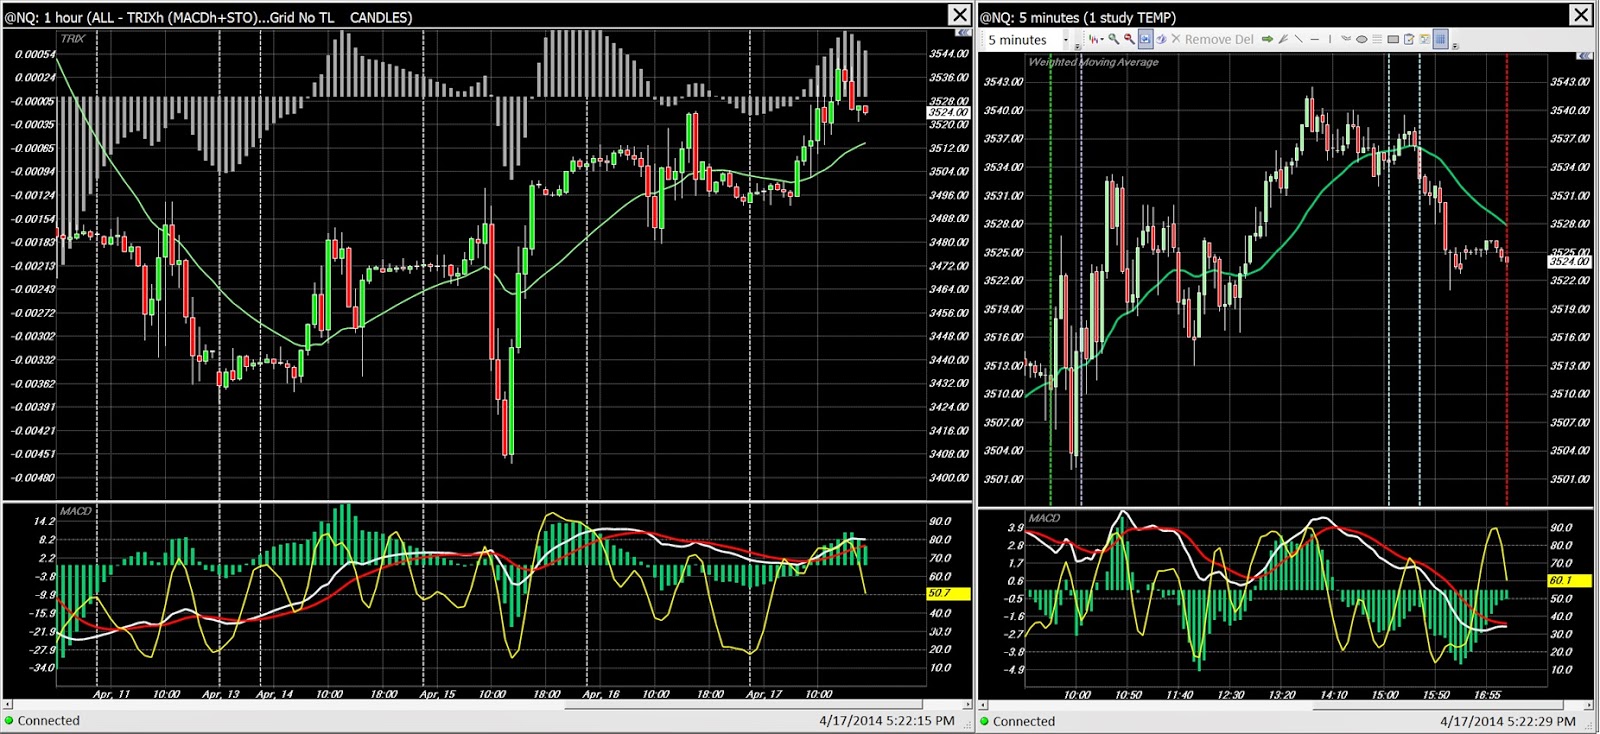
April 2014 EOW 1st week of the month
Mixed week with the ES and YM ending slightly above last week, NQ and RLM slightly below...
Friday was a very active day relative to the rest of the week (note the horizontal widths between sessions).
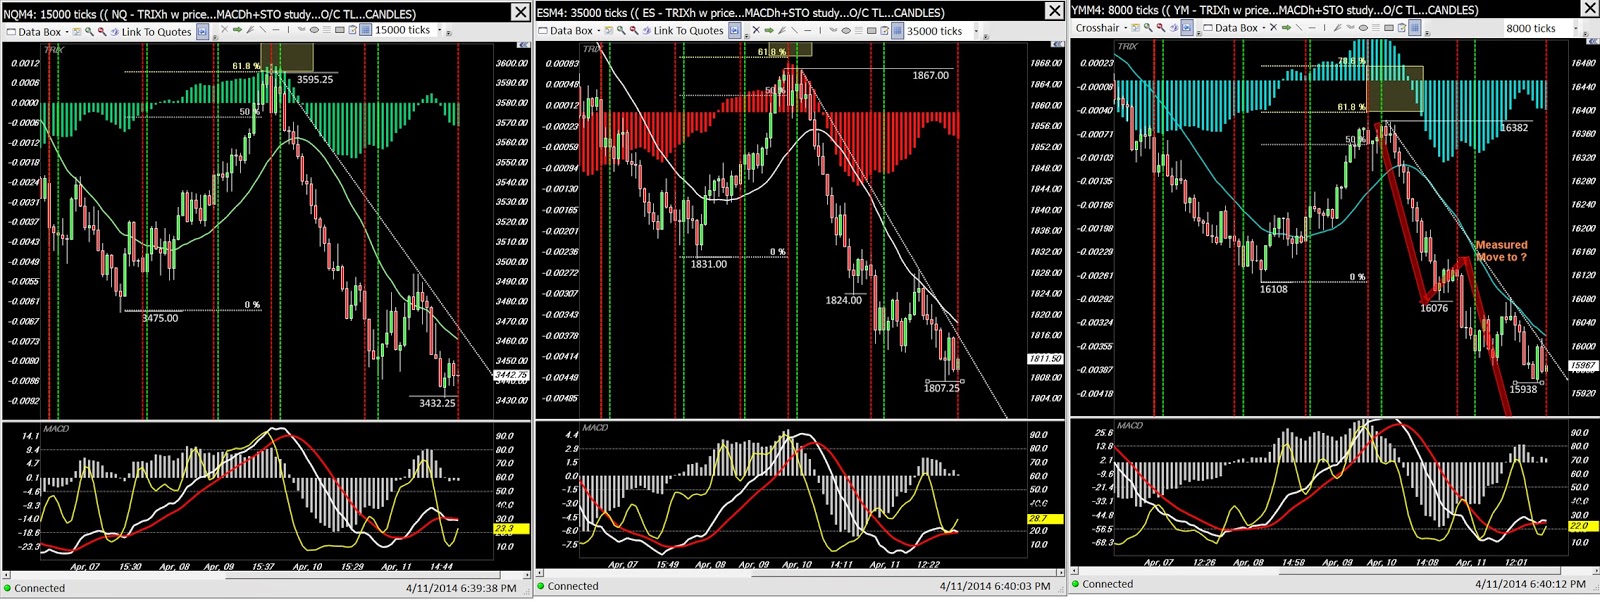
Tick charts:


1st week of April minute based charts


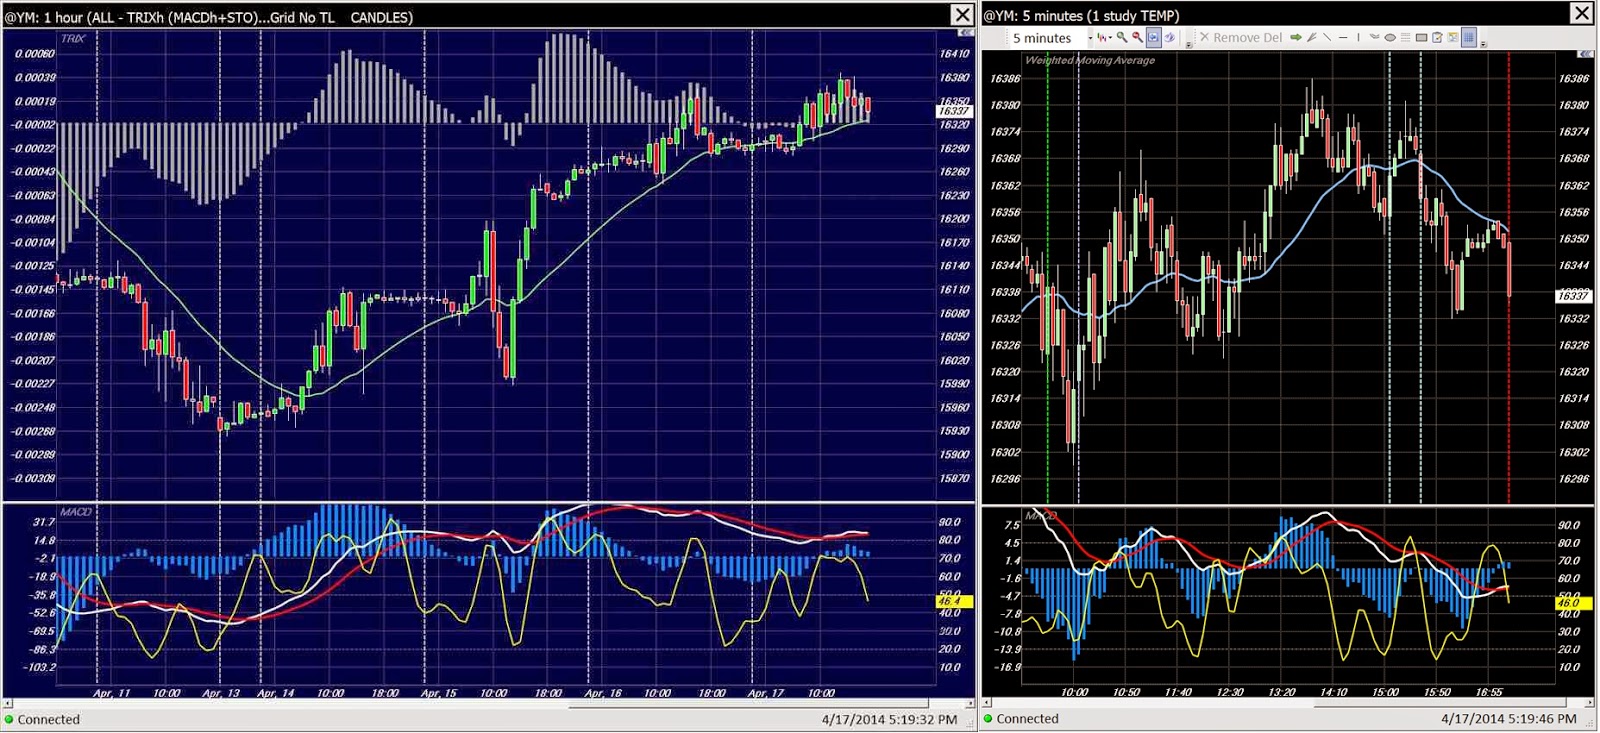
Messed up in the charts below - missed pasting the NQ 1 hour with the 5 minute...


1st week of April, daily EFTs as proxies for their respective markets

|
Followers
|
0
|
Posters
|
|
|
Posts (Today)
|
0
|
Posts (Total)
|
58
|
|
Created
|
05/31/14
|
Type
|
Free
|
| Moderators | |||
| Volume | |
| Day Range: | |
| Bid Price | |
| Ask Price | |
| Last Trade Time: |