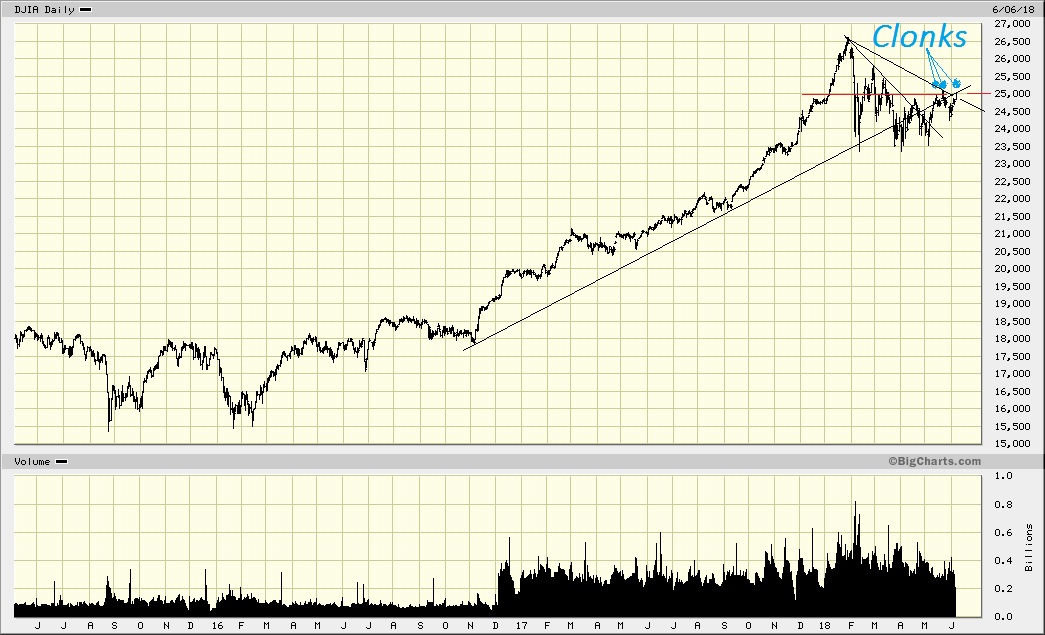
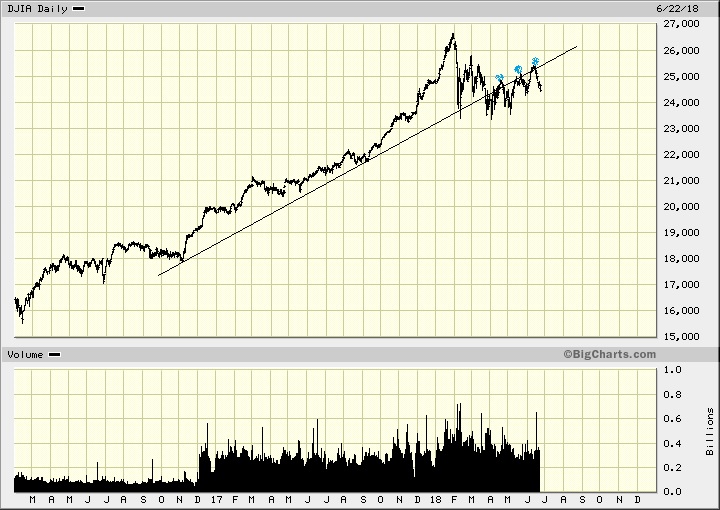
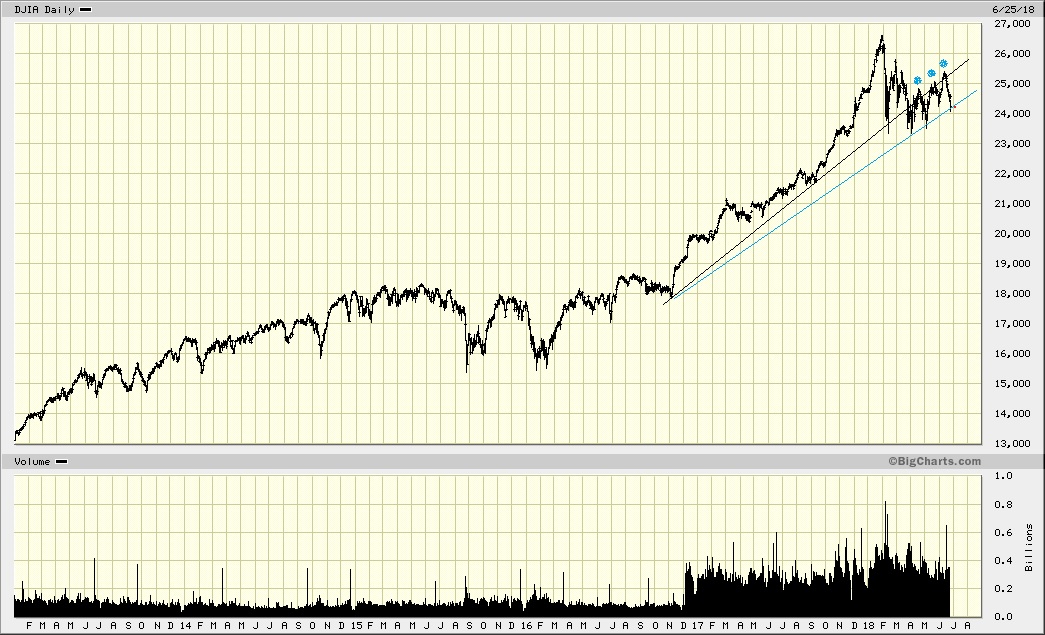
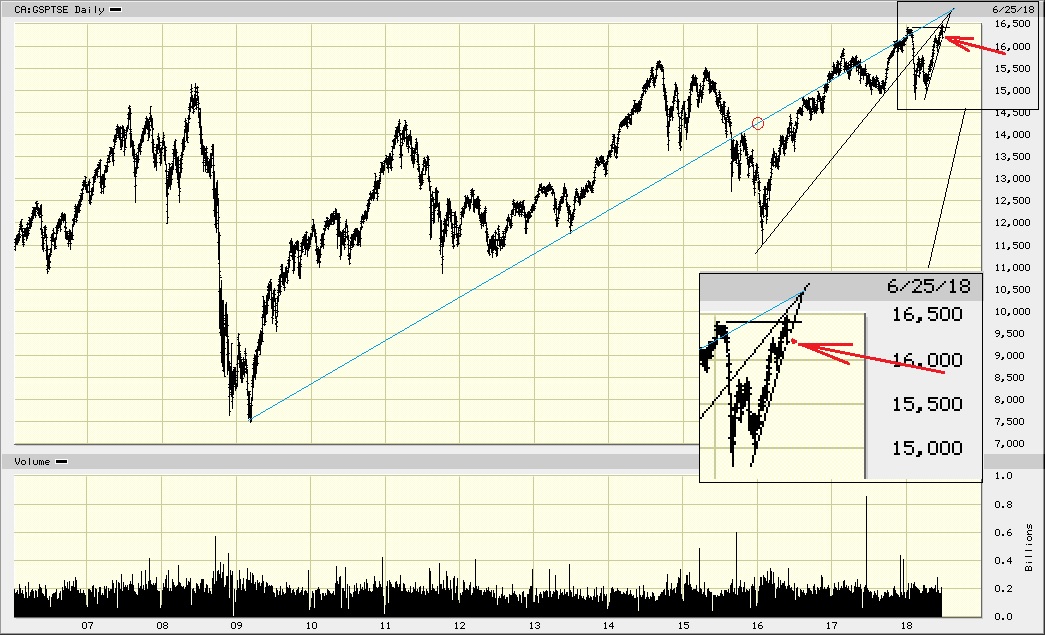
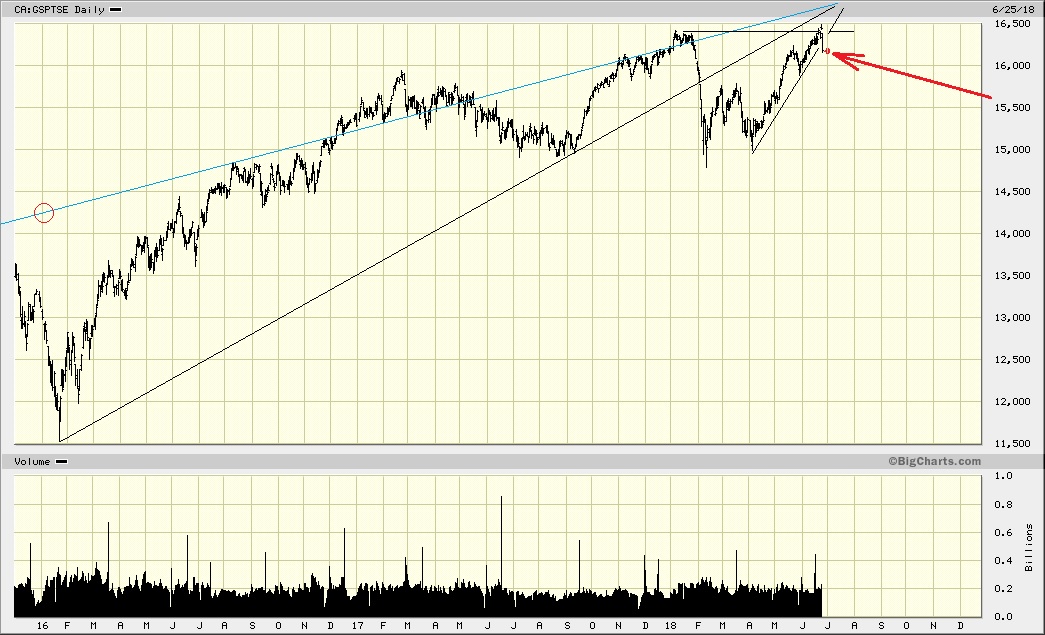
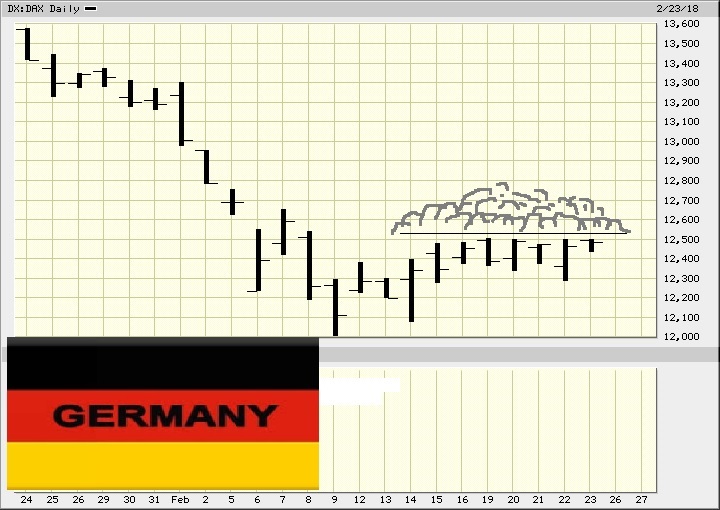
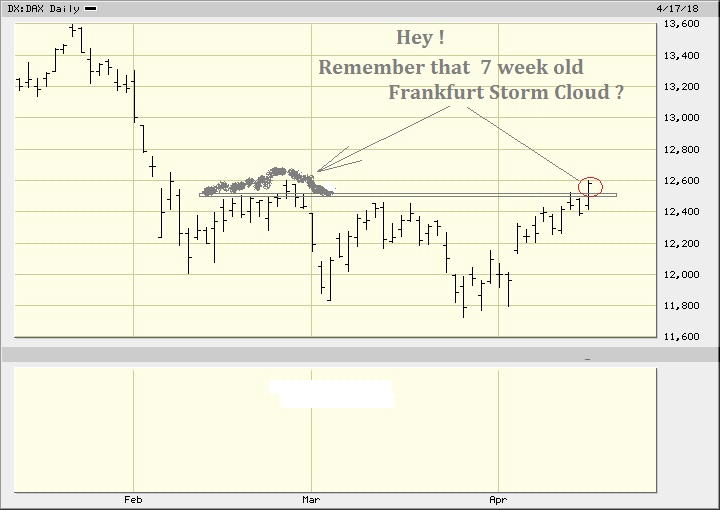
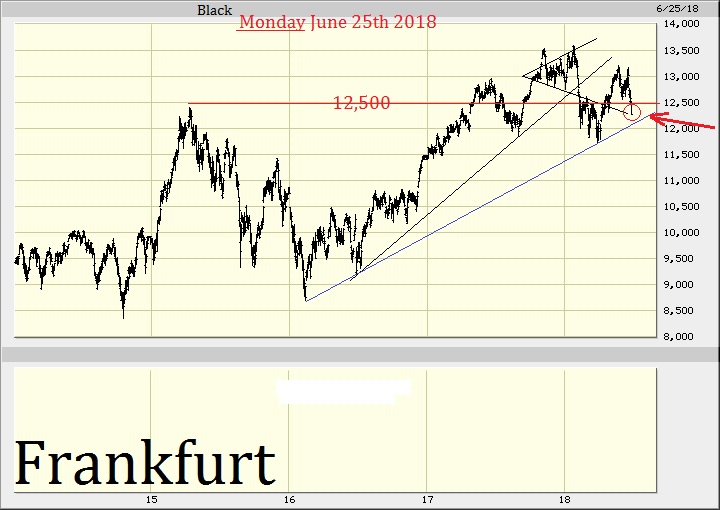
The Dow Jones Industrials Average, etc. : This from Wednesday June 6th : Was noting the Clonks and the 25,000 : investorshub.advfn.com/uimage/uploads/2018/6/25/wixkjdjia_jne6_3,5y_Clonks_25000.jpg This from Friday June 22nd : (13 trading days later) investorshub.advfn.com/uimage/uploads/2018/6/25/obbogdjia_jne22_3.1y_Higher_CLONKS_3.jpg This from the next trading day - Monday June 25th : investorshub.advfn.com/uimage/uploads/2018/6/25/vhouzdjia_jne25_4y_Clonks.jpg Now we've no choice but to (closely) monitor that Blue Line ! .....as well as the 24,000 . Meanwhile : The Toronto 300 Composite Index.......(fwiw) 12 yr chart : investorshub.advfn.com/uimage/uploads/2018/6/25/nctguisptx_jne25_12y_wedge_ZOOM_w_2.5.jpg 2 yr chart : investorshub.advfn.com/uimage/uploads/2018/6/25/kmejrisptx_jne25_2.5y_Big_Zoom_wedge.jpg Monday June 25th - Down 266 ( 1.66 % ) . And then there was Germany (not to bother with Asia here)..... Assuming one can make a bit of sense out of all this : The Original : From February 23rd : (The Original identification of the import. of 12-5) investorshub.advfn.com/uimage/uploads/2018/6/25/ciu[rdax_jne25_1.5_cloud_resistance_Feb_23_flag.jpg 7 weeks later : investorshub.advfn.com/uimage/uploads/2018/6/25/fpxqrdx_a17_3.5m_STORM_RE_BUSTED_THRU.jpg Four days after The Original (Feb. 27th) : investorshub.advfn.com/uimage/uploads/2018/6/25/nbxdzdax_f27_2m_weather_report.jpg Four months after The Original :investorshub.advfn.com/uimage/uploads/2018/6/25/tgukodax_jne25_1y_storm_level_thru.jpg One week after The Original : investorshub.advfn.com/uimage/uploads/2018/6/25/xnxtndax_m1_2.5_PHASE_2_ZOOMS_clouds.jpg Four months after The Original : investorshub.advfn.com/uimage/uploads/2018/6/25/cmnkidax_jne25_4.5y_12500_black_monday.jpg Yes, investorshub.advfn.com/uimage/uploads/2018/6/25/imysftarriffs.jpg .
 News
News  Market Data
  Discover