Register for free to join our community of investors and share your ideas. You will also get access to streaming quotes, interactive charts, trades, portfolio, live options flow and more tools.
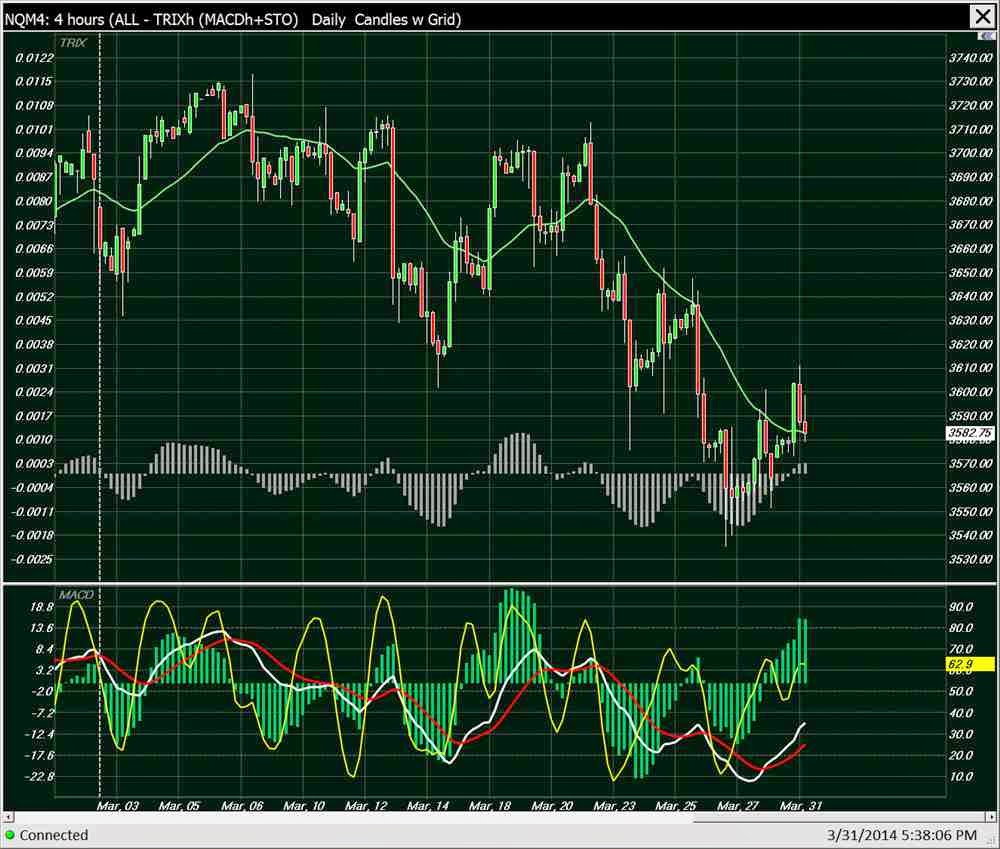
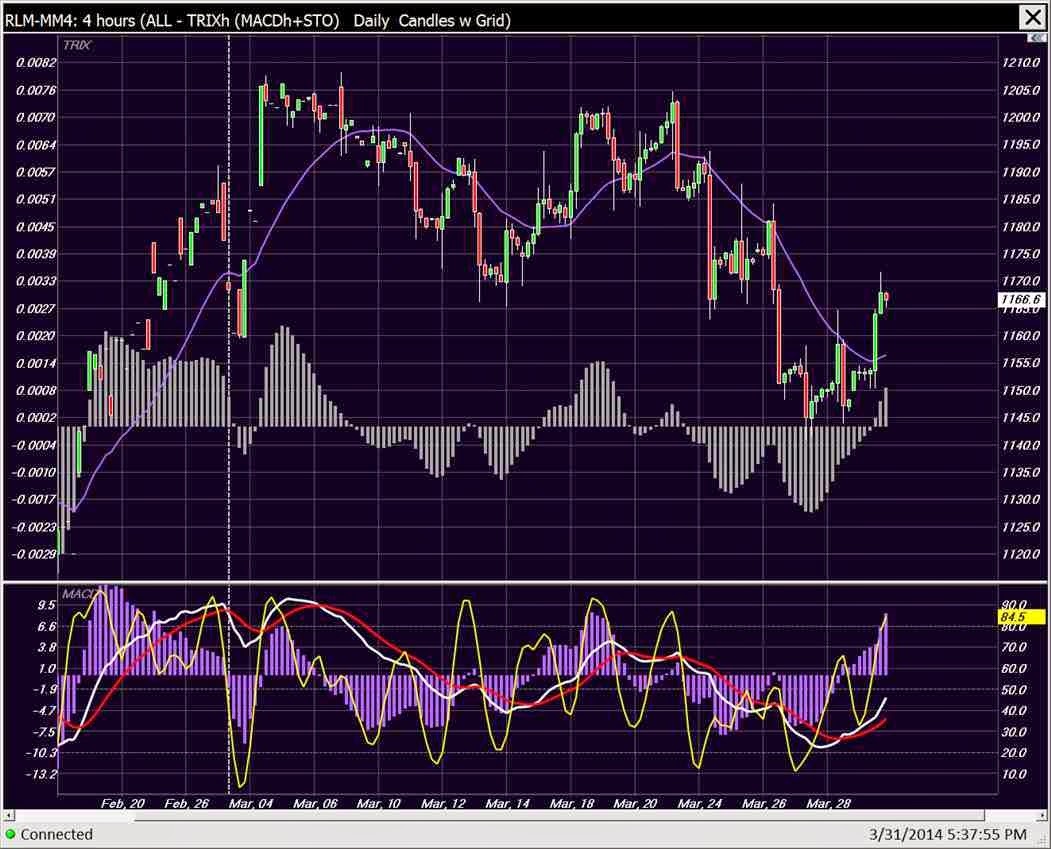
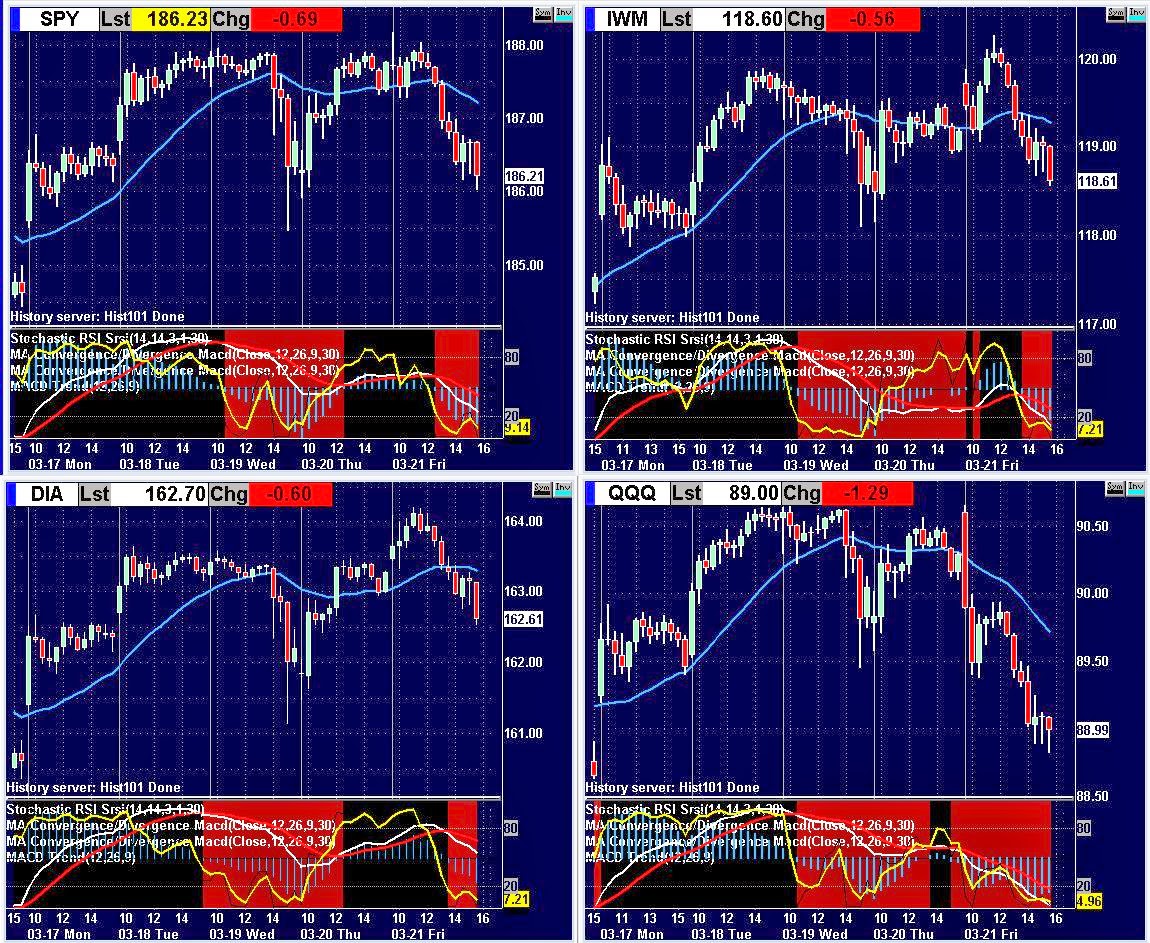
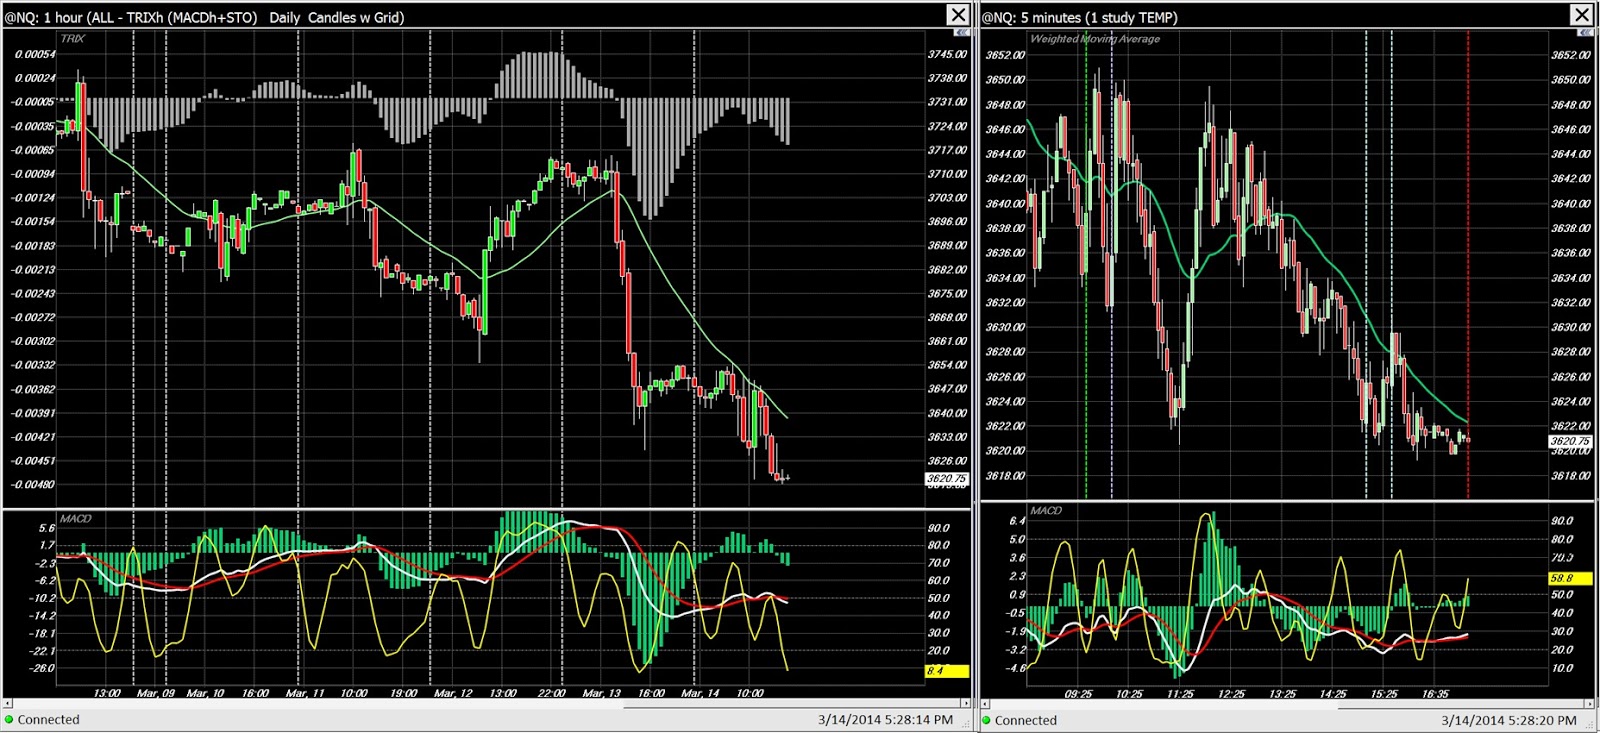
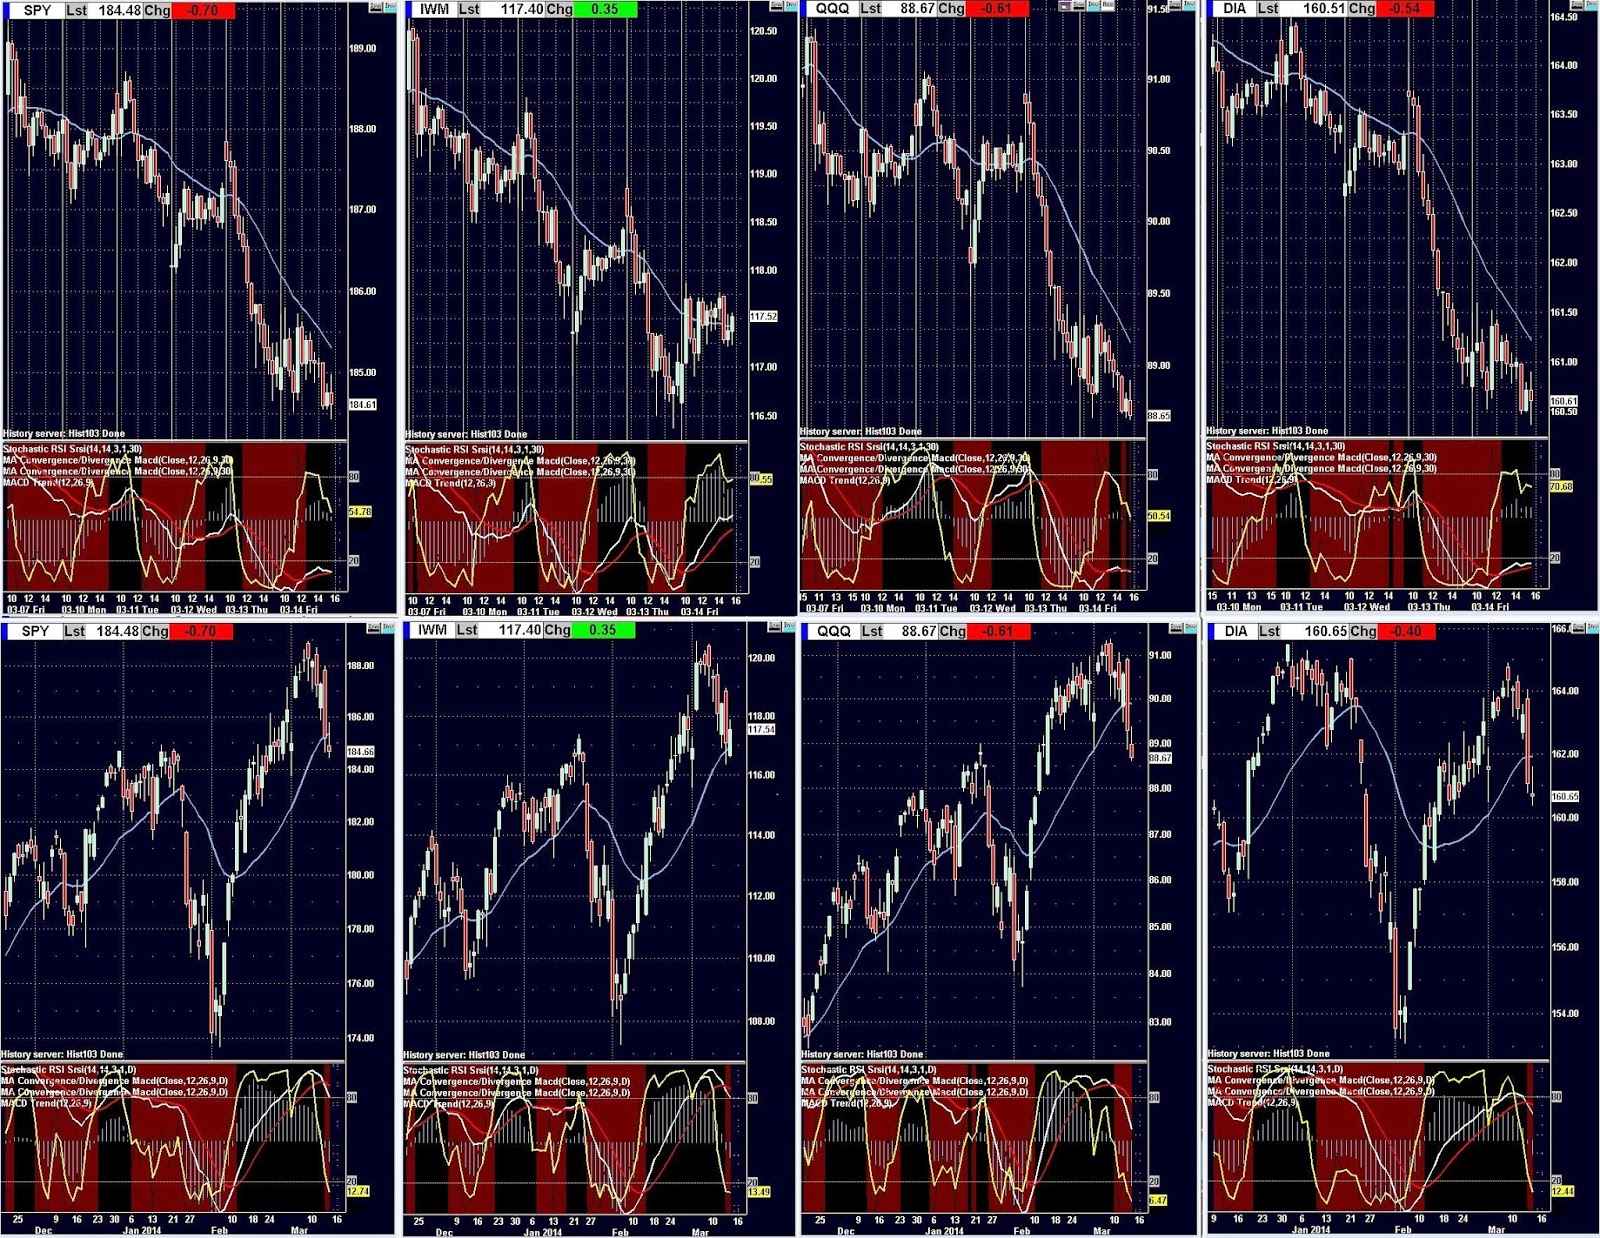
March 2014 EOW 4th week of the month Lots of movement for the week but ended up about where we started, at least in the DOW and S&P. On Wednesday there was news of a very large options/futures trade that spooked the markets. Turned out to be a 'neutral' positioning transaction but you can see the nervousness that exists... Tick chart pairs first followed by the 1 hour and 5 min pairs...
E-Mini Futures Chart Archives for the DJIA, S&P 500, Nasdaq 100 and Russell 2000 (YM, ES, NQ and RLM) with related Indices and ETFs
Tick and time based charts documenting the End of Week [EOW], End of Month [EOM] and other charts of interest. Post titles list the EOW or EOM time frames that the charts cover
My prefered indicators on most of the charts are as follows : Price Pane 30 period WMA along with a TRIX histogram (5 length...based on the close) I sometimes use an Awesome Oscillator histogram (5 Fast, 28 Slow)(bi-colors) in place of the TRIX histogram especially if there are two study windows Combined Study Window Stochastic (sma)...(5 Fast K, 4 Slow D, 3 Slow K ...displaying only the Slow D) MACD EMAs + histogram...(std 9 fast, 26 signal,12 slow...based on the close) Often the TRIXh or the MACDh are colored-coded to reflect the chart's market...
 News
News  Market Data
  Discover