 News
News  Market Data
  Discover
Support: 888-992-3836
Copyright © 2023 InvestorsHub Inc.


Register for free to join our community of investors and share your ideas. You will also get access to streaming quotes, interactive charts, trades, portfolio, live options flow and more tools.
List of Direxion ETF’s
Symbol Fund Index/Benchmark Daily Target Bloomberg Index Symbol
Long Term Investment
ETFs
KNOW
Direxion All Cap Insider Sentiment Shares
Sabrient Multi-Cap Insider/Analyst Quant-Weighted Index - SBRQAM
INSD
Direxion Large Cap Insider Sentiment Shares
Sabrient Large-Cap Insider/Analyst Quant-Weighted Index - SBRQAL
VSPY
Direxion S
$RDUFF BarChart Technical Analysis
http://www.barchart.com/technicals/stocks/RDUFF
CONCEALING BABY SWALLOW
This Bullish pattern is highlighted by two consecutive Black Marubozu. They are characterized by the fact that a gapping black candlestick trades into the body of the previous day and it is seen during a downtrend. Then there is another Black Marubozu on the third day showing sale of positions since it closes at a new low. However this may give incentive to the shorts to cover their positions implying that a bullish reversal is now possible.

Recognition Criteria:
1. Market is characterized by downtrend.
2. We see two consecutive Black Marubozu in the first and second days.
3. Then we see a black candlestick on the third day opening with a downward gap but trading into the body of the second day and it is characterized by a long upper shadow.
4. Finally we see another Black Marubozu on the fourth day that completely engulfs the candlestick of the third day including the shadow.
Explanation:
Two black Marubozu show that downtrend is continuing to the satisfaction of the bears. On the third day, we see a downward gap further confirming the downtrend. However, prices on the third day start going above the close of the previous day causing some doubts about the bearish direction even though the day closes at or near its low. The next day shows us a significantly higher gap in the opening. After the opening, however, prices again go down closing at a new low. This last day may be interpreted as a good chance for the short-sellers to cover their short positions. 
The 125-day Rate-of-Change is the second long-term indicator. This is a simple indicator that measures the percentage price change over the last 125 days, which is around six months. Strong stocks will show the largest gains, while weak stocks will show the largest losses. It is a straight-forward indicator designed to measure pure strength or weakness.
$SRCH BarChart Technical Analysis
http://www.barchart.com/technicals/stocks/SRCH
Overbought and oversold levels can be used to identify unsustainable price extremes. Typically, MFI above 80 is considered overbought and MFI below 20 is considered oversold. Strong trends can present a problem for these classic overbought and oversold levels. MFI can become overbought (>80) and prices can simply continue higher when the uptrend is strong. Conversely, MFI can become oversold (<20) and prices can simply continue lower when the downtrend is strong.
BEARISH TWO CROWS
During an uptrend we see the market closing lower after an opening gap. Then we see a black day that fills the gap creating the Bearish Two Crows Pattern. It suggests the erosion of the uptrend, and warns about a possible trend reversal.

Recognition Criteria:
1. Market is characterized by uptrend.
2. We see a long white candlestick in the first day.
3. Then we see a black candlestick on the second day characterized by a gap up.
4. Finally we see a black candlestick whose opening price is inside the body of the second day and which closes inside the body of the first day.
Explanation:
In the Two Crows bear pattern, the market is already in an extended uptrend. We see a gap in the opening of the second day. This higher opening is followed by a lower close in this second day warning that there is some weakness in the rally. The third day also opens at a higher price, but not above the open of the previous day, and then prices go down with a close well within the body of the first day. This third day action fills the gap of the second day. It shows that the bullishness started to erode quickly.
Important Factors:
A confirmation on the fourth day is required to show that the uptrend has reversed. This confirmation may be in the form of a black candlestick, a large gap down or a lower close on the fourth day.
$GELV BarChart Technical Analysis
http://www.barchart.com/technicals/stocks/GELV
Centerline crossovers are the next most common MACD signals. A bullish centerline crossover occurs when the MACD Line moves above the zero line to turn positive. This happens when the 12-day EMA of the underlying security moves above the 26-day EMA. A bearish centerline crossover occurs when the MACD moves below the zero line to turn negative. This happens when the 12-day EMA moves below the 26-day EMA.
Pivot Points ~ Setting the Tone
The Pivot Point sets the general tone for price action. This is the middle line of the group that is marked (P). A move above the Pivot Point is positive and shows strength. Keep in mind that this Pivot Point is based on the prior period's data. It is put forth in the current period as the first important level. A move above the Pivot Point suggests strength with a target to the first resistance. A break above first resistance shows even more strength with a target to the second resistance level.

The converse is true on the downside. A move below the Pivot Point suggests weakness with a target to the first support level. A break below the first support level shows even more weakness with a target to the second support level.
$GHRI BarChart Technical Analysis
http://www.barchart.com/technicals/stocks/GHRI
TRIX is the 1-period percentage rate-of-change for a triple smoothed exponential moving average (EMA), which is an EMA of an EMA of an EMA. Here is a breakdown of the steps involved for a 15 period TRIX.
Index ETFs
Most ETFs are index funds that attempt to replicate the performance of a specific index. Indexes may be based on stocks, bonds, commodities, or currencies. An index fund seeks to track the performance of an index by holding in its portfolio either the contents of the index or a representative sample of the securities in the index.[5] As of June 2012, in the United States, about 1200 index ETFs exist, with about 50 actively managed ETFs. Index ETF assets are about $1200 billion, compared with about $7 billion for actively managed ETFs.[18] Some index ETFs, known as leveraged ETFs or inverse ETFs, use investments in derivatives to seek a return that corresponds to a multiple of, or the inverse (opposite) of, the daily performance of the index.[19]
Some index ETFs invest 100% of their assets proportionately in the securities underlying an index, a manner of investing called "replication". Other index ETFs use "representative sampling", investing 80% to 95% of their assets in the securities of an underlying index and investing the remaining 5% to 20% of their assets in other holdings, such as futures, option and swap contracts, and securities not in the underlying index, that the fund's adviser believes will help the ETF to achieve its investment objective. For index ETFs that invest in indices with thousands of underlying securities, some index ETFs employ "aggressive sampling" and invest in only a tiny percentage of the underlying securities
$XTGR BarChart Technical Analysis
http://www.barchart.com/technicals/stocks/XTGR
Chaikin Money Flow can be used to define a general buying or selling bias simply with positive or negative values. The indicator oscillates above/below the zero line. Generally, buying pressure is stronger when the indicator is positive and selling pressure is stronger when the indicator is negative.
$ILVC BarChart Technical Analysis
http://www.barchart.com/technicals/stocks/ILVC
Form N-14 ~ SEC Filings Explained
Initial registration statement for open-end investment company
TRIX Bullish Signal Line Cross: This scan reveals stocks that meet four criteria. First, they must be above their 200-day moving average to be in an overall up trend. Second, the TRIX must be negative to signal a pullback. Third, the TRIX crossed its signal line and turned up. Fourth, volume moved above the 250-day average to show an increase in buying pressure.
$EARH BarChart Technical Analysis
http://www.barchart.com/technicals/stocks/EARH
Form NT 10-Q ~ SEC Filings Explained
Notice under Rule 12b25 of inability to timely file all or part of a form 10-Q or 10-QSB
Indicators are calculations based on price and volume history of a ticker. There are many different indicators, each with a unique formula used to measure such things as volatility, momentum, trend and money flow.
$DFRH BarChart Technical Analysis
http://www.barchart.com/technicals/stocks/DFRH
Direxion Daily Financial Bear 3X Shares (NYSE:FAZ)
Not all ETFs are designed to move in the same direction or even in the same amount as the index they are tracking. For example, this triple bear fund attempts to perform 300% in the opposite direction of the Russell 1000 Financial Services Index. This fund became popular in 2008 and 2009 when the financial crisis placed downward pressure on financial stocks.
RSI positive and negative reversals put price action of the underlying security first and the indicator second, which is the way it should be. Bearish and bullish divergences place the indicator first and price action second. By putting more emphasis on price action, the concept of positive and negative reversals challenges our thinking towards momentum oscillators.
$KKPT BarChart Technical Analysis
http://www.barchart.com/technicals/stocks/KKPT
Form S-6 ~ SEC Filings Explained
Initial registration statement filed on Form S-6 for unit investment trusts
Chaikin Money Flow (CMF) is an oscillator that fluctuates between -1 and 1. Rarely, if ever, will the indicator reach these extremes. It would take 20 consecutive closes on the high (low) for 20-day Chaikin Money Flow to reach 1 (-1). Typically, this oscillator fluctuates between -.50 and .50 with zero as the center-line.
Form 13F-NT, 13F-NT/A ~ SEC Filings Explained
Initial Quarterly Form 13F Notice Report filed by institutional managers (and amendment thereto)
$PROP BarChart Technical Analysis
http://www.barchart.com/technicals/stocks/PROP
When the MACD is above zero, the short-term average is above the long-term average, which signals upward momentum. The opposite is true when the MACD is below zero. As you can see from the chart above, the zero line often acts as an area of support and resistance for the indicator.
United States Natural Gas (NYSE:UNG)
Funds can also provide a way to invest in natural resources. This investments gives a replication of natural gas prices , after expenses. It will try to follow the prices of natural gas by buying futures contracts on natural gas in the coming months. As with all funds you need to keep an eye on the total expense ratio before investing.
$TLFX BarChart Technical Analysis
http://www.barchart.com/technicals/stocks/TLFX
The MACD "oscillator" or "indicator" is a collection of three signals (or computed data-series), calculated from historical price data, most often the closing price. These three signal lines are: the MACD line, the signal line (or average line), and the difference (or divergence).
Shadow and Tail
The shadow is the portion of the trading range outside of the body. We often refer to a candlestick as having a tall shadow or a long tail.
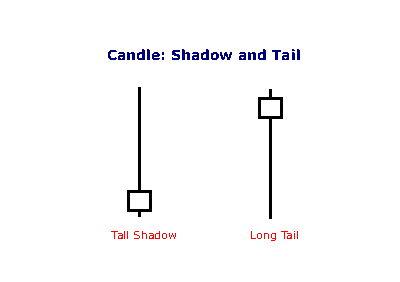
A tall shadow indicates resistance;
A long tail signals support.
$OPEI BarChart Technical Analysis
http://www.barchart.com/technicals/stocks/OPEI
SCTR tables can easily be sorted to separate the strongest stocks from the weakest. In any given SCTR universe, the top 10% will rank between 90 and 100, while the bottom 10% will rank between 0 and 10. A stock scoring 50 would be average, showing neither relative weakness nor relative strength. In general, scores between 40 and 60 are considered average. Signs of technical weakness start to appear as scores move below 40. Signs of technical strength emerge when scores move above 60.
SEC Filings Explained ~ Form13D
Schedule 13D is an SEC filing that must be submitted to the US Securities and Exchange Commission within 10 days, by anyone who acquires beneficial ownership of more than 5% of any class of publicly traded securities in a public company. A filer must promptly update its Schedule 13D filing to reflect any material change in the facts disclosed, including, among other things, the acquisition or disposition of 1% or more of the class of securities that are the subject of the filing.
Form Uses
13D filings allow the investing public to see who a public company's large shareholders are and, perhaps more importantly, why they have an interest in the company. These filings may be a precursor to hostile takeovers, company breakups, and other "change of control" events.
Reading the Form
Schedule 13D consists of seven different sections:
? Security and Issuer - This section contains basic information regarding the type and class the security and the contact information of the owner.
? Identity and Background - This section contains even more background into the owner, including if they were involved in any criminal activity in the past.
? Source and Amount of Funds or Other Considerations - This section lets investors know where the money is coming from. The most important use for this section is in determining if a buyout situation is overleveraged, when a majority of the purchase is leveraged or borrowed capital.
? Purpose of Transaction - This is the most important portion of the 13D filing. It allows you to see why they are buying shares in the company, whether it be for acquisition, hostile takeover, proxy war, or simply because they believe it is undervalued.
? Interest in Securities of the Issuer - This section states the express purpose of the transaction, which should be explained better in section 4 (Purpose of Transaction).
? Contracts, Arrangements, Understandings or Relationships with Respect to the Securities of the Issuer - This section contains any special relationships between the owner and the company. This is important to be sure that the buying is legitimate and not just a friend purchasing stock or the result of some other agreement.
? Materials to Be Filed as Exhibits - This is the second most important section. It contains any exhibits that may be filed along with the form. This is famously used for the filing of letters to management in the event of a hostile takeover. Exhibits can also elaborate on the Purpose of Transaction (Section 4).
$CGUD BarChart Technical Analysis
http://www.barchart.com/technicals/stocks/CGUD
MFI is used as an oscillator. A value of 80 is generally considered overbought, or a value of 20 oversold. Divergences between MFI and price action are also considered significant, for instance if price makes a new rally high but the MFI high is less than its previous high then that may indicate a weak advance, likely to reverse.
MORNING STAR
This is a three-candlestick formation that signals a major bottom. It is composed of a first long black body, a second small real body, white or black, gapping lower to form a star. These two candlesticks define a basic star pattern. The third is a white candlestick that closes well into the first session’s black real body. Third candlestick shows that the market turned bullish now.

Recognition Criteria:
1. Market is characterized by downtrend.
2. We see a long black candlestick in the first day.
3. Then we see a small body on the second day gapping in the direction of the previous downtrend.
4. Finally we see a white candlestick on the third day.
Explanation:
We see the black body in a falling market suggesting that the bears are in command. Then a small real body appears implying the incapacity of sellers to drive the market lower. The strong white body of third day proves that bulls have taken over. An ideal Bullish Morning Star Pattern preferably has a gap before and after the middle candlestick. The second gap is rare, but lack of it does not take away from the power of this formation.
Important Factors:
The stars may be more than one, two or even three.
The color of the star and its gaps are not important.
$DATA BarChart Technical Analysis
http://www.barchart.com/technicals/stocks/DATA
Each period's Money Flow Volume depends on the Money Flow Multiplier. This multiplier is positive when the close is in the upper a half of the period's high-low range and negative when the close is in the lower half. The multiplier equals 1 when the close equals the high and -1 when the close equals the low. In this way the multiplier adjusts the amount of volume that ends up in Money Flow Volume.
Form 15F-12G, 15F-12G/A ~ SEC Filings Explained
Notice of termination of a foreign private issuer's registration of a class of securities under Section 12(g) (and amendment thereto)
$AMBS BarChart Technical Analysis
http://www.barchart.com/technicals/stocks/AMBS
SCTR scores are based exclusively on straightforward technical conditions championed by John Murphy in his books and presentations. They were inspired by John's "10 Laws of Technical Trading" essay. We'll have a ChartSchool article with the exact formula available in a week or so but essentially we are looking at 6-month performance, 20-day performance, distance from the 200-day moving average, distance from the 50-day moving average, the slope of the MACD histogram, and the RSI's value. Each one of those factors is weighted based on John's opinion of its importance and then added together to achieve the final score for each stock.
Form N-8A ~ SEC Filings Explained
Initial notification of registration under section 8(a) filed on Form N-8A
$GRMC BarChart Technical Analysis
http://www.barchart.com/technicals/stocks/GRMC
The calculation for RSI has been broken down into its basic components: RS, Average Gain and Average Loss. This RSI calculation is based on 14 periods, which is the default suggested by Wilder in his book. Losses are expressed as positive values, not negative values.
SEC Filings Explained ~ F-1
Registration statement for certain foreign private issuers.
$EVGI BarChart Technical Analysis
http://www.barchart.com/technicals/stocks/EVGI
|
Followers
|
3289
|
Posters
|
|
|
Posts (Today)
|
0
|
Posts (Total)
|
2804248
|
|
Created
|
08/22/10
|
Type
|
Free
|
| Moderator Nilbud | |||
| Assistants mick ManicTrader PhotoChick Kirimi $Pistol Pete$ | |||
   Investor Hub Alerts: Sign up for 'STOCKGOODIES PLAYS OF THE WEEK ' E-Mail List Investor Hub Alerts: Sign up for 'STOCKGOODIES PLAYS OF THE WEEK ' E-Mail ListUPDATE; 5-1-22 courtesy of charting /\ wit tweezer top calls /\ Tony @Montana_Trades Really good study sheet on Candlestick Patterns [-chart]pbs.twimg.com/media/FRn8188XMAAdZvk?format=jpg&name=small[/chart] 

02-07-2021
|
|
Posts Today
|
0
|
|
Posts (Total)
|
2804248
|
|
Posters
|
|
|
Moderator
|
|
|
Assistants
|
| Volume | |
| Day Range: | |
| Bid Price | |
| Ask Price | |
| Last Trade Time: |


