 News
News  Market Data
  Discover

Support: 888-992-3836
Copyright © 2023 InvestorsHub Inc.


Register for free to join our community of investors and share your ideas. You will also get access to streaming quotes, interactive charts, trades, portfolio, live options flow and more tools.
The Chaikin Money Flow line will fluctuate above and below a zero line similar to many other oscillators. Technical analyst can use the CMF indicator to study buying or selling pressure to help them forecast trend direction.
Dragonfly
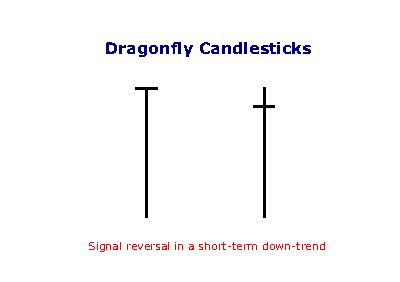
The dragonfly occurs when the open and close are near the top of the candlestick and signals reversal after a down-trend: control has shifted from sellers to buyers. 
$TGWI BarChart Technical Analysis
http://www.barchart.com/technicals/stocks/TGWI
A buy signal is generated when the indicator is below zero and turns upwards from a trough. No sell signals are generated (that not being its design), but turns at the top have their uses in signalling danger. The indicator is trend-following, and based on averages, so by its nature it doesn't pick a absolute market bottom like our TroughFinder product, but rather shows when a rally has become established.
$CLNP BarChart Technical Analysis
http://www.barchart.com/technicals/stocks/CLNP
M-Tops Using Bollinger Bands
M-Tops were also part of Arthur Merrill's work that identified 16 patterns with a basic M shape. Bollinger uses these various M patterns with Bollinger Bands to identify M Bottoms. According to Bollinger, tops are usually more complicated and drawn out than bottoms. Double tops, head-and-shoulders patterns and diamonds represent evolving tops.
In its most basic form, an M-Top is similar to a double top. However, the reaction highs are not always equal. The first high can be higher or lower than the second high. Bollinger suggests looking for signs of non-confirmation when a security is making new highs. This is basically the opposite of the W-Bottom. A non-confirmation occurs with three steps. First, a security forges a reaction high above the upper band. Second, there is a pullback towards the middle band. Third, prices move above the prior high, but fail to reach the upper band. This is a warning sign. The inability of the second reaction high to reach the upper band shows waning momentum, which can foreshadow a trend reversal. Final confirmation comes with a support break or bearish indicator signal.

The chart shows Exxon Mobil (XOM) with an M-Top in April-May 2008. The stock moved above the upper band in April. There was a pullback in May and then another push above 90. Even though the stock moved above the upper band on an intraday basis, it did not CLOSE above the upper band. The M-Top was confirmed with a support break two weeks later. Also notice that MACD formed a bearish divergence and moved below its signal line for confirmation.
The MACD is an absolute price oscillator (APO), because it deals with the actual prices of moving averages rather than percentage changes. A percentage price oscillator (PPO), on the other hand, computes the difference between two moving averages of price divided by the longer moving average value.
$GTMM BarChart Technical Analysis
http://www.barchart.com/technicals/stocks/GTMM
SEC Filings Explained ~ Rule 144
On December 6, 2007, the SEC published final rules revising Rule 144 under the Securities Act of 1933, which regulates the resale of restricted securities and securities held by affiliates. The amendments to Rule 144, among other things:
1. Shorten the holding period for affiliate and non-affiliate holders of restricted securities of SEC-reporting companies to six months, subject to certain conditions
2. Permit unlimited resale by non-affiliate holders of restricted securities by complying only with the current public information condition for resale of restricted securities issued by SEC reporting companies made after the six-month holding period; and without complying with any Rule 144 conditions for resale of restricted securities issued by both SEC reporting and non-reporting companies made after a one-year holding period.
3. permit resale of equity securities by affiliates that meet certain conditions through riskless principal transactions and brokers’ transactions in which the broker has published bid and asked quotations for the security in an alternative trading system.
4. Eliminate the manner of sale conditions and ease the volume limitations for resale of debt securities by affiliates.
5. Increase the thresholds that trigger the Form 144 filing requirement to 5,000 shares or $50,000.
The SEC did not adopt previously proposed provisions relating to the tolling of holding periods in connection with hedging transactions.
The amendments will become effective on February 15, 2008, and will apply to securities acquired before or after that date. Background
Rule 144 regulates the resale of “restricted securities”1 and “control securities,”2 by establishing certain conditions that must be satisfied in order for the resale to be exempt from the Securities Act registration requirements pursuant to Section 4(1) of the Securities Act—a safe harbor from “underwriter” status for the selling security holder.
The conditions include the following:
? There must be adequate current public information available about the issuer;
? If the securities being sold are restricted securities, the security holder must have held the security for a specified holding period;
? The resale must be within specified sales volume limitations;
? The resale must comply with the manner of sale requirements of the rule; and
? The selling security holder must file Form 144 with the SEC if the amount of securities being sold exceeds specified thresholds.
Amendments to Conditions for Resale of Restricted Securities
Restricted Securities of SEC-Reporting Companies. The SEC has reduced the holding period under Rule 144 for restricted securities of SEC-reporting companies held by both affiliates and non-affiliates from one year to six months. Affiliate holders of reporting company securities may now resell their restricted securities after six months, subject to the other Rule 144 requirements. Non-affiliate holders of reporting company securities (who have also not been affiliates during the prior three months) may now resell their restricted securities held between six months and one year subject only to Rule 144’s current public information requirement. Any such resale by a non-affiliate after one year will be exempt from all Rule 144 requirements.
Restricted Securities of Non-Reporting Companies. There is still a one-year holding period for affiliate and non-affiliate holders of restricted securities in non-reporting companies under amended Rule 144. After the one-year holding period, non-affiliates may now resell their restricted securities without having to comply with any other Rule 144 requirements; affiliates seeking to resell their restricted securities must still meet all Rule 144 requirements.
The manner of sale requirements of Rule 144 require securities to be sold in “brokers’ transactions” or in transactions directly with a “market maker.”
The rule includes restrictions on (1) soliciting or arranging for the solicitation of orders to buy the securities in anticipation of, or in connection with, the Rule 144 transaction or (2) making any payment in connection with the offer or sale of the securities to any person other than the broker who executes the order to sell the securities.
The SEC amended these rules to also permit the resale of restricted equity securities by affiliates through riskless principal transactions in which trades are executed at the same price, exclusive of any explicitly disclosed markup or markdown, commission equivalent or other fee, and the rules for a self-regulatory organization permit the transaction to be reported as riskless.3 The amended rule also expands the definition of a “brokers’ transaction” for purposes of such resale by permitting a broker to insert bid and ask quotations for the security in an alternative trading system, provided that the broker has published bona fide bid and ask quotations for such security on each of the last 12 business days. Resale of Restricted Debt Securities The SEC has eliminated the manner-of-sale requirements for affiliate resale of debt securities, including non-participatory preferred stock (which has debt-like characteristics) and asset-backed securities. The SEC also raised the volume limitations for the resale of debt securities to permit resale in an amount that does not exceed ten percent of a tranche (or a class with respect to non-participatory preferred stock), together with all sales of securities of the same tranche sold for the selling debt security holder within a three-month period. Form 144 Filing Triggers
The sales thresholds for filing Form 144 have been increased from 500 shares or $10,000 worth of securities to 5,000 shares or $50,000. Codified
SEC Staff Interpretations
The SEC has also codified various staff interpretations relating to Rule 144, including the following:
1. Stating that securities acquired by accredited investors pursuant to Section 4(6) of the Securities Act are considered restricted securities
2. Permitting tacking of holding periods when a company reorganizes into a holding company structure
3. Permitting tacking of holding periods for conversions and exchanges of securities
4. Deeming the acquisition dates for securities acquired pursuant to the cashless exercise of options and warrants as the dates the options or warrants were acquired
5. Permitting a pledgee of restricted securities to sell the pledged securities without having to aggregate the sale with sales by other pledgees from the same pledgor (as long as there is no concerted action by those pledgees), for purposes of the Rule 144 volume limitation condition
6. Permitting the Form 144 representations required from security holders relying on Exchange Act Rule 10b5-1 to be made as of the date the holder adopted a trading plan or gave trading instructions
7. Confirming the unavailability of Rule 144 for the resale of securities by reporting and non-reporting firms
The money flow index is similar to the relative strength index (RSI). The fundamental difference is that the MFI also accounts for volume, whereas the RSI only incorporates price. Many traders watch for opportunities that arise when the MFI moves in the opposite direction as the price. This divergence can often be a leading indicator of a change in the current trend.
$SMAA BarChart Technical Analysis
http://www.barchart.com/technicals/stocks/SMAA
Bond ETFs
Exchange-traded funds that invest in bonds are known as bond ETFs. They thrive during economic recessions because investors pull their money out of the stock market and into bonds (for example, government treasury bonds or those issues by companies regarded as financially stable). Because of this cause and effect relationship, the performance of bond ETFs may be indicative of broader economic conditions.[22] There are several advantages to bond ETFs such as the reasonable trading commissions, but this benefit can be negatively offset by fees if bought and sold through a third party
RSI is a technical momentum indicator that compares the magnitude of recent gains to recent losses in an attempt to determine overbought and oversold conditions of an asset. It is calculated using the following formula.
$FRGY BarChart Technical Analysis
http://www.barchart.com/technicals/stocks/FRGY
Walking the Bands
Moves above or below the bands are not signals as such. As Bollinger puts it, moves that touch or exceed the bands are not signals, but rather "tags". On the face of it, a move to the upper band shows strength, while a sharp move to the lower band shows weakness. Momentum oscillators work much the same way. Overbought is not necessarily bullish. It takes strength to reach overbought levels and overbought conditions can extend in a strong uptrend. Similarly, prices can "walk the band" with numerous touches during a strong uptrend. Think about it for a moment. The upper band is 2 standard deviations above the 20-period simple moving average. It takes a pretty strong price move to exceed this upper band. An upper band touch that occurs after a Bollinger Band confirmed W-Bottom would signal the start of an uptrend. Just as a strong uptrend produces numerous upper band tags, it is also common for prices to never reach the lower band during an uptrend. The 20-day SMA sometimes acts as support. In fact, dips below the 20-day SMA sometimes provide buying opportunities before the next tag of the upper band.

The chart above shows Air Products (APD) with a surge and close above the upper band in mid July. First, notice that this is a strong surge that broke above two resistance levels. A strong upward thrust is a sign of strength, not weakness. Trading turned flat in August and the 20-day SMA moved sideways. The Bollinger Bands narrowed, but APD did not close below the lower band. Prices, and the 20-day SMA, turned up in September. Overall, APD closed above the upper band at least five times over a four month period. The indicator window shows the 10-period Commodity Channel Index (CCI). Dips below -100 are deemed oversold and moves back above -100 signal the start of an oversold bounce (green dotted line). The upper band tag and breakout started the uptrend. CCI then identified tradable pullbacks with dips below -100. This is an example of combining Bollinger Bands with a momentum oscillator for trading signals.
The FI is calculated by multiplying the difference between the last and previous closing prices by the volume of the commodity, yielding a momentum scaled by the volume. The strength of the force is determined by a larger price change or by a larger volume.
$TRKG BarChart Technical Analysis
http://www.barchart.com/technicals/stocks/TRKG
Form N-Q ~ SEC Filings Explained
Quarterly Schedule of Portfolio Holdings of Registered Management Investment Company
The sharper the movement up or down of the MACD, the stronger the sign is to buy or sell, taking the above recommendations into consideration.
$DISK BarChart Technical Analysis
http://www.barchart.com/technicals/stocks/DISK
Price Crossovers using Moving Averages
Moving averages can also be used to generate signals with simple price crossovers. A bullish signal is generated when prices move above the moving average. A bearish signal is generated when prices move below the moving average. Price crossovers can be combined to trade within the bigger trend. The longer moving average sets the tone for the bigger trend and the shorter moving average is used to generate the signals. One would look for bullish price crosses only when prices are already above the longer moving average. This would be trading in harmony with the bigger trend. For example, if price is above the 200-day moving average, chartists would only focus on signals when price moves above the 50-day moving average. Obviously, a move below the 50-day moving average would precede such a signal, but such bearish crosses would be ignored because the bigger trend is up. A bearish cross would simply suggest a pullback within a bigger uptrend. A cross back above the 50-day moving average would signal an upturn in prices and continuation of the bigger uptrend.
The next chart shows Emerson Electric (EMR) with the 50-day EMA and 200-day EMA. The stock moved above and held above the 200-day moving average in August. There were dips below the 50-day EMA in early November and again in early February. Prices quickly moved back above the 50-day EMA to provide bullish signals (green arrows) in harmony with the bigger uptrend. MACD(1,50,1) is shown in the indicator window to confirm price crosses above or below the 50-day EMA. The 1-day EMA equals the closing price. MACD(1,50,1) is positive when the close is above the 50-day EMA and negative when the close is below the 50-day EMA.

There are three steps to calculating Keltner Channels. First, select the length for the exponential moving average. Second, choose the time periods for the Average True Range (ATR). Third, choose the multiplier for the Average True Range.
$MWIP BarChart Technical Analysis
http://www.barchart.com/technicals/stocks/MWIP
Candlestick Charts
The Japanese have been using candlestick charts since the 17th century to analyze rice prices. Candlesticks were introduced into modern technical analysis by Steve Nison in his book Japanese Candlestick Charting Techniques.
Candlesticks contain the same data as a normal bar chart but highlight the relationship between opening and closing prices. The narrow stick represents the range of prices traded during the period (high to low) while the broad mid-section represents the opening and closing prices for the period.
If the close is higher than the open - the candlestick mid-section is hollow or shaded blue/green.
If the open is higher than the close - the candlestick mid-section is filled in or shaded red.
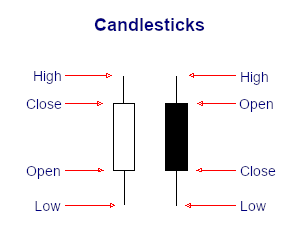
The advantage of candlestick charts is the ability to highlight trend weakness and reversal signals that may not be apparent on a normal bar chart.
$TRTH BarChart Technical Analysis
http://www.barchart.com/technicals/stocks/TRTH
The Rate-of-Change indicator is a momentum oscillator that oscillates above and below the zero line. Coppock used 11 and 14 periods because, according to an Episcopal priest, this was the average mourning period when grieving the loss of a loved one. Coppock theorized that the recovery period for stock market losses would be similar to this time frame.
Simple vs Exponential Moving Averages
Even though there are clear differences between simple moving averages and exponential moving averages, one is not necessarily better than the other. Exponential moving averages have less lag and are therefore more sensitive to recent prices - and recent price changes. Exponential moving averages will turn before simple moving averages. Simple moving averages, on the other hand, represent a true average of prices for the entire time period. As such, simple moving averages may be better suited to identify support or resistance levels.
Moving average preference depends on objectives, analytical style and time horizon. Chartists should experiment with both types of moving averages as well as different timeframes to find the best fit.
Below is an example of a chart with both the SMA
Other than Ulcer Index, volatility measures like standard deviation treat up and down movement equally, but a trader doesn't mind upward movement, it's the downside that causes stress and stomach ulcers that the index's name suggests.
$PFFBQ BarChart Technical Analysis
http://www.barchart.com/technicals/stocks/PFFBQ
Demark Pivot Points
Demark Pivot Points start with a different base and use different formulas for support and resistance. These Pivot Points are conditional on the relationship between the close and the open.
If Close < Open, then X = High (2 x Low) Close
If Close > Open, then X = (2 x High) Low Close
If Close = Open, then X = High Low (2 x Close)
Pivot Point (P) = X/4
Support 1 (S1) = X/2 - High
Resistance 1 (R1) = X/2 - Low
The chart below shows the Russell 2000 ETF (IWM) with Demark Pivot Points on a 15 minute chart. Notice that there is only one resistance (R1) and one support (S1). Demark Pivot Points do not have multiple support or resistance levels.

$NSFE BarChart Technical Analysis
http://www.barchart.com/technicals/stocks/NSFE
As a statistical measure, investors can compare Ulcer Index values to determine relative risk. Martin notes that the Ulcer Index works well with weekly data.
Form S-4 ~ SEC Filings Explained
Registration of securities issued in business combination transactions
$CTDT BarChart Technical Analysis
http://www.barchart.com/technicals/stocks/CTDT
MACD is based on moving averages, it is inherently a lagging indicator. However, in this regard the MACD does not lag as much as a basic moving average crossing indicator, since the signal cross can be anticipated by noting the convergence far in advance of the actual crossing. As a metric of price trends, the MACD is less useful for stocks that are not trending (trading in a range) or are trading with erratic price action.
SEC Filings Explained ~ Form 3
Form 3 is an SEC filing filed with the US Securities and Exchange Commission to indicate a preliminary insider transaction by an officer, director, or beneficial (10%) owner of the company's securities. These are typically seen after a company IPOs when insiders make their first transactions. After a Form 3 is filed, future filings of the same nature are filed under Form 4 (standard disclosure) or Form 5 (annual disclosure).
$STAU BarChart Technical Analysis
http://www.barchart.com/technicals/stocks/STAU
Traders are often inclined to use Bollinger Bands with other indicators to confirm price action. In particular, the use of an oscillator like Bollinger Bands will often be coupled with a non-oscillator indicator like chart patterns or a trendline. If these indicators confirm the recommendation of the Bollinger Bands, the trader will have greater conviction that the bands are predicting correct price action in relation to market volatility.
Form 8-K~ SEC Filings Explained
Form 8-K is a very broad form used to notify investors of any material event that is important to shareholders or the United States Securities and Exchange Commission. This is one of the most common types of forms filed with the SEC. After a significant event like bankruptcy or departure of a CEO, a public company generally must file a Current Report on Form 8-K within four business days to provide an update to previously filed quarterly reports on Form 10-Qand/or Annual Reports on Form 10-K. Form 8-K is required to be filed by public companies with the SEC pursuant to the Securities Exchange Act of 1934, as amended. For a list of events that would trigger a Form 8-K to be filed, see the Official SEC Form 8-K Summary, reproduced below.
When Form 8-K is required
Form 8-K is used to notify investors of a current event. These types of events include:
? Material definitive agreements not made in the ordinary course of business
? Bankruptcies or receiverships
? Director is elected
? Director departs
? If a director departs because of a disagreement with the company on any matter relating to the registrant’s operations, policies, or practices then an 8-K must be filed to disclose a brief description of the circumstances representing the disagreement.[1]
? Asset movement: acquisition or sale
? Result of operations and financial condition
? Material Direct Financial obligations (bonds, debentures)
? Triggering events that accelerate material obligations (defaults on a loan)
? Exit or disposal plans
? Layoffs
? shutting down a plant
? material change in services or outlets
? Material impairments
? Delisting or transfer exchange notices
? Unregistered equity sales
? Modifications to shareholder rights
? Change in accountant - and good idea to explain why
? SEC investigations and internal reviews
? Financial non-reliance notices
? Changes in control of the company
? Someone takes a large equity position (more than 15%); shareholder also needs to file with SEC as to intent
? Someone takes a 51% position
? Changes in executive management
? Officer leaves
? Officer is fired
? Officer is hired
? Departure or appointment of company officers
? Amendments to company Governance Policies
? Code of Ethics
? Board Committee Governance Policies
? Trading suspension
? Change in credit
? Change in company status
? Other events
? Financial exhibits
Investors should always read any 8-K filings that are made by companies in which they are invested. These reports are both material and relevant to the company, and often contain information that will affect the share price.
Reading Form 8K
Typically an 8-K filing will only have two major parts. They are:
? The name and description of the event - this contains all the information that the company considers relevant to shareholders and the SEC. It is important to read this information, as it has been deemed "material" by the company.
? Any exhibits that are relevant - these exhibits may include financial statements, press releases, data tables, or other information that is referenced in the description of the event.
The Money Flow Index is a rather unique indicator that combines momentum and volume with an RSI formula. RSI momentum generally favors the bulls when the indicator is above 50 and the bears when below 50. Even though MFI is considered a volume-weighted RSI, using the centerline to determine a bullish or bearish bias does not work as well. Instead, MFI is better suited to identify potential reversals with overbought/oversold levels, bullish/bearish divergences and bullish/bearish failure swings. As with all indicators, MFI should not be used by itself. A pure momentum oscillator, such as RSI, or pattern analysis can be combined with MFI to increase signal robustness.
BULLISH LADDER BOTTOM
The shorts may have a chance to close their positions and realize their profits by the fourth day of a considerable downtrend. Then we see an upward gap on the fifth day as a result of this. If the body of the fifth day is long, or the volume of trading is high, this may also imply a bullish reversal.

Recognition Criteria:
1. Market is characterized by downtrend.
2. We see three long black candlesticks characterized by consecutively lower opens and a closing sequence just like the Bearish Three Black Crows Pattern.
3. Then we see a black candlestick on the fourth day with an upper shadow.
4. Finally we see a white candlestick opening above the body of the fourth day on the fifth day.
Explanation:
There is a considerable downtrend for some time and the bears are happy. Then we see a good move downward. Prices start trading above the opening price and almost reaching to the new high of the previous day, but then they close at another new low. This action is a warning for shorts telling them that the market will not go down forever. The shorts may then be forced to reevaluate their positions and they may start closing their positions on the next day if profits are good. This act is the reason behind the upward gap we see on the last day of the pattern and also the close is considerably higher. If volume is high on the last day, a trend reversal has probably occurred.
Important Factors:
A confirmation on the sixth day is suggested in the form a white candlestick, a large gap up or a higher close, to be sure that the market has reversed.
$LTCH BarChart Technical Analysis
http://www.barchart.com/technicals/stocks/LTCH
In Keltner's description the centre line is a 10-day simple moving average of typical price, where typical price each day is the average of high, low and close.
$CTSO BarChart Technical Analysis
http://www.barchart.com/technicals/stocks/CTSO
13H, 13H-Q, 13H-A, 13H-I, 13H-R, 13H-T ~ SEC Filings Explained
Large Trader Registration Information Required of Large Traders Pursuant to the Securities Exchange Act of 1934 and Rule 13h-1 Thereunder. Initial Filing (13H), Amended Filing (13H-Q), Annual Filing (13H-A), Inactive Status (13H-I), Reactivated Status (13H-R), and Termination Filing (13H-T)
The MACD turns two trend-following indicators, moving averages, into a momentum oscillator by subtracting the longer moving average from the shorter moving average. As a result, the MACD offers the best of both worlds: trend following and momentum.
$SFEG BarChart Technical Analysis
http://www.barchart.com/technicals/stocks/SFEG
BULLISH ENGULFING
Bullish Engulfing Pattern is a pattern characterized by a large white real body engulfing a preceding small black real body, which appears during a downtrend. The white body does not necessarily engulf the shadows of the black body but totally engulfs the body itself. The Bullish Engulfing Pattern is an important bottom reversal signal.
Recognition Criteria:
1. Market is characterized by downtrend.
2. Then we see a small black body.
3. Next day we see a white body that completely engulfs the black real body of the preceding day.
Explanation:
While the market sentiment is bearish; we see some subsided selling reflected by the short, black real body of the first day. Next day shows bull strength with a closing price at or above the previous day’s open. It means that the downtrend is now losing momentum and the bulls started to take the lead.
Important Factors:
The relative size of the bodies in the first and second days is important. If the first day of the Bullish Engulfing Pattern is characterized by a very small real body (it may even be a doji or nearly a doji) but the second day is characterized by a very long real body, this strongly indicates that the bearish power is diminishing and the disparity of white versus black body is indicative of the emerging bull power.
There is higher probability of a bullish reversal if there is heavy volume on the second real body or if the second day of the Bullish Engulfing Pattern engulfs more than one real body (which essentially means we see two or more small black bodies preceding the long white body).
The reversal of downtrend needs further confirmation on the third day. This confirmation may be in the form of a white candlestick, a large gap up or a higher close on the third day.
Failure swings and divergences can be combined to create more robust signals. A bullish failure swing occurs when MFI becomes oversold below 20, surges above 20, holds above 20 on a pullback and then breaks above its prior reaction high. A bullish divergence forms when prices move to a lower low, but the indicator forms a higher low to show improving money flow or momentum.
$DGRI BarChart Technical Analysis
http://www.barchart.com/technicals/stocks/DGRI
|
Followers
|
3287
|
Posters
|
|
|
Posts (Today)
|
0
|
Posts (Total)
|
2804248
|
|
Created
|
08/22/10
|
Type
|
Free
|
| Moderator Nilbud | |||
| Assistants mick ManicTrader PhotoChick Kirimi $Pistol Pete$ | |||
   Investor Hub Alerts: Sign up for 'STOCKGOODIES PLAYS OF THE WEEK ' E-Mail List Investor Hub Alerts: Sign up for 'STOCKGOODIES PLAYS OF THE WEEK ' E-Mail ListUPDATE; 5-1-22 courtesy of charting /\ wit tweezer top calls /\ Tony @Montana_Trades Really good study sheet on Candlestick Patterns [-chart]pbs.twimg.com/media/FRn8188XMAAdZvk?format=jpg&name=small[/chart] 

02-07-2021
|
|
Posts Today
|
0
|
|
Posts (Total)
|
2804248
|
|
Posters
|
|
|
Moderator
|
|
|
Assistants
|
| Volume | |
| Day Range: | |
| Bid Price | |
| Ask Price | |
| Last Trade Time: |


