 News
News  Market Data
  Discover
Support: 888-992-3836
Copyright © 2023 InvestorsHub Inc.


Register for free to join our community of investors and share your ideas. You will also get access to streaming quotes, interactive charts, trades, portfolio, live options flow and more tools.
$NYXO BarChart Technical Analysis
http://www.barchart.com/technicals/stocks/NYXO
THREE OUTSIDE DOWN
The Bearish Three Outside Down Pattern is another name for the Confirmed Bearish Engulfing Pattern. The third day confirms the bearish trend reversal.
Recognition Criteria:
1. Market is characterized by uptrend.
2. We see a Bearish Engulfing Pattern in the first two days.
3. Then we see a black candlestick on the third day with a lower close than the second day.
Explanation:
The first two days forms a Bearish Engulfing Pattern, and the third day confirms the reversal suggested by the Bearish Engulfing Pattern since it is a black candlestick closing with a new low for the three days. 
Many of today's traders use multiple monitors in order to display several charts and order entry windows. Even if six monitors are used, it should not be considered a green light to devote every square inch of screen space to technical indicators.
$AERO BarChart Technical Analysis
http://www.barchart.com/technicals/stocks/AERO
Form 15F-12G, 15F-12G/A ~ SEC Filings Explained
Notice of termination of a foreign private issuer's registration of a class of securities under Section 12(g) (and amendment thereto)
A bearish failure swing occurs when MFI becomes overbought above 80, plunges below 80, fails to exceed 80 on a bounce and then breaks below the prior reaction low. A bearish divergence forms when the stock forges a higher high and the indicator forms a lower high, which indicates deteriorating money flow or momentum.
$ACDU BarChart Technical Analysis
http://www.barchart.com/technicals/stocks/ACDU
Simple Moving Average or (SMA)
The SMA does not predict the price direction but it smooths out the price action to give a trend indication.
Moving averages are lagging indicators because they are based on past prices. Despite this lag, moving averages help smooth price action and filter out the noise. They are also used to form the building blocks for many other technical indicators and overlays, such as Bollinger Bands, MACD and the McClellan Oscillator. Moving averages can be used to identify the direction of the trend or define potential support and resistance levels.
Here's a chart with a 5 day SMA on it:
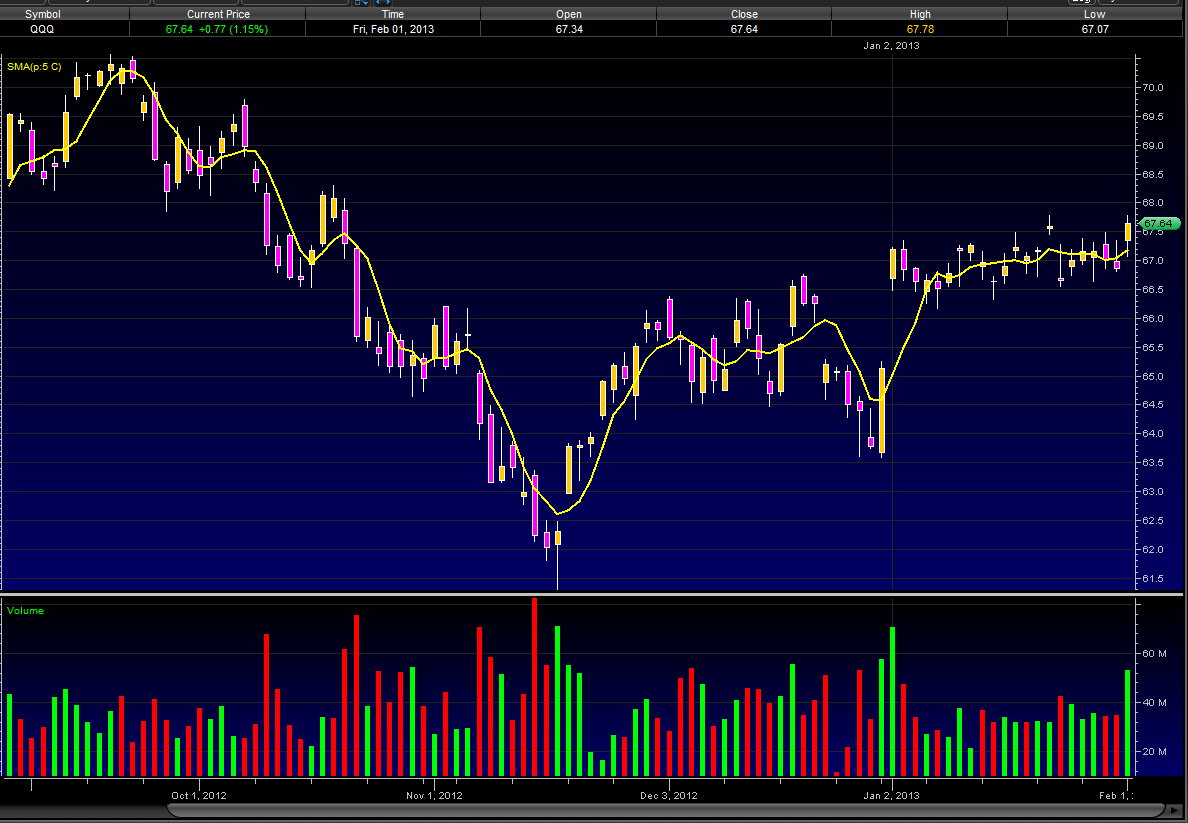
A simple moving average is made by calculating the average price of a security over a specific number of closing costs. The SMA will reflect the average closing cost, based on the time line of the chart you are looking at. i.e.: A 5 SMA on a daily chart will plot a line showing the average closing daily price, on a 60 minute chart that 5 SMA will plot a line showing the average hourly closing price. If the closing price changes so too does the SMA, hence the Moving part of Simple Moving Average. Old data is dropped and new data is added as it comes and goes, making the average move along the timeline. For those who need a visual take a look at how a SMA is plotted.
We will start our SMA on day 5
Daily Closing Prices:
Day 1 ------ 10
Day 2 ------ 12
Day 3 ------ 11
Day 4 ------ 14
Day 5 ------ 13
Day 6 ------ 15
Day 7 ------ 18
Day 8 ------ 19
SMA Plot points:
Day 5 ---- 10 12 11 14 13(closing price each day, 1 through 5) = 60 /5(# of days) = SMA of 12
Day 6 ---- Drop the 10 from day 1 and add the 15 from day 6 = 65 /5 = 13
Day 7 ---- Drop the 12 from day 2 and add 18 from day 7 = 71 /5 = 14.2
Day 8 ---- Drop the 11 from day 3 and add 19 from day 8 = 79 /5 = 15.8
MFI Oversold: This scan searches for stocks that are above $20 per share, trade over 100,000 shares per day and have oversold Money Flow Index (<10). Consider this a starting point for further analysis and due diligence.
$GLTV BarChart Technical Analysis
http://www.barchart.com/technicals/stocks/GLTV
Index ETFs
Most ETFs are index funds that attempt to replicate the performance of a specific index. Indexes may be based on stocks, bonds, commodities, or currencies. An index fund seeks to track the performance of an index by holding in its portfolio either the contents of the index or a representative sample of the securities in the index.[5] As of June 2012, in the United States, about 1200 index ETFs exist, with about 50 actively managed ETFs. Index ETF assets are about $1200 billion, compared with about $7 billion for actively managed ETFs.[18] Some index ETFs, known as leveraged ETFs or inverse ETFs, use investments in derivatives to seek a return that corresponds to a multiple of, or the inverse (opposite) of, the daily performance of the index.[19]
Some index ETFs invest 100% of their assets proportionately in the securities underlying an index, a manner of investing called "replication". Other index ETFs use "representative sampling", investing 80% to 95% of their assets in the securities of an underlying index and investing the remaining 5% to 20% of their assets in other holdings, such as futures, option and swap contracts, and securities not in the underlying index, that the fund's adviser believes will help the ETF to achieve its investment objective. For index ETFs that invest in indices with thousands of underlying securities, some index ETFs employ "aggressive sampling" and invest in only a tiny percentage of the underlying securities
Centerline crossovers are the next most common MACD signals. A bullish centerline crossover occurs when the MACD Line moves above the zero line to turn positive. This happens when the 12-day EMA of the underlying security moves above the 26-day EMA. A bearish centerline crossover occurs when the MACD moves below the zero line to turn negative. This happens when the 12-day EMA moves below the 26-day EMA.
$EKNL BarChart Technical Analysis
http://www.barchart.com/technicals/stocks/EKNL
SEC Filings Explained ~ Form 5
Form 5 is an SEC filing submitted to the Securities and Exchange Commission on an annual basis by company officers, directors, or beneficial (10%) owners, which summarizes their insider trading activities. This form is simply a combination of year's Form 4 filings, which are mandatory filings made shortly after insiders make transactions.
A channel upturn and break above the upper trendline can signal the start of an uptrend. A channel downturn and break below the lower trendline can signal the start a downtrend. Sometimes a strong trend does not take hold after a channel breakout and prices oscillate between the channel lines. Such trading ranges are marked by a relatively flat moving average. The channel boundaries can then be used to identify overbought and oversold levels for trading purposes.
$PREV BarChart Technical Analysis
http://www.barchart.com/technicals/stocks/PREV
Form 6-K~ SEC Filings Explained
Form 6K is an SEC filing submitted to the US Securities and Exchange Commission used by certain foreign private issuers to provide information that is:
? Required to be made public in the country of its domicile
? Filed with and made public by a foreign stock exchange on which its securities are traded
? Are distributed to security holders.
The report must be furnished promptly after such material is made public. The form is not considered "filed" because of Section 18 (for liability purposes). This is the only information furnished by foreign private issuers between annual reports, since such issuers are not required to file on Forms 10-Q or 8-K.
The drawdown of measuring the ulcer index indicator is the Intel stock that had sustained and strong higher movement. These are simple ulcer index indicator that might be able to help you understand more of the standard business procedure.
Like any stock market forecast, the MACD can generate false signals. A false positive, for example, would be a bullish crossover followed by a sudden decline in a stock. A false negative would be a situation where there was no bullish crossover, yet the stock accelerated suddenly upwards.
Parabolic SAR
Introduction
Developed by Welles Wilder, the Parabolic SAR refers to a price and time based trading system. Wilder called this the "Parabolic Time/Price System". SAR stands for "stop and reverse", which is the actual indicator used in the system. SAR trails price as the trend extends over time. The indicator is below prices when prices are rising and above prices when prices are falling. In this regard, the indicator stops and reverses when the price trend reverses and breaks above or below the indicator.
Wilder introduced the Parabolic Time/Price System in his 1978 book, New Concepts in Technical Trading Systems. This book also includes RSI, Average True Range and the Directional Movement Concept (ADX). Despite being developed before the computer age, Wilder's indicators have stood the test of time and remain extremely popular.

Calculation
Calculation of SAR is complex with if/then variables that make it difficult to put in a spreadsheet. These examples will provide a general idea of how SAR is calculated. Because the formulas for rising and falling SAR are different, it is easier to divide the calculation into two parts. The first calculation covers rising SAR and the second covers falling SAR.
Rising SAR
Prior SAR: The SAR value for the previous period.
Extreme Point (EP): The highest high of the current uptrend.
Acceleration Factor (AF): Starting at .02, AF increases by .02 each
time the extreme point makes a new high. AF can reach a maximum
of .20, no matter how long the uptrend extends.
Current SAR = Prior SAR Prior AF(Prior EP - Prior SAR)
13-Apr-10 SAR = 48.28 = 48.13 .14(49.20 - 48.13)
The Acceleration Factor is multiplied by the difference between the
Extreme Point and the prior period's SAR. This is then added to the
prior period's SAR. Note however that SAR can never be above the
prior two periods' lows. Should SAR be above one of those lows, use
the lowest of the two for SAR.


Falling SAR
Prior SAR: The SAR value for the previous period.
Extreme Point (EP): The lowest low of the current downtrend.
Acceleration Factor (AF): Starting at .02, AF increases by .02 each
time the extreme point makes a new low. AF can reach a maximum
of .20, no matter how long the downtrend extends.
Current SAR = Prior SAR - Prior AF(Prior SAR - Prior EP)
9-Feb-10 SAR = 43.56 = 43.84 - .16(43.84 - 42.07)
The Acceleration Factor is multiplied by the difference between the
Prior period's SAR and the Extreme Point. This is then subtracted
from the prior period's SAR. Note however that SAR can never be
below the prior two periods' highs. Should SAR be below one of
those highs, use the highest of the two for SAR.


Interpretation
SAR follows price and can be considered a trend following indicator. Once a downtrend reverses and starts up, SAR follows prices like a trailing stop. The stop continuously rises as long as the uptrend remains in place. In other words, SAR never decreases in an uptrend and continuously protects profits as prices advance. The indicator acts as a guard against the propensity to lower a stop-loss. Once price stops rising and reverses below SAR, a downtrend starts and SAR is above the price. SAR follows prices lower like a trailing stop. The stop continuously falls as long as the downtrend extends. Because SAR never rises in a downtrend, it continuously protects profits on short positions.
Step Increments
The Acceleration Factor (AF), which is also referred to as the Step, dictates SAR sensitivity. SharpCharts users can set the Step and the Maximum Step. As shown in the spreadsheet example, the Step is a multiplier that influences the rate-of-change in SAR. That is why it is referred to as the Acceleration Factor. Step gradually increases as the trend extends until it hits a maximum. SAR sensitivity can be decreased by decreasing the Step. A lower step moves SAR further from price, which makes a reversal less likely.
SAR sensitivity can be increased by increasing the step. A higher step moves SAR closer to the price action, which makes a reversal more likely. The indicator will reverse too often if the step is set too high. This will produce whipsaws and fail to capture the trend. Chart 6 shows IBM with SAR (.01, .20). The step is .01 and the Maximum Step is .20. Chart 7 shows IBM with a higher Step (.03). SAR is more sensitive in chart 7 because there are more reversals. This is because the Step is higher in chart 7 (.03) than chart 6 (.01).


Maximum Step
The sensitivity of the indicator can also be adjusted using the Maximum Step. While the Maximum Step can influence sensitivity, the Step carries more weight because it sets the incremental rate-of-increase as the trend develops. Also note that increasing the Step insures that the Maximum Step will be hit quicker when a trend develops. Chart 8 shows Best Buy (BBY) with a Maximum Step (.10), which is lower than the default setting (.20). This lower Maximum Step decreases the sensitivity of the indicator and produces fewer reversals. Notice how this setting caught a two month downtrend and a subsequent two month uptrend. Chart 9 shows BBY with a higher Maximum Step (.20). This higher reading produced extra reversals in early February and early April.


Conclusions
The Parabolic SAR works best with trending securities, which occur roughly 30% of the time according to Wilder's estimates. This means the indicator will be prone to whipsaws over 50% of the time or when a security is not trending. After all, SAR is designed to catch the trend and follow it like a trailing stop. As with most indicators, the signal quality depends on the settings and the characteristics of the underlying security. The right settings combined with decent trends can produce a great trading system. The wrong settings will result in whipsaws, losses and frustration. There is no golden rule or one-size-fits-all setting. Each security should be evaluated based on its own characteristics. Parabolic SAR should also be used in conjunction with other indicators and technical analysis techniques. For example, Wilder's Average Directional Index can be used to estimate the strength of the trend before considering signals.
Scans
Break above falling SAR: This scan starts with stocks that have an average price of $10 or greater over the last three months and average volume greater than 40,000. The scan then filters for stocks that have a bullish SAR reversal (Parabolic SAR (.01,.20)). This scan is just meant as a starter for further refinement.
Break below rising SAR: This scans starts with stocks that have an average price of $10 or greater over the last three months and average volume greater than 40,000. The scan then filters for stocks that have a bearish SAR reversal (Parabolic SAR (.01,.20)). This scan is just meant as a starter for further refinement.
This index can be used as it is, but it is better to approximate it with the help of Moving Average. Approximation with the help a short moving average (the author proposes to use 2 intervals) contributes to finding the best opportunity to open and close positions.
SEC Filings Explained ~ POS AM Form
Post-effective amendments to provide updated prospectus information.
RSI is an extremely popular momentum indicator that has been featured in a number of articles, interviews and books over the years. In particular, Constance Brown's book, Technical Analysis for the Trading Professional, features the concept of bull market and bear market ranges for RSI. Andrew Cardwell, Brown's RSI mentor, introduced positive and negative reversals for RSI. In addition, Cardwell turned the notion of divergence, literally and figuratively, on its head.
For RSI values, Taking the prior value plus the current value is a smoothing technique similar to that used in exponential moving average calculation. This also means that RSI values become more accurate as the calculation period extends. SharpCharts uses at least 250 data points prior to the starting date of any chart (assuming that much data exists) when calculating its RSI values. To exactly replicate our RSI numbers, a formula will need at least 250 data points.
$TMBXF -Tombstone Exploration Corporation (TMBXF) is focused primarily on exploration and development of mineral resources. Tombstone Exploration Corporation has the mineral rights to approximately 5,000 acres of historical mining land in the areas around Tombstone, Arizona and is the largest landholder in the Tombstone Mining District.
http://www.tombstonemining.com/
ROC - Rate Of Change Video
WATCH VIDEO - CLICK HERE <-

Learn all aspects of trading penny stocks in Chart School, Videos include;
Accumulation Distribution
ADX - Average Directional Index
Aroon
ATR - Average True Range
Bollinger %B
Bollinger Band Width
CCI - Commodity Channel Index
Chaikin Oscillator
CMF - Chaikin Money Flow
Coppock Curve
Correlation Coefficient
EMV- Ease of Movement
Fibonacci Retracement
Force Index
KST - Know Sure Thing
MACD Histogram
Mass Index
MFI - Money Flow Index
OBV - On Balance Volume
PPO - Percentage Price Oscillator
PVO - Percentage Volume Oscillator
ROC - Rate Of Change
Standard Deviation - Volatility
Stochastics RSI
Support and Resistance
TRIX
TSI - True Strength Index
Ulcer Index
Ultimate Oscillator
Volume by Price
VTX - Vortex Indicator
Williams % R
Chart Setup 1
Chart Setup 2
Chart Patterns 1
Chart Patterns 2 The Best Bullish and Bearish Patterns
Choosing Indicators
Best part is that it's all FREE!
So what are you waiting for - Get started now!
Hearing that $VIDA could be the next crypto play. Put this one on your radar.
ADAC all eyes here! New play forming. up 90% on 20 day moving avg. Runners take your marks!
LXGTF nice consistent play. LIQUID! .477 almost a new 52 week high.
$ITKH .0026 NO TOXIC or convertible debt! Millions in revenues
Read this awesome DD and see why this low sub penny stock has been overlooked and could be the BEST investment you have ever made!
I only give you BIG winners, last 2 picks RXM* & BLP* both have gone up over 100% since my alert! $ITKH will do the same, get some shares and enjoy the ride!
Awesome ITKH due diligence
$RAD come on break 1.90 and BOOM into the close
$ITKH .0026 Dodge, Chevrolet, Chrysler all clients. Explosive growth happening, under the radar!
Read this awesome DD and see why this low sub penny stock has been overlooked and could be the BEST investment you have ever made!
I only give you BIG winners, last 2 picks RXM* & BLP* both have gone up over 100% since my alert! $ITKH will do the same, get some shares and enjoy the ride!
Awesome ITKH due diligence
$ITKH & TransMedia Group is one of the country’s leading public relations firms in confirmed acquisitions discussions, share price is going to skyrocket!
Read this awesome DD and see why this low sub penny stock has been overlooked and could be the BEST investment you have ever made!
I only give you BIG winners, last 2 picks RXM* & BLP* both have gone up over 100% since my alert! $ITKH will do the same, get some shares and enjoy the ride!
Awesome ITKH due diligence
$REFG - Alternative payment solution empowers businesses by tracking sales and tax collection, frees consumers and retailers from solely using cash
$SMGI UP 62% Checkout $REFG and $MJOG #oilandgas #CannabisCommunity
$ITKH .0026 partnering with Google and Microsoft _Flush with CASH in the bank and revenues coming in spades!
Read this awesome DD and see why this low sub penny stock has been overlooked and could be the BEST investment you have ever made!
I only give you BIG winners, last 2 picks RXM* & BLP* both have gone up over 100% since my alert! $ITKH will do the same, get some shares and enjoy the ride!
https://darthtraderstocks.blogspot.com/2017/12/americas-most-undervalued-stocks-1_8.html" rel="nofollow" target="_blank" >https://darthtraderstocks.blogspot.com/2017/12/americas-most-undervalued-stocks-1_8.html[tag]Awesome ITKH due dil
$HMLA .0036 36 million O\S NOT A MISPRINT I'll just keep posting facts!!!! HMLA that HMLA HAS HAD MORE BUYS THAN SELLS the last 9 trading days. HMLA SHARES ARE SCARCE and the ones available are already being held because this float is locked and my friends and I are on ALL BIDS to get as many of these 4s as possible. NOTHING can stop us from grabbing every HMLA share here if you haven't noticed by the LARGE bids STACKED daily. Lol
HMLA FLOAT IS LOCKED AND BIDS STACKED daily. We got this. HMLA is too good to be true
HMLA O/S 36 MILLION AT 0049? UNHEARD OF
HNLA MMJ
HMLA BITCOIN
HMLA 25 CENTS PLUS, These subs will be history soon
HMLA NEW HANDS LOADING
HMLA lies won't work and not working, we prefer facts
HMLA JUST FILED
HMLA new website
HMLA is so easy a prediction
HMLA I AM TOO EXCITED AT where we will be after the crowd catches on.
HMLA HMLA HMLA HMLA HMLA !!! WEEEEEEEEEEEEEEEEE
hmla hmla hmla hmla hmla hmla hmla
hmla hmla hmla hmla hmla hmla hmla
hmla hmla hmla hmla hmla hmla hmla
hmla hmla hmla hmla hmla hmla hmla
hmla hmla hmla hmla hmla hmla hmla
hmla hmla hmla hmla hmla hmla hmla
hmla hmla hmla hmla hmla hmla hmla
hmla hmla hmla hmla hmla hmla hmla
hmla hmla hmla hmla hmla hmla hmla
hmla hmla hmla hmla hmla hmla hmla
hmla hmla hmla hmla hmla hmla hmla
hmla hmla hmla hmla hmla hmla hmla
SEE YOU AT 25 CENTS. WEEEEEEEEEEEEEEEEEEEEEEEE.
hmla hmla hmla hmla hmla hmla hmla
$ASTI Solar also powers #Drones and #uav http://www.thesultansofswingtrading.com/2016/11/asti-ascent-solar-technologies-award.html
$ITKH .0026 RECORD REVENUES month over month
Read this awesome DD and see why this low sub penny stock has been overlooked and could be the BEST investment you have ever made!
I only give you BIG winners, last 2 picks RXM* & BLP* both have gone up over 100% since my alert! $ITKH will do the same, get some shares and enjoy the ride!
Awesome ITKH due diligence
$PPPMF Primero Mining Corp., a precious metals producer, engages in the acquisition, exploration, development, and operation of mineral resource properties in Canada and Mexico. The company primarily explores for gold and silver deposits. It holds interests in the San Dimas Mine and the Cerro del Gallo project located in Mexico; and the Black Fox mine and adjoining properties located in the Timmins mining district, Ontario, Canada. The company was formerly known as Mala Noche Resources Corp. and changed its name to Primero Mining Corp. in August 2010. Primero Mining Corp. is based in Toronto, Canada.
STSC MJ reverse merger filing -- major cannabis player taking over shell! Low O/S -- no dilution confirmed.
$$$ Holding for copper!!! $$$
$ITKH .0026 NO DILUTION IN FIVE YEARS!
Read this awesome DD and see why this low sub penny stock has been overlooked and could be the BEST investment you have ever made!
I only give you BIG winners, last 2 picks RXM* & BLP* both have gone up over 100% since my alert! $ITKH will do the same, get some shares and enjoy the ride!
Awesome ITKH due diligence
$KNDI Launch of Kandi Global Hawk K17AS Marks Start of Pure Electric Car-Share Era in China
http://www.newsfilecorp.com/release/28290/Launch-of-Kandi-Global-Hawk-K17AS-Marks-Start-of-Pure-Electric-CarShare-Era-in-China
$GEVO is breaking out!!!!!!!!!!!
$ITKH .0024 America's Most Undervalued Stock see why
Read this awesome DD and see why this low sub penny stock has been overlooked and could be the BEST investment you have ever made!
I only give you BIG winners, last 2 picks RXM* & BLP* both have gone up over 100% since my alert! $ITKH will do the same, get some shares and enjoy the ride!
Awesome ITKH due diligence
dpww has this stock fallen off the radar? $3.00 down to .03. I think big things are around the corner for legalization.
HMLA COULD RUN 10,000%+ TRUE STORY, HERES WHY. HMLA JUST CAME OUT OF THE DARK WITH 3 FILINGS AND GOING INTO MMJ WITH THE SMALLEST SHARE STRUCTURE VS PRICE IN MARIJUANA INDUSTRY HISTORY.
Amended Statement of Ownership (sc 13g/a)
Date : 09/08/2017 @ 5:29PM
Source : Edgar (US Regulatory)
Stock : Homeland Resources Ltd. (PN) (HMLA)
Quote : 0.0045 0.0005 (12.50%) @ 12:10PM
https://ih.advfn.com/p.php?pid=nmona&article=75612466
HMLA website updated to accept bitcoin payments
OWNING OUR OWN BITCOIN PAYMENT PROCESSING COMPANY MEANS WE CAN ACCEPT PAYMENTS IN ANY AMOUNT FROM ANYWHERE IN THE WORLD
MJ+bitcoin huge gains coming. 25 cents+ when news hits
HMLA recent chronological sequence of events:
On July 14th, 2017 https://homelandcannabis.com/ was created and launched!
The site only said "coming soon"
That same day the site was immediately copyrighted as follows:
Copyright © 2017 - HOMELAND RESOURCES INC - All Rights Reserved.
But when people checked again it had changed to:
Copyright © 2017 - HOMELAND CANNABIS LTD - All Rights Reserved.
A further exploration of the URL owner came back as privacy protected.
Then on July 31st, 2017 Homeland Resources, Ltd. got reinstated on Nevada SOS.
Then on Monday August 7th the website changed from just "coming soon" to having 3 MJ divisions created on the site.
Then on Wednesday August 9th all the Homeland Resources old officers and directors were removed from Nevada SOS and the company was changed from an LLC to a "Series LLC"
So although there's been ZERO news or filings put out by whoever the new HMLA officers and directors will be...there's no such thing as coincidences when the dots start connecting and these PubCo's are being brought back from the dead.
HMLA still has an Authorized Shares amount of 100M only according to Nevada SOS
HMLA ONLY HAS 36 MILLION O\S!!! Not a misprint, no need to scratch your eyes its true. HMLA has only 100 million A/S don't scratch your eyes there either . EVERY SINGLE LOW FLOAT TRADER SHOULD BE IN HMLA RIGHT NOW BUT THEY ARE SLEEPING. They wont be sleeping for long. HAVE YOU GUYS BEEN SEEING THE BIDSSSSSSSSSSSSSS STACKED UP??? And not only are they there, THEY ARE NOT GETTING FILLED. HANDS STRONGER THAN A DIAMOND. Do you think HMLA will run to $1 or $3?
IN ANY BUSINESS FIELD WHEN ONE CONDUCTS SOUND RESEARCH, the first thing they do is perform a COMPARATIVE MARKET ANALYSIS. Its simple as black and white... straight forward, straight shooting fact finding. JUXTAPOSE whatever you are researching with its peers. HMLA FELLAS COMPARE HMLA SHARE STRUCTURE WITH ALL OTHER MMJ RELATED STOCKS...ACTUALLY ANY PENNYSTOCK OUT OF 10,000 OUT THERE. NOW LOOK AT THE PRICE. Something big is going on behind the scenes. HMLA is undervalued big time, not that many shares left. Thinning out
I dont know how to get to you rookies, well, you will see....ugh.
COMPARE HMLA MICROSCOPIC 36 MILLION A\S to its peers LISTED BELOW. The next update will blow single cents out the water for HMLA IMO.
HEMP .04 52WKH .07
A/S
5,500,000,000!!! a/o Jun 30, 2016
O/S
754,027,180
CBIS .113 52WKH....13
A/S
Not Available
O/S
2,312,305,296!!! a/o Nov 07, 2016
MJNA 14 52WKH...28
A/S
5,000,000,000 a/o Sep 30, 2016
O/S
3,025,841,854 a/o Sep 30, 2016
PHOT .015 52wkh .085
A/S
3,000,000,000 a/o Dec 01, 2016
O/S
1,596,570,761 a/o Dec 01, 2016
EDXC .066 52 week high 9 cents!
A/S
1,000,000,000 a/o Dec 31, 2016
O/S
247,632,774 a/o Dec 31, 2016
EVEN ERBB .0015 52WKH .009 IS HIGHER AND IT HAS 14 BILLION A\S!!! 14 BILLION!!!
A/S
14,750,000,000!!! a/o Dec 31, 2016
O/S
11,379,401,405 a/o Dec 31, 2016
GRNH 0.091 0.0171 - 0.159
A/S
500,000,000 a/o Jun 30, 2016
O/S
307,342,246 a/o Jun 30, 2016
TRTC .30 52wk Range 0.135 - 0.7455
A/S
990,000,000!! a/o Feb 16, 2017
O/S
568,186,036 a/o Feb 16, 2017
MCIG .35 52wk Range 0.0255 - 0.505
A/S
560,000,000 a/o Aug 31, 2016
O/S
340,614,339 a/o Nov 15, 2016
VAPE .0099 52wk Range 0.0012 - 0.032
A/S
1,000,000,000 a/o Jan 16, 2015
O/S
213,676,990 a/o Feb 22, 2016
VBIO 2.23 52wk Range 0.463 - 4.24
A/S
1,000,000,000 a/o Sep 30, 2016
O/S
17,786,515 a/o Feb 13, 2017
RFMK .015 52wk Range 0.0003 - 0.049
A/S
20,000,000,000 a/o Jan 30, 2017
O/S
1,274,496,618 a/o Jan 30, 2017
HMLA ONLY HAS 100 MIL A\S AND IT'S DOWN HERE AT .0045??
HMLA HAS BEEN FLYING UNDER THE RADAR, BASICALLY UNKNOWN FOR THE LAST 4 MONTHS SINCE IT CAME OUT THE DARK. The crowd will be here late.
HMLA doesn't need koolaid, or one doesn't need to be a rocket scientist to analyze this chart.
HMLA IS A STANDING PRESENTATION OF "I should have got that stock, I knew it would run to 8 cents, I even told my friend :×< "
HMLA HMLA HMLA HMLA HMLA HMLA HMLA
HMLA HMLA HMLA HMLA HMLA HMLA HMLA
HMLA HMLA HMLA HMLA HMLA HMLA HMLA
HMLA HMLA HMLA HMLA HMLA HMLA HMLA!!!!
hmla hmla hmla hmla hmla hmla hmla
hmla hmla hmla hmla hmla hmla hmla
hmla hmla hmla hmla hmla hmla hmla
hmla hmla hmla hmla hmla hmla hmla
hmla hmla hmla hmla hmla hmla hmla
hmla hmla hmla hmla hmla hmla hmla
hmla hmla hmla hmla hmla hmla hmla
hmla hmla hmla hmla hmla hmla hmla
hmla hmla hmla hmla hmla hmla hmla
hmla hmla hmla hmla hmla hmla hmla
hmla hmla hmla hmla hmla hmla hmla
hmla hmla hmla hmla hmla hmla hmla
SEE YOU AT 25 CENTS. WEEEEEEEEEEEEEEEEEEEEEEEE.
hmla hmla hmla hmla hmla hmla hmla
Time to grab the last cheap shares of $MVTG. I called the huge massive runs in $STLT $OPXS $IFUS this week. $MVTG is next
VTX - Vortex Indicator Video
WATCH VIDEO - CLICK HERE <-
Learn all aspects of trading penny stocks in Chart School, Videos include;
Accumulation Distribution
ADX - Average Directional Index
Aroon
ATR - Average True Range
Bollinger %B
Bollinger Band Width
CCI - Commodity Channel Index
Chaikin Oscillator
CMF - Chaikin Money Flow
Coppock Curve
Correlation Coefficient
EMV- Ease of Movement
Fibonacci Retracement
Force Index
KST - Know Sure Thing
MACD Histogram
Mass Index
MFI - Money Flow Index
OBV - On Balance Volume
PPO - Percentage Price Oscillator
PVO - Percentage Volume Oscillator
ROC - Rate Of Change
Standard Deviation - Volatility
Stochastics RSI
Support and Resistance
TRIX
TSI - True Strength Index
Ulcer Index
Ultimate Oscillator
Volume by Price
VTX - Vortex Indicator
Williams % R
Chart Setup 1
Chart Setup 2
Chart Patterns 1
Chart Patterns 2 The Best Bullish and Bearish Patterns
Choosing Indicators
Best part is that it's all FREE!
So what are you waiting for - Get started now!
Wow ISOLF, ISOL CSE 2nd PR of the day! https://finance.yahoo.com/news/isodiol-international-inc-executes-definitive-190000372.html
Best chart on market.
|
Followers
|
3289
|
Posters
|
|
|
Posts (Today)
|
0
|
Posts (Total)
|
2804248
|
|
Created
|
08/22/10
|
Type
|
Free
|
| Moderator Nilbud | |||
| Assistants mick ManicTrader PhotoChick Kirimi $Pistol Pete$ | |||
   Investor Hub Alerts: Sign up for 'STOCKGOODIES PLAYS OF THE WEEK ' E-Mail List Investor Hub Alerts: Sign up for 'STOCKGOODIES PLAYS OF THE WEEK ' E-Mail ListUPDATE; 5-1-22 courtesy of charting /\ wit tweezer top calls /\ Tony @Montana_Trades Really good study sheet on Candlestick Patterns [-chart]pbs.twimg.com/media/FRn8188XMAAdZvk?format=jpg&name=small[/chart] 

02-07-2021
|
|
Posts Today
|
0
|
|
Posts (Total)
|
2804248
|
|
Posters
|
|
|
Moderator
|
|
|
Assistants
|
| Volume | |
| Day Range: | |
| Bid Price | |
| Ask Price | |
| Last Trade Time: |


