 News
News  Market Data
  Discover
Support: 888-992-3836
Copyright © 2023 InvestorsHub Inc.


Register for free to join our community of investors and share your ideas. You will also get access to streaming quotes, interactive charts, trades, portfolio, live options flow and more tools.
The Ulcer Index measures risk by focusing on drawdowns represented by price declines. This means it is best suited for long only investors or traders. The index hovers near zero when prices regularly record higher highs and advance. The index rises when prices move lower and extend from their recent high. Keep in mind that the Ulcer Index is not an indicator per se. It is just a measure of downside risk that can be used to compute risk-adjusted returns.
$RFMK BarChart Technical Analysis
http://www.barchart.com/technicals/stocks/RFMK
Volatility is based on the standard deviation, which changes as volatility increases and decreases. The bands automatically widen when volatility increases and narrow when volatility decreases. This dynamic nature of Bollinger Bands also means they can be used on different securities with the standard settings.
$XTGR BarChart Technical Analysis
http://www.barchart.com/technicals/stocks/XTGR
Form S-4 ~ SEC Filings Explained
Registration of securities issued in business combination transactions

$DTVI BarChart Technical Analysis
http://www.barchart.com/technicals/stocks/DTVI
Other than Ulcer Index, volatility measures like standard deviation treat up and down movement equally, but a trader doesn't mind upward movement, it's the downside that causes stress and stomach ulcers that the index's name suggests.
SEC Filings Explained ~ Form 4
Form 4 is a United States SEC filing that relates to insider trading. Every director, officer or owner of more than ten percent of a class of equity securities registered under Section 12 of the Securities Exchange Act of 1934 must file with the United States Securities and Exchange Commission a statement of ownership regarding such security. The initial filing is on Form 3 and changes are reported on Form 4. The Annual Statement of beneficial ownership of securities is on Form 5. The forms contain information on the reporting person's relationship to the company and on purchases and sales of such equity securities.
Form 4 is stored in SEC's EDGAR database. EDGAR is Electronic Data Gathering, Analysis and Retrieval System. It is a registered trademark of the SEC.
A Form 4 must be filed before the end of the second business day following a change in ownership of securities or derivative securities (including the exercise or grant of stock options) for individuals subject to Section 16 of the Securities Exchange Act of 1934.
$VKML BarChart Technical Analysis
http://www.barchart.com/technicals/stocks/VKML
Indicators are calculations based on price and volume history of a ticker. There are many different indicators, each with a unique formula used to measure such things as volatility, momentum, trend and money flow.
Bullish Morning Doji Star
• Direction: Bullish
• Type: Reversal
• Reliability: Strong

• After an established down trending day-one is a long red day
• Day-two is a doji where the open and close are equal.
• Day-three is a blue day
Bullish Morning Doji Stars are a rare reversal pattern that offers one of the strongest bullish reversal signals in the Forex Market. Morning Star formations are characterized by a continuation of a bearish trend followed by a Doji, reflecting uncertainty in the strength of trend.
Up to day two we actually have a Doji Star formation, a moderate strength bullish pattern. After the day of indecision, the trend reversal is confirmed when a rally creates the large bullish candle. The stronger the move up on day-three, the stronger the reversal signal. Watch for additional bullish price action in the next few days.
In FX this formation practically identical to the bullish Abandoned baby. In non-FX markets candlestick analysts traditionally look for gaps to signal the strength of the Morning Doji Star pattern. Gaps between the close price and open price are very common outside efficient FX markets, since exchanges are traditionally limited to very short trading periods. Because Foreign Exchange trades 24 hours, gaps are very uncommon and need to be ignored in identifying Morning Star patterns.
$PSPW BarChart Technical Analysis
http://www.barchart.com/technicals/stocks/PSPW
The ulcer index is a stock market risk measure or technical analysis indicator devised by Peter Martin in 1987,[1] and published by him and Byron McCann in their 1989 book The Investors Guide to Fidelity Funds. It's designed as a measure of volatility, but only volatility in the downward direction, i.e. the amount of drawdown or retracement occurring over a period.
UPSIDE GAP TWO CROWS
The Bearish Upside Gap Two Crows Pattern is a three-candlestick pattern and it signals a top reversal. The first candlestick is a long white candlestick followed by a real body that gaps higher. Then another black real body appears, which opens above the second day’s open and closes under the second day’s close, completing the pattern
Recognition Criteria:
1. Market is characterized by uptrend.
2. We see a long white candlestick in the first day that signals the continuation of uptrend.
3. Then we see a black body with a gap up on second day.
4. The third day is characterized by another black candlestick having an opening above the first black day and also closing below the body of the first black day. The body of third day engulfs the body of the first day.
5. The close of the second black candlestick is still above the close of the first long white candlestick.
Explanation:
The market is in an uptrend and it displays a higher opening with a gap. However the new highs of the day cannot hold and the market forms a black candlestick. However the bulls still comfort themselves by the fact that the close on this black candlestick day is still above the prior day’s close. The third day however increases the bearish sentiment displaying another new high but failing to hold these highs until the close. Also the day closes below the prior day’s close, which is another bearish sign. . So the following question becomes relevant. If the market is so strong, why the new highs fail to hold and why market closes lower? The answer is clear. Market is not now as strong as the bulls would like to believe.
$HESG BarChart Technical Analysis
http://www.barchart.com/technicals/stocks/HESG
Chaikin Money Flow Turns Negative and RSI Moves Below 45: This scan starts with a base of stocks that are averaging at least $10 in price and 100,000 in daily volume over the last 60 days. Distribution and selling pressure are identified when Chaikin Money Flow moves into negative territory. Price momentum confirms when RSI moves below 50, its centerline. This scan is meant as a starting point for further analysis and due diligence.
Evening Star
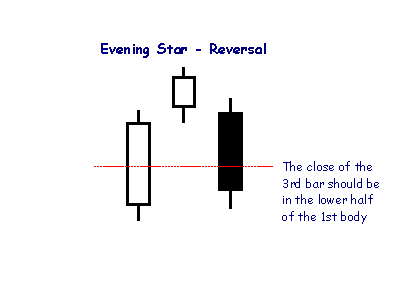
The Evening Star pattern is opposite to Morning Star and is a reversal signal at the end of an up-trend. The pattern is more bearish if the second candlestick is filled rather than hollow.
$UNDT BarChart Technical Analysis
http://www.barchart.com/technicals/stocks/UNDT
Price Performance - The percentage change of the closing value for a ticker. The starting point for the formula is the first closing value on the left edge of the chart.
ETF’s Explained
An exchange-traded fund (ETF) is an investment fund traded on stock exchanges, much like stocks.[1] An ETF holds assets such as stocks, commodities, or bonds, and trades close to its net asset value over the course of the trading day. Most ETFs track an index, such as a stock index or bond index. ETFs may be attractive as investments because of their low costs, tax efficiency, and stock-like features.[2][3] ETFs are the most popular type of exchange-traded product.[citation needed]
Only so-called authorized participants (typically, large institutional investors) actually buy or sell shares of an ETF directly from or to the fund manager, and then only in creation units, which are large blocks of tens of thousands of ETF shares, usually exchanged in-kind with baskets of the underlying securities. Authorized participants may wish to invest in the ETF shares for the long-term, but they usually act as market makers on the open market, using their ability to exchange creation units with their underlying securities to provide liquidity of the ETF shares and help ensure that their intraday market price approximates to the net asset value of the underlying assets.[4] Other investors, such as individuals using a retail broker, trade ETF shares on this secondary market.
An ETF combines the valuation feature of a mutual fund or unit investment trust, which can be bought or sold at the end of each trading day for its net asset value, with the tradability feature of a closed-end fund, which trades throughout the trading day at prices that may be more or less than its net asset value. Closed-end funds are not considered to be "ETFs", even though they are funds and are traded on an exchange. ETFs have been available in the US since 1993 and in Europe since 1999. ETFs traditionally have been index funds, but in 2008 the U.S. Securities and Exchange Commission began to authorize the creation of actively managed ETFs.
$WSRA BarChart Technical Analysis
http://www.barchart.com/technicals/stocks/WSRA
The Money Flow Index (MFI) is an oscillator that uses both price and volume to measure buying and selling pressure. Created by Gene Quong and Avrum Soudack, MFI is also known as volume-weighted RSI.
Form TA-2 ~ SEC Filings Explained
Annual report of transfer agent activities filed pursuant to the Securities Exchange Act of 1934
$HYSYF BarChart Technical Analysis
http://www.barchart.com/technicals/stocks/HYSYF
Volume - The volume data for a specific ticker. Volume can be displayed as an overlay behind price or in its own individual panel.
Nasdaq-100 Index Tracking Stock (Nasdaq:QQQQ)
This ETF represents the Nasdaq-100 Index, which consists of the 100 largest and most actively traded non-financial stocks on the Nasdaq, QQQQ offers broad exposure to the tech sector. Because it curbs the risk that comes with investing in individual stocks, the QQQQ is a great way to invest in the long-term prospects of the technology industry. The diversification it offers can be a huge advantage when there's volatility in the markets. If a tech company falls short of projected earnings, it will likely be hit hard. Between 2000 and 2004, QQQQ was by far the most heavily traded index fund.
$WCYN BarChart Technical Analysis
http://www.barchart.com/technicals/stocks/WCYN
Positive Divergence: At the same time the price is declining we actually see a longer term Positive Divergence occurring from June to December. This essentially means that the “Gas in the tank of the sellers is slowly reducing”
Form N-30B-2 ~ SEC Filings Explained
Periodic and interim reports mailed to investment company shareholders
$NHVCF BarChart Technical Analysis
http://www.barchart.com/technicals/stocks/NHVCF
Three factors affect Force Index values. First, the Force Index is positive when the current close is above the prior close. The Force Index is negative when the current close is below the prior close. Second, the extent of the move determines the volume multiplier.
A great reason to consider ETFs is that they simplify index and sector investing in a way that is easy to understand. If you feel a turnaround is around the corner, go long. If, however, you think ominous clouds will be over the market for some time, you have the option of going short.
The combination of the instant diversification, low cost and the flexibility that ETFs offer, makes these instruments one of the most useful innovations and attractive pieces of financial engineering to date.
$SUGO BarChart Technical Analysis
http://www.barchart.com/technicals/stocks/SUGO
The Ulcer index is based on a given past period of N days. Working from oldest to newest a highest price (highest closing price) seen so-far is maintained, and any close below that is a retracement, expressed as a percentage.
Form 11-K, 11-K/A ~ SEC Filings Explained
Annual report of employee stock purchase, savings and similar plans (and amendment thereto)
$WLOL BarChart Technical Analysis
http://www.barchart.com/technicals/stocks/WLOL
MFI is constructed in a similar fashion to the relative strength index. Both look at up days against total up plus down days, but the scale, i.e. what is accumulated on those days, is volume (or dollar volume approximation rather) for the MFI, as opposed to price change amounts for the RSI.
Demark Pivot Points
Demark Pivot Points start with a different base and use different formulas for support and resistance. These Pivot Points are conditional on the relationship between the close and the open.
If Close < Open, then X = High (2 x Low) Close
If Close > Open, then X = (2 x High) Low Close
If Close = Open, then X = High Low (2 x Close)
Pivot Point (P) = X/4
Support 1 (S1) = X/2 - High
Resistance 1 (R1) = X/2 - Low
The chart below shows the Russell 2000 ETF (IWM) with Demark Pivot Points on a 15 minute chart. Notice that there is only one resistance (R1) and one support (S1). Demark Pivot Points do not have multiple support or resistance levels.

$HENI BarChart Technical Analysis
http://www.barchart.com/technicals/stocks/HENI
Each period's Money Flow Volume depends on the Money Flow Multiplier. This multiplier is positive when the close is in the upper a half of the period's high-low range and negative when the close is in the lower half. The multiplier equals 1 when the close equals the high and -1 when the close equals the low. In this way the multiplier adjusts the amount of volume that ends up in Money Flow Volume.
Pivot Points ~ Support and Resistance
Support and resistance levels based on Pivot Points can be used just like traditional support and resistance levels. The key is to watch price action closely when these levels come into play. Should prices decline to support and then firm, traders can look for a successful test and bounce off support. It often helps to look for a bullish chart pattern or indicator signal to confirm an upturn from support. Similarly, should prices advance to resistance and stall, traders can look for a failure at resistance and decline. Again, chartists should look for a bearish chart pattern or indicator signal to confirm a downturn from resistance.

The second support and resistance levels can also be used to identify potentially overbought and oversold situations. A move above the second resistance level would show strength, but it would also indicate an overbought situation that could give way to a pullback. Similarly, a move below the second support would show weakness, but would also suggest a short-term oversold condition that could give way to a bounce.

$VUNCF BarChart Technical Analysis
http://www.barchart.com/technicals/stocks/VUNCF
Form 1-E, 1-E/A ~ SEC Filings Explained
Notification under Regulation E by small business investment companies and business development companies (and amendment thereto)
Chaikin Money Flow (CMF) is an oscillator that fluctuates between -1 and 1. Rarely, if ever, will the indicator reach these extremes. It would take 20 consecutive closes on the high (low) for 20-day Chaikin Money Flow to reach 1 (-1). Typically, this oscillator fluctuates between -.50 and .50 with zero as the center-line.
$OPEI BarChart Technical Analysis
http://www.barchart.com/technicals/stocks/OPEI
SPDRs
Usually referred to as spiders, these investment instruments bundle the benchmark S
Exponential moving averages highlight recent changes in a stock's price. By comparing EMAs of different lengths, the MACD line gauges changes in the trend of a stock. By then comparing differences in the change of that line to an average, an analyst can identify subtle shifts in the strength and direction of a stock's trend.
$HUIY BarChart Technical Analysis
http://www.barchart.com/technicals/stocks/HUIY
Form N-23C-2 ~ SEC Filings Explained
Notice by closed-end investment companies of intention to call or redeem their own securities
The Sharpe Ratio is used to measure risk-adjusted return. It is simply total return less the risk-free return divided by the standard deviation. As noted above, the standard deviation is considered inferior because it accounts for both upside and downside volatility. Long only investors are not concerned with upside volatility. It is the downside volatility that produces drawdowns and stomach ulcers.
|
Followers
|
3289
|
Posters
|
|
|
Posts (Today)
|
0
|
Posts (Total)
|
2804248
|
|
Created
|
08/22/10
|
Type
|
Free
|
| Moderator Nilbud | |||
| Assistants mick ManicTrader PhotoChick Kirimi $Pistol Pete$ | |||
   Investor Hub Alerts: Sign up for 'STOCKGOODIES PLAYS OF THE WEEK ' E-Mail List Investor Hub Alerts: Sign up for 'STOCKGOODIES PLAYS OF THE WEEK ' E-Mail ListUPDATE; 5-1-22 courtesy of charting /\ wit tweezer top calls /\ Tony @Montana_Trades Really good study sheet on Candlestick Patterns [-chart]pbs.twimg.com/media/FRn8188XMAAdZvk?format=jpg&name=small[/chart] 

02-07-2021
|
|
Posts Today
|
0
|
|
Posts (Total)
|
2804248
|
|
Posters
|
|
|
Moderator
|
|
|
Assistants
|
| Volume | |
| Day Range: | |
| Bid Price | |
| Ask Price | |
| Last Trade Time: |


