Register for free to join our community of investors and share your ideas. You will also get access to streaming quotes, interactive charts, trades, portfolio, live options flow and more tools.
Eik, are you still around? If so I have a Black Sea/ Turkey Oil/Gas Play for you to check out.
Let me know and I will PM you the details.
Vic
Still buying physical gold and silver. All Fiat currency's eventually go hyperbolic. Gov't just can't help themselves from being Santa Claus.
Thank you Eik. Much appreciated.
Vic
Hi, I don't have private messaging... Here is another one (37C over spot):
http://www.ebay.com/itm/100-oz-Royal-Canadian-Mint-RCM-Silver-Bar-9999-Fine-/201369753414?hash=item2ee2929746
UPDATE: I have started to deploy funds into the physical purchase of gold and silver. My two favorite places to do so pricewise are Gainesvillecoins dot com and Apmex dot com.
I have been buying mostly silver rounds of walking liberty and buffalo designs and a lesser portion of junk silver.
Vic
AmateurInvestors: Weekend Analysis * Saturday, February 11, 2012 - TY Chichi2
http://www.amateur-investor.net/AII_Weekend_AnalysisFeb_11_12.htm
George.
Click on "In reply to", for Authors past commentaries.
Visualizing Spending and Revenue By Tom McClellan
* Friday, February 10, 2012

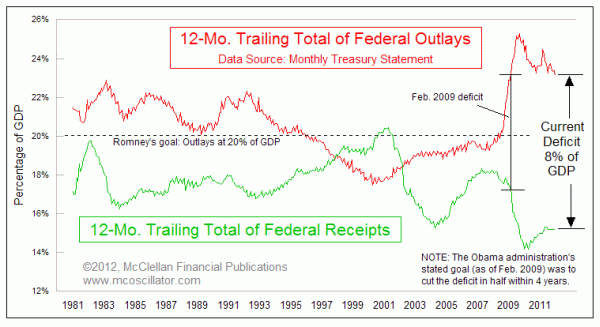
Looking at federal spending and tax receipts as a percentage of GDP has become a hot new activity lately. It's something that I have spent a lot of time on for the past several years, and shared with our readers. A fresh look is appropriate now that it is getting wider attention.
Presidential candidate Mitt Romney has been getting a lot of attention for his call to cut federal outlays to just 20% of GDP, and to also balance the budget. Washington Post columnist Ezra Klein characterized this as "severely conservative budget promises". But the real problem is that neither man understands enough about the math involved, although Gov. Romney deserves credit for at least thinking about moving the numbers in the right direction.
This week's chart takes another look at a chart I showed back in February 2011, comparing total federal receipts to total outlays, each expressed as a percentage of GDP. The good news is that the total outlays over the past 12 months have fallen to their lowest level since February 2009. The bad news is that this is still 7.96 percentage points above where total receipts are.
It is tempting to say that total receipts just need to get jacked up to meet expenditures, and then the problem would be solved. One problem with this logic is that the U.S. has never in its history been able to get tax receipts up above 20.4% of GDP, which was the peak seen in February 2001. So trying to achieve a level of taxation high enough to meet current expenditures would involve going where no economic era has gone before.
The other problem with this logic is that taking tax receipts up too high hurts the economy, and thus hurts the very engine of generating tax receipts that everyone is counting on. Congress seems to almostget this, which is why there has been wide support for keeping the payroll tax cut in place for a while longer, even though it continues to increase the size of the total debt.
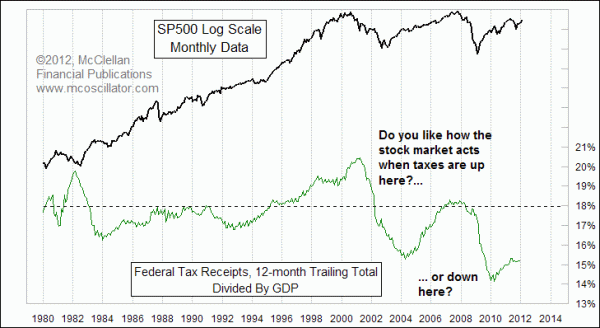
Historically, anytime that total federal receipts has gone up above 18%, it has hurt the stock market and thus the overall economy, including the last time that it happened back in 2007. One rebuttal to that point holds that the U.S. was able to tolerate taxation up as high as 20% in the late 1990s, with no adverse effects on the economy. But that rebuttal misses several important points.
The stock market continued upward during the late 1990s in spite of that high tax collection rate, moving upward all the way until 2000, assuming you believe the behavior of the major averages. In reality, the pain was already being felt long before then. The NYSE A-D Line peaked in early 1998, and did not reach bottom until 2001 when the first of the tax cuts went into effect. And the total number of stocks listed on the Nasdaq peaked at 6136 all the way back in December 1996. It is now down to less than half that amount. The dismantling of the tech bubble started at that December 1996 peak in listed issues, and it continued all the way into the peak of the Nasdaq Composite in March 2000. Destruction of capital due to those high tax rates was already at work long before it became evident in the major averages.
Aside from that exceptional episode, recessions have historically begun once federal receipts get up to above 18%. So any plan to have federal expenditures set at 20% is 2 percentage points higher than the level of tax receipts which is proven to push the country into a recession. It is not a workable plan for balancing the budget, let alone starting to pay back the $15 trillion debt we have amassed and will be leaving to our grandchildren.
A more realistic plan would be to set federal expenditures at 16% of GDP or less, and using any surplus to pay down the debt, thereby shrinking government's share of GDP and increasing the private economy's share of GDP. That has been proven historically as a way of stimulating economic growth by taking workers whose efforts would have been attributed to the government sector, and putting them to work in the portion that supports the government sector.
Hopefully those in power (or hoping to be) will one day wake up to the realities of the math.
http://www.mcoscillator.com/learning_center/weekly_chart/visualizing_spending_and_revenue/
George.
Click on "In reply to", for Authors past commentaries.
AmateurInvestors: Weekend Analysis * Saturday, February 4, 2012 - TY Chichi2
The Dow was up 3.4% in January. Historically when January has finished with a positive return this has led to the Dow having a positive return for the year as well.
http://www.amateur-investor.net/AII_Weekend_AnalysisFeb_4_12.htm
George.
Click on "In reply to", for Authors past commentaries.
Eurodollar COT Indication Calls For Big Stock Market Top Now By Tom McClellan
* Friday, February 3, 2012

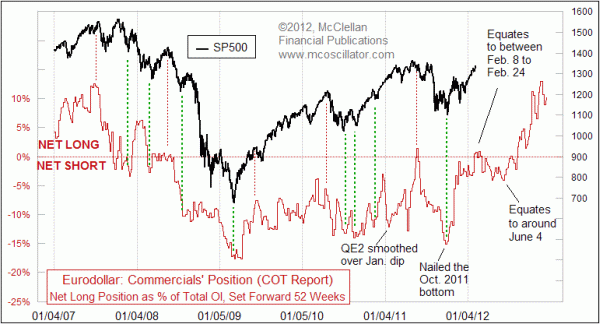
Back in May 2011, I introduced Chart In Focus readers to the leading indication that I get from looking at Commitment of Traders (COT) data on eurodollar futures. Since then (and also before) readers of our twice monthly McClellan Market Report newsletter and Daily Edition have appreciated getting to see this relationship on a more frequent basis.
For almost a year, we have known that a top was due to arrive in February 2012. And sure enough, stock prices have been rising nicely in recent weeks as fulfillment of that expectation.
Now this leading indication says that things are going to get less fun for investors for a while. The next 3 months show a sideways to downward structure in the eurodollar COT data, and the implication is that the steep price advance that we have been seeing should transition to a more sideways market. That's great if one can be a swing trader, buying oversold opportunities and selling when prices get overbought, and then repeating. But it is a lousy time to be a buy and hold investor. How to play that chop is something that we will be sharing with our subscribers.
The next major inflection point is due in early June, when this leading indication says that a big multi-month rally is due to begin. By then, all of the bullishness that investors are expressing now in the various sentiment indications should have turned to frustration and pessimism, creating the right setup for a big new uptrend. The hard task will be to remain patient until then, waiting for conditions to be right again.
http://www.mcoscillator.com/learning_center/weekly_chart/eurodollar_cot_indication_calls_for_big_stock_market_top_now/
George.
Click on "In reply to", for Authors past commentaries.
The AAII Investor Sentiment
* Sentiment Survey Results Week ending 2/1/2012
 Bullish 43.8%
 Neutral 31.1%
 Bearish 25.1%
Change from last week:
Bullish: -4.6
Neutral: -1.6
Bearish: +6.2
Long-Term Average:
Bullish: 39%
Neutral: 31%
Bearish: 30%
http://www.aaii.com/sentimentsurvey/
George.
Click on "In reply to", to see past results.
AmateurInvestors: Weekend Analysis * Saturday, January 28, 2012 - TY Chichi2
The Commitment of Traders data shows there is a battle going on in the Futures Market between the Large Speculators (Hedge Funds, Banks) and the Commercial Traders...
Although the Large Speculators are currently on the wrong side of the trade it's certainly possible in the longer term they will end up being correct.
http://www.amateur-investor.net/AII_Weekend_AnalysisJan_28_12.htm
George.
Click on "In reply to", for Authors past commentaries.
Traders Like QQQ A Little Too Much By Tom McClellan
* Friday, January 27, 2012

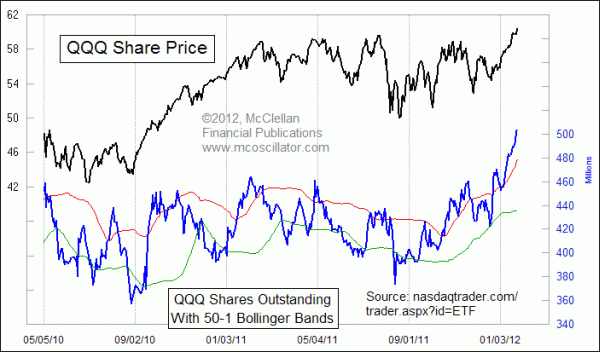
Some sentiment indicators work by analyzing what people say, such as polls and sentiment surveys. Others work by analyzing what people actually do, and I tend to like those more.
This week's chart looks at investments into QQQ, the ETF designed to track the movements of the Nasdaq 100 Index. The lower line in that chart is the total number of shares outstanding of the QQQ. It fluctuates each day as fewer or more people feel like owning shares. Because of that waxing and waning of interest, the sponsoring firm (Power-Shares) issues or redeems shares to keep the share price close to the NAV.
When the firm issues new shares, it goes out and buys the shares of the NDX component issues to back those ETF shares. Not surprisingly, interest in owning these shares rises and falls along with the overall stock market. When the overall market goes up, that makes more people want to participate.
To help track where “high” and “low” levels are, I added 50-day 1-sigma Bollinger Bands to the chart. That means that the upper and lower bands are drawn one standard deviation above and below the 50-day simple moving average, which is not shown. Other settings for drawing Bollinger Bands could also be used for the same purpose; I just like these because they look about right, and give good insights about an overzealous or disinterested investing public when the shares outstanding number goes outside these bands.
The current number of shares outstanding is not at an all time high, but it is the highest we have seen since all the way back in 2006. And it is way above the upper 50-1 Bollinger Band, indicating that traders and investors are getting a little bit too interested in being invested in the QQQ. That overly bullish sentiment condition begs for at least a short term pullback, to reintroduce people to the idea that stock prices actually CAN go down.
The QQQ and the Nasdaq 100 Index are just now breaking out slightly above their 2011 highs, but interest in owning the QQQ is well ahead of its corresponding highs in 2011. That means that traders have been drawn in to owning this ETF to a degree even greater than what the raw price advance itself would suggest should have happened.
http://www.mcoscillator.com/learning_center/weekly_chart/traders_like_qqq_a_little_too_much/
George.
Click on "In reply to", for Authors past commentaries.
Everybody’s Unhappy!? By Jeffrey Saut
* Monday, January 23, 2012

The call for this week: Last Thanksgiving I suggested the Santa rally was beginning. I stuck with that “call” into the new year. On January 3, 2012 I stated that session felt like an “emotional peak” and that January 10, 2012 felt like the “price peak.” Subsequently I wrote, “The only question in my mind is if the markets are going to have a pullback into the 1230 – 1240 support zone, or go sideways to correct their overbought condition and allow the internal energy to be rebuilt.” So far, it has been a sideways consolidation until last week’s upside breakout causing one old Wall Street wag to exclaim, “Breakout or fake-out?!” On a short-term basis I think it is a fake-out believing a trading top is due this week ...
http://www.raymondjames.com/inv_strat.htm
George.
Click on "In reply to", for Authors past commentaries.
AmateurInvestors: Weekend Analysis * Saturday, January 21, 2012 - TY Chichi2
http://www.amateur-investor.net/AII_Weekend_AnalysisJan_21_12.htm
George.
Click on "In reply to", for Authors past commentaries.
Money Inflow Update for January 17th. .... By Stocktiming.com
* Tuesday, January 17, 2012
http://www.stocktiming.com/Tuesday-DailyMarketUpdate.htm
George.
Click on "In reply to", for Authors past commentaries.
“The Turtle?” By Jeffrey Saut
* Tuesday, January 17, 2012

The call for today: The turtle makes no progress until it sticks its neck out; I have been sticking my neck out since Thanksgiving, believing the Santa rally was beginning. I stuck with that strategy until the first day of trading this year, which felt like a short-term emotional trading peak. A short-term price peak occurred on 1/10/12 at 1296.46 basis the SPX, as chronicled in these missives. The only question in my mind was whether we were going to get a pullback into the 1230 – 1240 support zone, or if we would experience a sideways correction as the overbought condition was worked off and the market’s internal energy was rebuilt. So far it’s been a sideways correction, leaving the NYSE McClellan Oscillator not overbought, but not oversold either. In fact, it is hovering around the neutral line. Meanwhile, the stock market’s internal energy is almost fully recharged. And this morning we are greeted with better than expected Chinese GDP growth (+8.9% vs. +8.7%E), a worldwide interest rate easing cycle, the largest jump in German investor confidence ever, a decent Spanish bond auction, and hints of another round of quantitative easing. The result has the pre-opening S&P 500 futures up double digits, precious metals sharply higher, crude oil back above $100/bbl., and a lower U.S. dollar. Accordingly, while I would have liked to see more of a pullback to a minimum of 1250 – 1260, I’ll say it again – I think it is a mistake to become too bearish ...
http://www.raymondjames.com/inv_strat.htm
George.
AmateurInvestors: Weekend Analysis * Saturday, January 07, 2012 - TY Chichi2
http://www.amateur-investor.net/AII_Weekend_AnalysisJan_7_12.htm
George.
Click on "In reply to", for Authors past commentaries.
S&P 500 Is Barely Bearish By Carl Swenlin
* Friday, December 30, 2011

As 2011 comes to a close the S&P 500 Index is, by our measure, still in a long-term bear market, but technical indications show that price momentum us up.
On the weekly bar chart we use crossovers of the 17-EMA and 43-EMA to mark official bull and bear market status. In August there was a downside EMA crossover that closed out the bull market that officially began with an upside EMA crossover in August 2009. This is a fairly reliable, albeit slow moving, timing model, and, while it is not normally subject to being whipsawed, there are certainly indications that it may be switching back to bullish very soon.
Currently, price is trying to break above the top of a triangle formation, and that would be positive if it could do so decisively. Also note in the thumbnail chart that price is above the EMAs, so they are converging, and an upside crossover will take place in a week or two as long as price remains above the EMAs. Finally, the PMO (Price Momentum Oscillator) is rising above its EMA, indicating positive internals.
Bottom Line: We like to emphasize that technical analysis is a windsock, which means it tells us the current wind direction, not which way the wind will be blowing in five minutes. Our model says we are still in a bear market, but that will change soon if prices maintain positive momentum. However, this positive view could change quickly with the next negative story about the EU debt crisis -- probably due on news stands sometime next week. Dealing with the stock market these days is like flying in the vicinity of thunder storms. Wind direction can change radically and without warning, and cautious pilots usually try to avoid these conditions.
* * * * * * * * * * * * * * * * * * * * *
HAPPY NEW YEAR!
Erin and I would like to send our best wishes for a great 2012.
-Carl
* * * * * * * * * * * * * * * * * * * * *
Technical analysis is a windsock, not a crystal ball.
* * * * * * * * * * * * * * * * * * * * *
http://blogs.decisionpoint.com/chart_spotlight/2011/12/sp-500-is-barely-bearish.html
George.
Click on "In reply to", for Authors past commentaries.
AmateurInvestors: Weekend Analysis Saturday, December 17, 2011 - TY Chichi2
http://www.amateur-investor.net/AII_Weekend_AnalysisDec_17_11.htm
George.
Click on "In reply to", for Authors past commentaries.
AmateurInvestors: Weekend Analysis Saturday, December 10, 2011 - TY Chichi2
The Mutual Fund Panic Index came close to triggering another Long Term Buy Signal based on the latest data from the Federal Reserve that was reported on December 8th. Long Term Buy Signals have triggered when the red bars have dropped to -20 or below (points A). Since the early 1950's only 6 Long term Buy Signals have occurred with the last one in March of 2009 which was followed by 105% rally in the S&P 500. Furthermore every time a Buy Signal has been triggered the S&P 500 has rallied 70% or more from the low.
http://www.amateur-investor.net/AII_Weekend_AnalysisDec_10_11.htm
George.
Click on "In reply to", for Authors past commentaries.
A very bullish development By Mark Hulbert
Commentary: What Disney’s dividend hike means for the economy
* Thursday, December 1, 2011
CHAPEL HILL, N.C. (MarketWatch) — The most bullish thing the market can do, according to the age-old saying, is to go up.
And according to that standard, at least, Wednesday’s market action was very bullish indeed — with the major market averages rising by more than 4%.
But there was another very bullish development on Wednesday that was largely overlooked in all the attention being paid to the overall market: Disney hiked its annual dividend from 40 cents to 60 cents a share.
Now, I admit that this news does not, at first blush, seem even remotely as momentous as a 490-point rise in the Dow Jones Industrial Average . But I nevertheless think it is, because of what it signals about Disney’s future — and, by extension, the economy as a whole.
Notice, for starters, that Disney’s dividend hike amounts to a 50% increase. That’s a far bigger percentage than is typical for a company as large as Disney. And it comes on top of a 14% increase in its dividend a year ago.
Secondly, companies will go to great lengths to avoid ever cutting their dividends. So if Disney’s management harbored any significant doubts about the company’s ability to maintain its impressive recent profitability into the future, it’s a good bet that they would not have increased their dividend.
Putting these two factors together, Disney’s dividend increase can be seen as a strong vote of confidence by management in the company’s future.
There’s a third factor worth noting as well: Disney is in the entertainment business. Its profitability would suffer if the economy were about to go into a sustained downturn in which the typical consumer had to cut way back on discretionary expenses. So, to that extent, management’s vote of confidence extends to the economy as a whole.
Am I reading too much into the vote of confidence that Disney’s management is apparently making?
For insight, I turned to Roni Michaely, a finance professor at Cornell University’s Johnson Graduate School of Management. Michaely is one of academia’s leading experts on what corporate management is signalling through dividend increases.
In an interview Wednesday afternoon, Michaely told me that, based on his extensive research into past dividend increases, Disney’s recent dividend hike can be seen as increasing the odds that the company will be able to maintain the heightened level of profitability that it has earned in recent years. Because of that dividend increase, he said, the “likelihood that Disney’s earnings will decrease in coming years is lower than before.”
This doesn’t amount to a guarantee, of course. Michaely hastened to point out that his comments are based on an average of thousands of companies he has analyzed over the years, and that there are plenty of counterexamples of companies that increased dividends only to subsequently fall on hard times.
So it’s a matter of playing the odds, as it always is in this business. But Disney’s dividend hike does increase the probabilities that it will be able to at least maintain its recent heightened profitability. And that has to be a long-term positive for the economy as a whole.
http://www.marketwatch.com/story/a-very-bullish-development-2011-12-01?link=home_carousel
George.
Click on "In reply to", for Authors past commentaries.
Confluence of Positive Technical Factors Heading Into December By MPtrader
* Tuesday, November 29, 2011

Our cycle work in the S&P 500 indicates that we are near the timeframe for the establishment of a small cycle low due on November 30 (+/- 2 days). A small cycle is 20-25 days, and lies within the larger, overriding cycle of 70-75 days. Accordingly, we find that the S&P 500 on Monday and last Friday hit a corrective low at 1158.67/66, and since then has pivoted to the upside into Tuesday's high at 1203.67 (so far).
In addition, my near-term pattern work indicates that the rally exhibits bullish form, which warns me to expect additional strength after any sort of digestion or pullback period. The bullish form of the rally coupled with the timeframe for a small cycle low that pivoted to the upside right at the 62% retracement support plateau of the October 4-27 advance -- in addition to the oversold condition and potentially powerful seasonal factors during December -- would appear to be a prescription for the initiation of a period of rising equity index prices.
As long as last Friday's low at 1158.66 contains any forthcoming weakness, a confluence of potentially very positive technical factors appear to be in place and very supportive heading in December.

http://www.mptrader.com/middayminute/
George.
Click on "In reply to", for Authors past commentaries.
Rainbow Convergence Has Predictive Value By Tom McClellan
* Friday, November 25, 2011

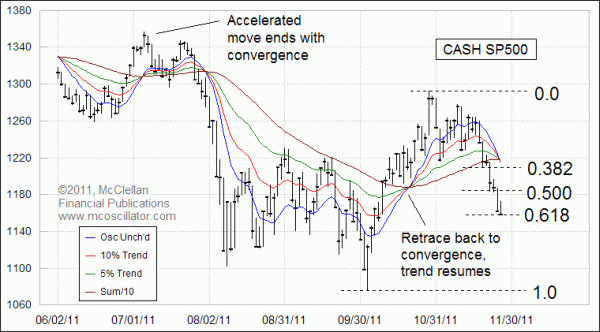
In the spot SP500 Index chart right now, there are a lot of things going on simultaneously. On the way down from the Oct. 27 top, the SP500 stopped briefly at the 0.382 retracement level, and paused there for an extra day. Then it dropped through and made its next stop at the 0.500 retracement level, again pausing there for a day.
The big drop on the day before Thanksgiving made it almost to the 0.618. That precise level is at 1158.00, and the intraday low on Nov. 25 was 1158.66 . So is Black Friday's small range just another manifestation of the "pause for a day" Fibonacci effect?
Probably not. Also going on right now is that we are seeing a completion of the "rainbow convergence" shown in this chart. That name comes from all of the pretty colors of the moving average type lines. A rainbow convergence is a similar event to Dave Landry's "bowtie crossover", and other moving average crossover events that others have written about.
This week's chart uses our own preferred mix of moving average type lines, and this style of chart is featured frequently in our Daily Edition. You can read about the definitions and calculations of each of those four lines here, but the focus today is on making an interpretation of their meaning rather than in getting bogged down discussing the math.
In our understanding of rainbow convergences, the meaning of a particular convergence event depends on how prices are behaving when the convergence takes place. When prices make a short term accelerated move which brings the four lines together, then the moment of the convergence usually marks the end of that move. What follows next is a pause for a few days, as prices decide whether to resume the move or reverse it for good. Usually that decision process involves a test of the Price Oscillator Unchanged line, which represents the level at which a close would turn our Price Oscillator precisely sideways.
A good example of this is the July 2011 top. A sharp up move ended when the four lines converged. In the days that followed that top, the SP500 was not able to successfully find support at the Price Oscillator Unchanged line, and the market eventually broke down in a big way.
If, on the other hand, prices retrace back toward the price-time point of an impending convergence before it is done, then what usually follows is a resumption of the preceding trend. We saw an example of that type of behavior in mid-October, when the new uptrend interrupted itself briefly to dip back toward the convergence, and then the uptrend resumed.
So now here in November 2011, we are seeing the Thanksgiving week selloff take the SP500 down to its 0.618 retracement level, and simultaneously completing a rainbow convergence with this accelerated short term move. Because we have seen no retracement back toward this convergence, that means that we should expect to see at least a pause in the down move, while prices decide what to do next. In the days ahead, if we see prices rally up to the Price Oscillator Unchanged line and fail to move above it, then we can expect more downward movement. But if the SP500 can instead get up above that line, and turn the Price Oscillator up in the process, then we'll know that this rainbow convergence will have marked a bottom for the down move, and the strength we saw in October can have a chance to reassert itself.
http://www.mcoscillator.com/learning_center/weekly_chart/rainbow_convergence_has_predictive_value/
George.
Click on "In reply to", for Authors past commentaries.
AmateurInvestors: Weekend Analysis Saturday, November 19, 2011 - TY Chichi2
As I have mentioned before the Dow has never had a negative year in the 3rd Year of a President's Term dating back to World War II. The Dow closed at 11577.51 in 2010 so the Institutional Money will have to keep the Dow above this level through the end of the year to keep the streak intact.
http://www.amateur-investor.net/AII_Weekend_AnalysisNov_19_11.htm
George.
Click on "In reply to", for Authors past commentaries.
AmateurInvestors: Weekend Analysis Saturday, November 12, 2011 - TY Chichi2
Now the question is could we see a similar 5 Wave structure develop with an eventual retest of the previous March 2009 low or will a repeat of the mid to late 1940's occur where the Dow moved nearly sideways exhibiting a very choppy consolidation period?
http://www.amateur-investor.net/AII_Weekend_AnalysisNov_12_11.htm
George.
Click on "In reply to", for Authors past commentaries.
AmateurInvestors: Weekend Analysis Saturday, November 05, 2011 - TY Chichi2
The 5 Day Average of the Put to Call Ratio rose this week back above the 1.1 level (black line) so their still is quite a bit of bearishness among investors...
http://www.amateur-investor.net/AII_Weekend_AnalysisNov_5_11.htm
George.
Click on "In reply to", for Authors past commentaries.
Fragile Equilibrium?
* Tuesday, November 1, 2011

Last week’s income, consumption and inflation data suggest that the U.S. economy continues to muddle through, but the most interesting stories may be found beneath the headlines.
The rush of high-impact economic data likely did nothing to change consensus views of the U.S. economy. As last week’s consumption data reiterated, American households continue to eke out decent income advances and spend at a rate that is supportive of real GDP growth somewhere above 2%. But as our Bank Credit Analyst pointed out in its November edition, households have become increasingly reliant on government transfers to maintain trend-level spending even while they boost savings to repair their balance sheets. Beneath the more celebrated recent data, the slump in the employment cost index (ECI) may provide some insight into the profit margin sustainability. The momentum that appeared to be building in the ECI over the first half of this year was choked off in the third quarter, suggesting that profit margins may yet have some life in them. If inflation pressures abate as we expect they will, margins could even expand from their already robust levels. The trouble is that there’s a limit to how long corporations can keep thriving as pressure on consumers continues to accumulate, especially if the federal government attempts to withdraw some of its support of households. Bottom line: Just a few months after the debt ceiling debate fiasco, a fractious Congress may be preparing to return to center stage. Investors should keep track of which way the wind is blowing inside the Capitol.
http://www.bcaresearch.com/public/story.asp?pre=PRE-20111101.GIF
George.
Click on "In reply to", for Authors past commentaries.
Negative Real Yields, Too Much of a Good Thing By Tom McClellan
* Thursday, October 27, 2011


I hear more and more analysts talking about how negative real interest rates are a bullish factor for gold. That is a true statement, and it is something I addressed here back in January 2010. The circles in the chart highlight instances of negative real T-Bill yields, and they are generally associated with rising gold prices. I do get worried, though, when everybody starts to recognize a bullish factor for anything.
We are seeing negative real interest rates right now because of a conscious choice that the FOMC is making. Congress gave the Fed a dual mandate--maximum employment and stable prices. Since 2008, the Fed has been ignoring the mandate for stable prices in favor of keeping short term interest rates effectively at zero, in hopes that it will help to stimulate economic activity and therefore restore jobs growth.
Jobs have not yet come back as fast as everybody would like, but consumer prices have been rising. The CPI-U is up 3.9% from a year ago, and PPI is up 6.9%. Having higher inflation while interest rates remain low means that the negative real interest rate on T-Bills goes to an even more negative level. And while that is a bullish factor for gold prices, it may be too much of a good thing.
What I would like you to notice in this week's chart is that when the real yield gets down below -3%, that tends to mark a terminal point for an uptrend in gold prices. I don't mean exactly today or tomorrow, but in the really long term a condition like this tends to mark important tops for gold prices. The reason it works this way is that at some point this sort of condition gets so big that somebody decides to do something about it.

Back in 1981, that somebody was Fed Chairman Paul Volcker, who finally took short term rates up above the inflation rate and thereby helped to snuff out the runaway inflation we were seeing back then. Those higher rates made it more expensive to speculate in gold, because investors would miss out on the chance to earn big yields by investing elsewhere. So money came back out of the gold market to chase those higher yields, and the price of gold fell.
In 2008, the real yield on T-Bills got down to -4.0%, as a reflection of the wealth destruction that was going on everywhere that year. Gold prices finally fell in sympathy because investors turned to their gold holdings as a "source of funds" to cover other losses.
Now we are once again seeing real yields well below that -3% threshold, and while it is still a bullish factor for gold prices, it also may be the sign that the good times for the gold bulls may be nearing an end. At some point, the FOMC is going to remember that it has a DUAL mandate, and that the stable prices part of that mandate has been ignored for too long.
Exceeding the -3% threshold does not mean that the Fed has to wake up and start doing its job right at this moment. It just says that they are increasingly likely to do so. Gold investors should take heed, and understand the negative implications (for gold prices) of the Fed actually deciding to do its job, whenever that might happen.
Exceeding the -3% threshold also does not specifically mean that the top is in for gold prices. When the top might come in is something that we address for subscribers of our twice monthly McClellan Market Report and our Daily Edition. Why not take a look?
http://www.mcoscillator.com/learning_center/weekly_chart/negative_real_yields_too_much_of_a_good_thing/
George.
Click on "In reply to", for Authors past commentaries.
Fourth Quarter Rally Expected to Continue By Art Huprich
* Friday, October 28, 2011

“Wait, are the bulls supposed to run in Pamplona or Wall Street?” Ever since the “less pressure ridden” undercut low and bullish short-term high volume reversal on 10/4/11, I’d say “both.” While having discussed a fourth quarter rally, both here and in client seminars for weeks, I have been wrong thinking it couldn’t go this far in such a short period of time.
Actually, over the past week or three we’ve seen the underinvested and underperforming participants disguised as bulls, coupled yesterday with a temporary removal of Europe’s issues and recession concerns. This produced a 339-point gain by the DJIA, an 88-point rally by the NASDAQ, a violation of support by the U.S. Dollar Index and a sharp decline by the bond market as the “risk off” trade was unwound. Also, Silver defined by the Silver Trust (SLV/$34.10) followed through from a recent short-term, topside breakout. I think SLV can make a move towards $38 to $40.
On the NYSE, volume expanded to 1.43 billion shares, the highest since the “10/4/11 high volume reversal.” I don’t view this as favorably as others because it signifies, to me at least, a gradual acceptance of the recent rally. There were 2323 net advancing issues and 174 new 52-week highs. I like the new high reading as it tells me more stocks will start to develop high level bases.
So what type of logical conclusion(s) can I make from the following chart:
1) Some type of pullback or consolidation is due, given the DJIAs move into resistance as shown below.
2) Short-term oriented accounts, or those who “bought” in the beginning of the month, should take some trading profits and raise their stop loss points, simply as a function of discipline.
3) Buy fundamentally attractive companies with bullish chart configurations that aren’t extended in price, because I think the DJIA will eventually push into the higher resistance levels, shown below.

http://raymondjames.com/technical_commentary.asp
George.
Recapitalizing European Banks
* Tuesday, October 18, 2011

The tangible common equity to total assets measure of bank solvency suggests that French and German banking sectors are most in need of capital.
To measure the solvency of a bank in times of stress, it is vital to only count the simplest form of capital that can absorb losses – tangible common equity. In other words, goodwill and complex forms of capital should be excluded from the numerator of any capital adequacy ratio. Also, when Europe is experiencing a sovereign debt crisis it is ludicrous to treat government bonds held by a bank as zero-risk assets (as the Core Tier 1 Capital ratio does). In other words, government bonds should be included at full weight in the denominator of the solvency ratio. On this basis, it is easy to identify which individual banks and national banking sectors need the most capital. In addition to Dexia, which has a tangible common equity to total assets ratio of 1%, French and German banks stand out as the ones most in need of capital injections. Other euro area banking sectors are better capitalized, but have more exposure to their own distressed bond markets. Importantly, irrespective of how banks raise common equity, whether from the private sector, their governments or from the EFSF bailout fund, it is dilutive to existing shareholders and a drag on their share prices. Meanwhile, U.K. banks do not have such a domestic bond problem and are relatively well capitalized. What is more, they started raising capital over two years ago. Therefore, our European Investment Strategy continues to overweight U.K. bank stocks relative to their euro area peers.
http://www.bcaresearch.com/public/story.asp?pre=PRE-20111018.GIF
George.
Click on "In reply to", for Authors past commentaries.
AmateurInvestors: Weekend Analysis Saturday, October 15, 2011 TY Chichi2
http://www.amateur-investor.net/AII_Weekend_AnalysisOct_15_11.htm
There wasn't any Wednesday/Thursday update this week again.
George.
Click on "In reply to", for Authors past commentaries.
Eyeing Emini S&P Support By MPtrader
* Friday, October 07, 2011

The decline in the emini S&P 500 off this morning's high at 1173.75 violated very important near-term support at 1151-1150. This has triggered an initial downside follow-through to 1144.75, likely on the way to test more important support at 1135-1130 next.
If that support zone is violated and sustained, then we should expect downside continuation that revisits the 1090-1070 area, which will represent a retest of last Tuesday's lows.
On the other hand, if it turns out that today's weakness in the index so far is part of a topping process and the e-SPZ manages to claw its way back above 1150-1153, then we should expect additional strength into the 1162-11165 area prior to a more pronounced "rollover."

http://www.mptrader.com/middayminute/
George.
Click on "In reply to", for Authors past commentaries.
Sentiment Poll
* Monday, October 3, 2011 ![]()
http://tickersense.typepad.com/ticker_sense/2011/10/october-3rd-blogger-sentiment-poll.html
George.
Click on "In reply to", to see charts from prior week.
AmateurInvestors: Weekend Analysis Saturday, October 1, 2011 TY Chichi2
http://www.amateur-investor.net/AII_Weekend_AnalysisOct_1_11.htm
George.
Click on "In reply to", for Authors past commentaries.
First Day of the Month Effect By Tom McClellan
* Friday, September 30, 2011

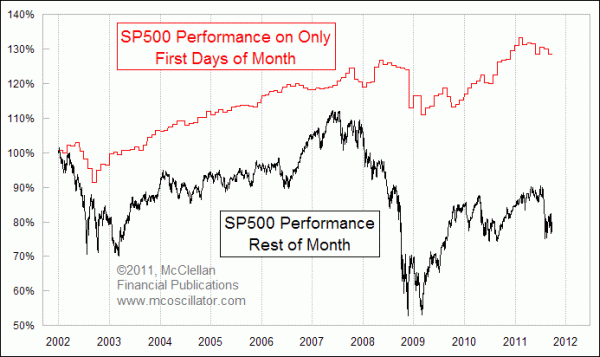
As the stock market closes out the ugly month of September, a lot of people are looking ahead to the bullish tendency for the first day of the month.
First days have a bullish bias, and since 2003 the SP500 has closed higher 65.7% of the time on the first day of the month, versus only 54.8% when we look at all days. This week's chart reveals that if a person had been invested only on the first day of the month, he would have beaten buy and hold. The two plots are hypothetical equity curves based solely on the SP500 Index, and discounting dividends, interest, transaction costs, and other factors which would matter for real investing. The point in doing this is not to calculate real performance, but rather to demonstrate the phenomenon.
There are even some hedge funds who have built their trading strategies around just this sort of month-based "seasonality". But before you go and start trading based solely on this one factor, there is a really big caveat to understand. The bullish bias on first days of the month really only works when the stock market is in an uptrend. From August 2008 through March 2009, first days went through a string of 7 down closes out of those 8 months, including a whopper of a 8.9% drop on Dec. 1, 2008. So this is far from being a surefire strategy.
Interestingly, this bullish bias on first days is a relatively recent phenomenon in market history. From 1976-1992, the 53.6% of up closes on first days was statistically indistinguishable from the 52.2% of up closes on all days. Then starting in the 1990s, as automatic investments became more of a widely used practice, first days started seeing higher closes much more often, as those fund flows helped to push up prices more.
2011 has not been such a good year for this phenomenon. With 9 months gone by, only 4 of them have seen a higher close for the SP500 on the first day of the month. This is part of that same story of how first days have a bullish bias only during uptrends.
At the point when the market finally starts trending higher again overall, then we can start expecting first days to show that historic bullish bias once again. But it is not an expectation we can apply during corrective periods for the stock market.
http://www.mcoscillator.com/learning_center/weekly_chart/first_day_of_the_month_effect/
George.
Click on "In reply to", for Authors past commentaries.
Gold Mining Stocks Versus Gold By Carl Swenlin
* Friday, September 30, 2011

QUESTION: Carl, I have read a lot of articles recently indicating gold miner stocks should go up and outpace gold. So far nothing but a drop in goldminers. Would it be possible for you to show charts of GDX and GDXJ with your comments on one of your daily posts? Thank you for a great website.
ANSWER: Back in the day before precious metals ETFs, gold mining stocks were considered a convenient surrogate for exposure to precious metals. The XAU (Gold & Silver Mining Index) is composed of large-cap members of this group. First let's compare a long-term chart of the XAU with one of gold. Note that the XAU and gold ran pretty close together from 1984 until about 2000. Then from the lows of 2000 gold rallied about +1400% versus only +125% for the XAU. (The Price Relative line has been trending down since 1996.) An interesting point is that both indexes had major corrections in 2008 -- about -70% for the XAU and -25% for gold.
I think we can say that in the past there has been a passing similarity in price movement between the two indexes, but it has been a similarity in direction, not magnitude. Why the difference in performance? Well gold is a commodity, and gold stocks are, well, stocks in companies that mine gold. As stocks they carry all the baggage of the companies they represent, and they tend to be affected by the movement of the broad stock market as well.
As an aside, let me say that I have a strong dislike for gold mining stocks as trading/investing vehicles. They tend to trade in broad, volatile trading ranges, and they defy my attempts at trend following. This can be seen on the charts of the two ETFs you requested.
As for specific issues, GDX recently had a failed breakout attempt, a bull trap, and is about to challenge the bottom of the one-year trading range. GDXJ has executed a classic head and shouders pattern and has a minimum downside target of about 22.25.
Bottom Line: The price of gold is already 'baked into the cake' of gold mining stock prices. There could be some future management initiatives that may take better advantage of higher gold prices as regards the bottom line, but I wouldn't count on a major rise in gold stocks driven by a move to correct the lag in gold stocks versus the price of gold.
There are plenty of opinions available on stocks, sectors and markets. Take them all with a grain of salt, then look at the chart!
* * * * * * * * * * * * * * * * * * * * *
Technical analysis is a windsock, not a crystal ball.
* * * * * * * * * * * * * * * * * * * * *
http://blogs.decisionpoint.com/chart_spotlight/2011/09/gold-mining-stocks-versus-gold.html
George.
Click on "In reply to", for Authors past commentaries.
AmateurInvestors: Outlook for Thursday, September 29, 2011 TY Chichi2
If we are seeing the beginning of minor wave iii of a 5 Wave affair to the downside the S&P 500 shouldn't rise back above yesterdays high of 1196.
http://www.amateur-investor.net/AII_Daily_Report_Sep_28_2011.htm
George.
Click on "In reply to", for Authors past commentaries.
U.S. Dollar: Waiting For More Policy Action
* Tuesday, September 27, 2011

The U.S. dollar remains at the mercy of policymakers. A meaningful response is needed to trigger a downside reversal in the greenback.
As “operation twist” will not impact the size of the Fed’s balance sheet, it did not translate into dollar weakness. The lessons from 2010 suggest that it is probably a matter of time before such a policy (i.e. QE3) is deployed. Recall, following the end of QE1 in March 2010, the U.S. economy started to weaken and the equity market began to tumble. The Fed’s initial policy response in early August 2010 (reinvesting maturing debt into new Treasurys) was not enough to placate markets and the dollar strengthened. Just a few weeks later Fed Chairman Bernanke suggested that QE2 was in the works. The 2011 policy roadmap is eerily similar, especially after the latest two Fed meetings left markets underwhelmed. But until QE3 is credibly articulated by Bernanke, there could be more downside for risky assets and further upside for the dollar. Apart from the Fed, efforts by European officials to stem their sovereign debt crisis and an end to Chinese tightening would also go a long way to supporting global growth and stabilizing risky assets. Our Foreign Exchange Strategy closed a number of short dollar/pro-cyclical trades for modest profits as the trailing stop-losses were hit. For now, stick to defensive trades (short USD/JPY and EUR/JPY) as they will benefit if the “risk off” environment persists.
George.
Click on "In reply to", for Authors past commentaries.
Sentiment Poll
* Monday, September 26, 2011 ![]()
http://tickersense.typepad.com/ticker_sense/2011/09/September-26th-blogger-sentiment-poll.html
George.
Click on "In reply to", to see charts from prior week.
AmateurInvestors: Weekend Analysis Saturday, September 24, 2011 TY Chichi2
The Mutual Fund Panic Index has become slightly negative based on the latest Flow of Funds data from the Federal Reserve. This index tracks the amount of money flowing into and out of Mutual Funds. Historically when values outflows have reached -20% or more (green line) significant bottoms have occurred since the early 1950's. The last signaled occurred in March of 2009 which was followed by a 105% rally in the S&P 500.
http://www.amateur-investor.net/AII_Weekend_AnalysisSep_24_11.htm
George.
Click on "In reply to", for Authors past commentaries.
1946 Analog Holds Key For Current Market By Tom McClellan
* Thursday, September 22, 2011

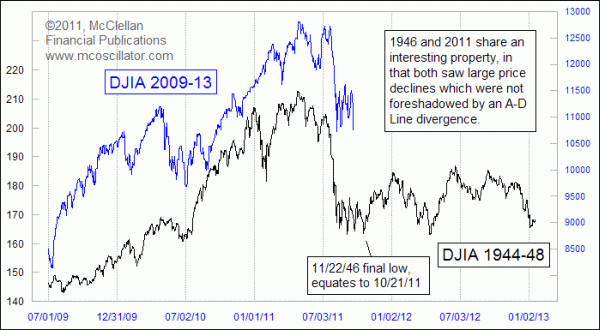
I love price pattern analogs, because I love just about anything that can tell me in advance what is going to happen to stock prices. If the current price behavior is similar to that of another period in history, then sometimes it can give us insights about what lies ahead.
Subscribers to our Daily Edition and our twice monthly McClellan Market Report newsletter have enjoyed getting to see this week's chart on a regular basis. It compares the ugly decline of the summer of 2011 to a very similar decline in the summer of 1946.
We first took a look at this comparison back in August 2011 because of a common factor in each period: there was no divergence in the A-D Line. Most of the time when there is a price decline as big as we have just seen, the A-D Line gives us warning of liquidity problems by making a divergent lower high as prices make a higher high. We did not get that A-D Line signal in the summer of 2011, although other divergences did tell us (and thus our subscribers) that there was trouble brewing.
1946 similarly did not have an A-D Line divergence, and so that made it worth taking a look at as a comparison model. When lining up the price patterns in a single chart, the correlation of price movements then and now became obvious.
1946 also shares other similarities with the current time frame. The U.S. was in the midst of dismantling the stimulative effects of a war-time economy, and unemployment shot up in a big way. There were also concerns about rebuilding post-war Europe, and whether or not loans would be repaid like the Lend-Lease Program. Now we have an economy with high unemployment, and the expiration of stimulative efforts like TARP and QE1 & 2. There was great labor union unrest in 1946, which led to the 1947 passage of restrictions on union activity in the Taft-Hartley Act, which passed over President Truman's veto. 2011 saw a big push back against unions in states like Wisconsin and New Jersey.
Zooming in closer, we can see that even the manner in which each of the steep declines unfolded was very similar. There was a rapid one-day drop, a slight hesitation, and then the final plunge in both cases.
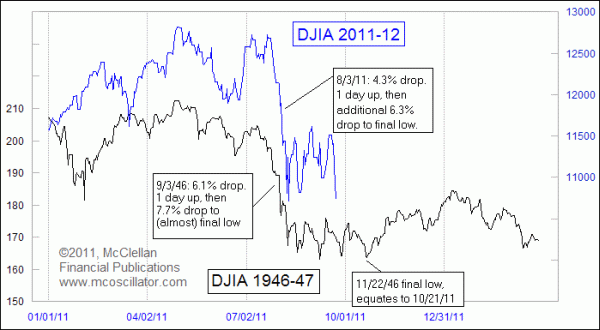
Rather than continuing the decline after the steep plunge, the 1946 market saw a long series of retests, with the DJIA seemingly bouncing along against a price floor for several months. The last of those came on Nov. 22, 1946, and with the price pattern alignment shown in these charts, that equates to a bottom due Oct. 21, 2011.
One point to understand about using price pattern analogs is that eventually the correlation breaks up and stops working. Often that point will arrive at the moment when one is most counting on the correlation to continue working. So one should never give these pattern analogs complete trust, no matter how good they look. But for the moment, the 1946 pattern does seem to be telling us the correct answers about how the current market's corrective period will play out.
http://www.mcoscillator.com/learning_center/weekly_chart/1946_analog_holds_key_for_current_market/
George.
Click on "In reply to", for Authors past commentaries.
AmateurInvestors: Outlook for Thursday, September 22, 2011 TY Chichi2
Today's action would favor the Head and Shoulders pattern I have recently talked about. However we will need to see a break below the Neckline support area which is around the 1150 level in the S&P 500 to confirm the pattern. Also notice the 61.8% Retrace from 1102 to 1231 is near the Neckline support as well so the 1150 area appears to be a key support level.
http://www.amateur-investor.net/AII_Daily_Report_Sep_21_2011.htm
George.
Click on "In reply to", for Authors past commentaries.
What Are Market Indicators Telling Us?
* Tuesday, September 20, 2011

Technical indicators argue in favor of a rally in U.S. stocks, but caution is warranted given the lack of a solution for the euro area debt crisis and clear action to stimulate U.S. growth.
Almost all of our technical indicators suggest that the S&P 500 has reached oversold levels that typically herald a rally. For example, the Composite Technical Indicator has fallen sharply and has reached levels that usually mark the end of major market corrections. The insider sell/buy ratio, which has plunged to levels not far from those seen in late 2008/early 2009, suggests a high level of capitulation among corporate executives. Also, market breadth has collapsed, consistent will a major bottom in a typical cyclical bear market. Meanwhile, our Risk Indicator is lower than it was in 2001, when the S&P 500 fell almost by half. It is rare to have all key indicators simultaneously flashing signals of massively oversold conditions and reduced risk. When this happens, it can only suggest that selling power has almost been exhausted and the market has absorbed a lot of bad news. However, global financial markets will continue to be troubled by the lack of policy options and inaction coming from the G7 at a time of heightened economic uncertainty and financial system fragility. The risk of systemic events remains high. Bottom line: Technical indicators suggest that a rally in risk assets is possible, but the broad environment remains unstable and the risk of policy mishaps is still high. Maintain a benchmark allocation to the S&P 500.
http://www.bcaresearch.com/public/story.asp?pre=PRE-20110920.GIF
George.
Click on "In reply to", for Authors past commentaries.
Sentiment Poll
* Monday, September 19, 2011 ![]()
http://tickersense.typepad.com/ticker_sense/2011/09/September-19th-blogger-sentiment-poll.html
George.
Click on "In reply to", to see charts from prior week.
AmateurInvestors: Weekend Analysis Saturday, September 17, 2011 TY Chichi2
Since the low made on August 8th at 1102 there have been a series of sharp moves in both directions over a short period of time which has led to a very choppy pattern as the market has been whipsawed all over the place.
Meanwhile one potential pattern to watch for is another Head and Shoulders Top pattern like we saw earlier in the Summer although this one is of shorter duration. If this pattern is going to pan out the S&P 500 would reverse back to the downside early next week.
http://www.amateur-investor.net/AII_Weekend_AnalysisSep_17_11.htm
George.
Click on "In reply to", for Authors past commentaries.
Time For a Rally in Unloved Housing Stocks By Tom McClellan
* Friday, September 16, 2011

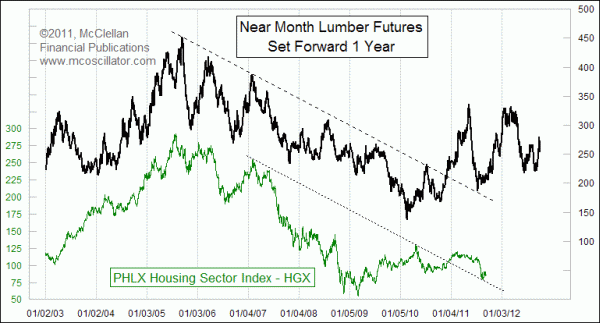
Sentiment could not be much worse for the U.S. housing market than it is right now. And why shouldn't people be pessimistic? All of the governmental efforts to stimulate a housing rebound, so people start thinking that if the government cannot fix it, what can?
Meanwhile, most people are unaware of a major rebound brewing for the home building stocks. That is because most people are not readers of our publications.
This week, I'm revisiting a topic addressed here before, concerning the way that housing stocks tend to follow in the same footsteps as lumber futures prices. The price plot of lumber futures has been shifted forward in the chart by a year to reveal how the same patterns tend to show up in the PHLX Housing Sector Index HGX about a year later. It is not a perfect correlation; it is merely very good.
A year ago, lumber prices were finishing the bottoming process after pulling back to test the top side of a broken declining tops line. Lumber prices then surged into early 2011, which means that we should expect the HGX to see a similar surge into early 2012.
This next chart looks at the same relationship, but zooms in closer.
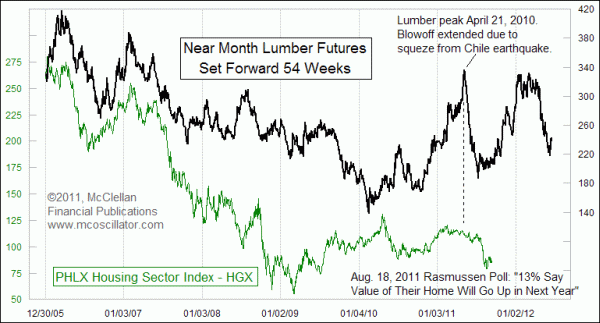
One important point to notice is that the lumber price top a year and a half ago was a lot sharper of a blowoff move than what ended up being seen in the HGX's own topping structure. There is a very good reason for this. At the end of an ordinary up move in lumber prices, the Maule earthquake struck Chile on Feb. 27, 2010. That earthquake shut down lumber operations in that country, disrupting supplies and sending lumber buyers scrambling for alternate sources.
Once the lumber and other markets had a chance to recover, prices normalized and came back down from that sharp blowoff top. The HGX decline in 2011 matched the timing of the lumber decline in 2010, but not the magnitude.
The lessen here is that lumber tends to respond a year ahead of time to the economic forces which will strike the housing market a year later. I liken this to a wave passing under the end of a long pier. The same wave eventually strikes the beach, and so if you know the length of the pier and the speed of the wave, you can know when the wave will hit the beach.
The same economic wave which caused a decline in housing stocks in 2011 had caused a decline in lumber prices a year earlier. Lumber's price pattern also reflected a temporary anomaly from the Chile earthquake, which was not a factor that affected housing stocks. That's the hard part with using a leading indication like this, or any of our other Liquidity Wave relationships: one has to figure out which movements are due to economic forces, and which are due to something putting a thumb on the scale.
Lumber's price rally in late 2010 was not due to any one-time factors like earthquakes, and so it seems much more likely to have its full echo observed in the prices of home builder stocks.
http://www.mcoscillator.com/learning_center/weekly_chart/time_for_a_rally_in_unloved_housing_stocks/
George.
Click on "In reply to", for Authors past commentaries.
AmateurInvestors: Outlook for Thursday, September 15, 2011 TY Chichi2
http://www.amateur-investor.net/AII_Daily_Report_Sep_14_2011.htm
George.
Click on "In reply to", for Authors past commentaries.
| Volume | |
| Day Range: | |
| Bid Price | |
| Ask Price | |
| Last Trade Time: |
