News
News  Market Data
  Discover
Support: 888-992-3836
Copyright © 2023 InvestorsHub Inc.


Register for free to join our community of investors and share your ideas. You will also get access to streaming quotes, interactive charts, trades, portfolio, live options flow and more tools.
Unbelievable. Did you get money back? Hope that’s a simple error
Precious Metals Copper, Silver and the Green Energy Metals Shortage
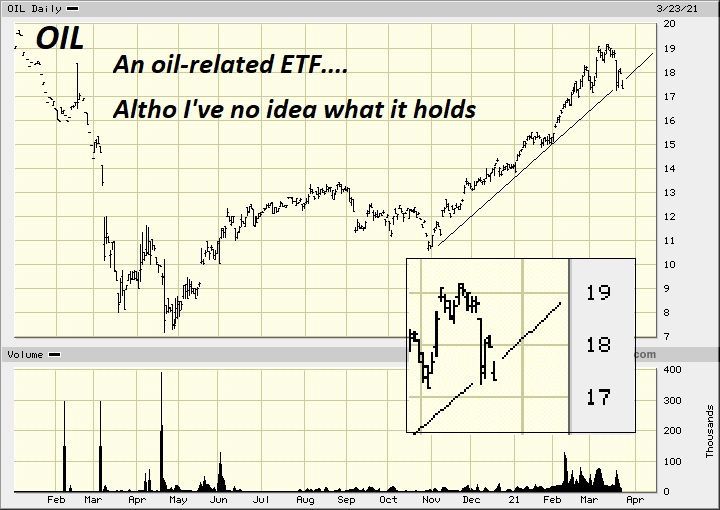
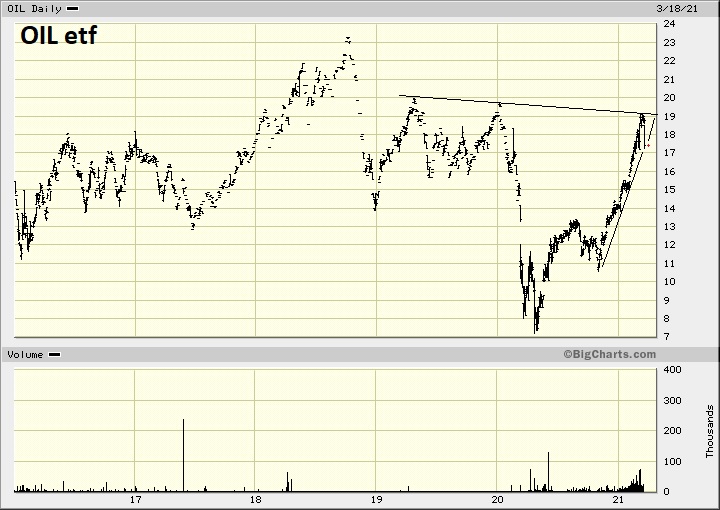
https://investorshub.advfn.com/boards/read_msg.aspx?message_id=172943022 $OIL
9 Reasons Why Gold Will Soon Replace Treasuries as Ultimate Store-of-Value Asset https://www.investing.com/analysis/9-reasons-why-gold-will-soon-replace-treasuries-as-ultimate-storeofvalue-asset-200640578
$OIL
Yesterday in my ETRADE account I had 28 shares of ETF OIL. Today my account shows their value as $0. ETRADE says that since there has been zero trades in the last 30 days then the ETF is vanquished. I do not understand where my money went.
Going Green: Can Electric Tractors Overtake Diesel?
https://modernfarmer.com/2020/03/going-green-can-electric-tractors-override-diesel/ $IDEX $OIL
Russia is considering selling its oil and gas for bitcoin as sanctions intensify from the West https://www.cnbc.com/2022/03/24/russia-might-take-bitcoin-as-payment-for-oil-and-gas-as-sanctions-rise.html $OIL
Had to buy some here yesterday! Oil is HOT!!!
$OIL WTI Crude Oil (Nymex)
USD/bbl. $108.54 -15.16
Brent Crude (ICE)
USD/bbl. $111.68 -16.30
Prediction.
At the end of the day. If there is no invasion, there is a relief deflation of the crude bubble. Keep in mind time zones. Ukraine is 10 hours later than California PST.
By 6:00 Ukraine we should know if the speculated Wednesday was right.
If no invasion, buy inverse CRUDE ETF by 6:00 PST Ukrain (10:00 AM PST). Relief rally sends NRGD up 10%.
Investment Risks
The information provided herein is not intended to replace or serve as a substitute for any legal, real estate, tax, or other professional advice, consultation, or service. The prospective buyer should consult with a professional in the respective legal, tax, accounting, real estate, or other professional area before making any decisions or entering into any contracts pertaining to the property or properties described herein.
All investments, including real estate, is speculative in nature and involves substantial risk of loss. I encourage my investors to invest carefully. I also encourage investors to get personal advice from your professional investment advisor and to make independent investigations before acting on information that I publish. Much of my information is derived directly from information published by companies or submitted to governmental agencies on which I believe are dependable but are without my independent verification. Therefore, we cannot assure you that the information is accurate or complete. I do not in any way warrant or guarantee the success of any action you take in reliance on our statements or recommendations.
Going to pop at $100 per barrel crude.
U.S. seizes $2.3 mln in bitcoin paid to Colonial Pipeline hackers
https://www.reuters.com/business/energy/us-announce-recovery-millions-colonial-pipeline-ransomware-attack-2021-06-07/
$OIL Hannity slams Biden administration over fuel shortage, rising prices: enemies 'are doing backflips'
https://www.foxnews.com/media/hannity-slams-biden-administration-over-fuel-shortage-rising-prices-enemies-are-doing-backflips
This etn OIL no longer trades? Why is this for him still here?
No more, but better one in the house!!! Carl Ichan!!
Yes I totally agree that’s why I took my money and ran. The charts didn’t read correct. It’s down as I expected. Look for a new low to jump in on for June and July contracts.
Have MAY $4 calls, so I guess these Aholes are going to get away with just fuckin everyone that owns upside calls. Nice.
The pinning at $2.65 x 2.66 is pure market manipulation at its finest, regardless of what anywhere here thinks. That's not a 'fair market.' But we know the jokeSEC wont do shit.
This is last day of trading for this ticker... It’s letting you get out at price of yesterday’s close... Get out now... you will have to wait weeks to get money back...
No this is last day of trading for this ticket... They are letting everyone get out safe at price of close yesterday... You should feel lucky it’s not a pink sheet.. otherwise it would of opened 40% lower and tons of people would of got hurt... Feel lucky... unless you bought a few days ago or week above $3.00.. then this sucks for you
So the con boys that run this are going to pin it at $2.66 until they cancel it? Wow what a massive criminal fraud IMO.
On-the-table: $10 pps.
Pricing Supplement dated April 20, 2020
>>Issued in denominations of $10<<
Are YOU (also)suitable? 
"...ETNs may not be suitable for all investors and should be used only by investors with the sophistication and knowledge necessary to understand the risks inherent in the Index, the futures contracts that the Index tracks and investments in WTI crude oil as an asset class generally."
Wait you think this has the opportunity to hit $20? You are nuts
OIL $10s-50s (pps)on-the-table. Ceiling has been $13-15s(all-time highs). Floor's @1.85(all-time lows).
Now @2.60-2.80 pps, hmmmmmm…..
What does this mean for us?
"Our estimated value of the ETNs as of the inception date is $50.00 per ETN"… an additional 50,000,000 ETNs, principal amount $10 per ETN, were issued on April 16, 2020. ...If you hold your ETNs to maturity, you will receive a cash payment per ETN at maturity in U.S. dollars equal to the closing indicative value on the final valuation date."
Yes the current low is $1.85 but, the news I read doesn't seem good for oil ? There is low demand and full supply. Not sure about this rally. Seems more like a bounce off "a" bottom ?
Read somewhere on this board this AM Or did they delete the comment?
Where did you hear that at?
The low is 1.85.
I got out at 2.86. Pocketed my change. The charts didn’t look right. Had a hard time breaking 2.90-2.92. Touched 3 times. Plus the oil market has gained its 30% back it lost. Until the economy starts up again. OIL is dead in the water at that 30% gain. But what do I know. Don’t take my word for it. Seek professional advise. ??
I see options contracts till end of year... What do you mean
You deleted so must be wrong
Where you read they are stopping trading on April 30th... I’m new here and never saw that.. thanks
I agree.. I’m in at $1.99
OIL turned out to be a profitable trade off that bottom!
Why are there so many buys, 84K green 1 min time frame, of this when they plan on stoping trading 30 April???
Barclays to liquidate oil ETN
Apr. 21, 2020 9:49 AM ET|About: iPath S&P GSCI Crude Oil To... (OIL)|By: Liz Kiesche, SA News Editor
Barclays will redeem in full its iPath Series B S&P GSCI Crude Oil Total Return Index ETNs (OIL -29.8%) on April 30, 2020 and will suspend any further sales or issuance of the ETN as of today.
A premium developed in the trading price of the ETNs as the closing trading price of the ETNs on April 20, 2020 was $3.73, which represents a premium of ~13.5% over the closing indicative value of the ETNs on that date.
The move comes after May WTI crude contracts made history yesterday by plunging into negative territory; June WTI contracts are down 29% to $14.47 per barrel today.
Previously: U.S. Oil Fund approaching zero as all remaining shares issued (April 21)
I’m a little confused...does this mean you should dump your shares before 30 April?
* * $OIL Video Chart 04-22-2020 * *
Link to Video - click here to watch the technical chart video
When? I want more
|
Followers
|
23
|
Posters
|
|
|
Posts (Today)
|
0
|
Posts (Total)
|
312
|
|
Created
|
02/06/09
|
Type
|
Free
|
| Moderators | |||
http://finance.yahoo.com/q/h?s=OIL
The investment is linked to the performance of the Goldman Sachs Crude Oil Return Index and reflects the returns that are potentially available through an unleveraged investment in the futures contacts comprising the index plus the Treasury Bill rate of interest that could be earned on funds committed to the trading of the underlying contracts. The index is derived from the West Texas Intermediate (WTI) crude oil futures contract traded on the New York Mercantile Exchange. The fund is nondiversified.
iPath S&P GSCI Crude Oil Total Return Index ETN is a sub-index of the S&P GSCI Commodity Index. The S&P GSCI Crude Oil Total Return Index reflects the returns that are potentially available through an unleveraged investment in the West Texas Intermediate (WTI) crude oil futures contract plus the Treasury Bill rate of interest that could be earned on funds committed to the trading of the underlying contracts. The S&P GSCI is an index on a production-weighted basket of futures contracts on physical commodities traded on trading facilities in major industrialized countries. The S&P GSCI is designed to be a measure of the performance over time of the markets for these commodities.
| Volume | |
| Day Range: | |
| Bid Price | |
| Ask Price | |
| Last Trade Time: |