For ‘hit and run’ trader intraday low at this writing is 1209.75, index has retraced 0.382. bull says: well, it looks ‘not that bearish’.
1292.66 10/27 1074.11 10/04 0.382 - 1209.17
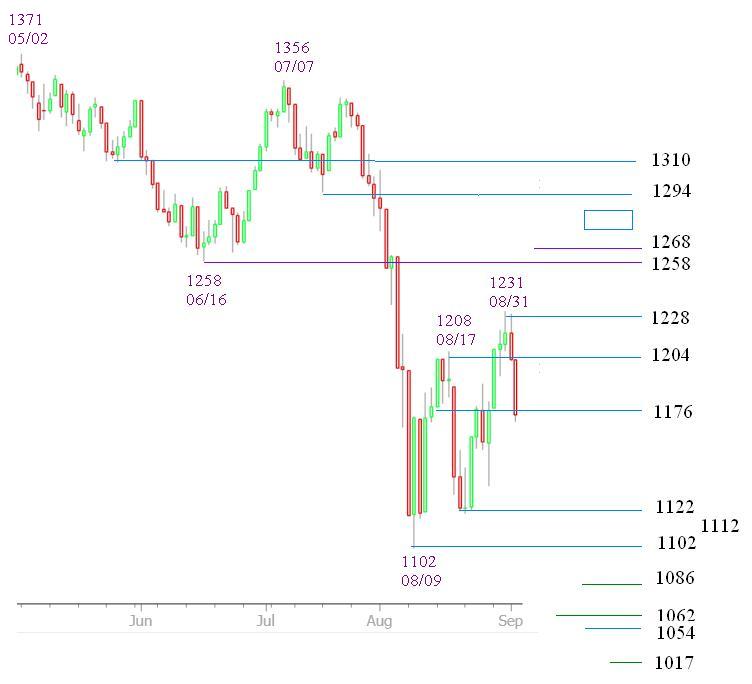
reference point 1208.48 observed on 08/17. nearby resistance 1228 is a major FIB. coincidently, a 0.236 bounce will reach 1229.45 (1209.75 vs 1292.66). immediate suport 1202 is the mean between 1228 and 1176
The bounce off the 1209.48 (11/17) only reached 1223.51 (11/18). Today (11/21), index opens at 1215.61, then, it cut through the immediate support 1202 as if it is not there.
------------------------------------------------------------------------ Thursday, November 17, 2011 2:55:36 PM investorshub.advfn.com/boards/read_msg.aspx?message_id=69114063 reference point 1208.48 observed on 08/17. nearby resistance 1228 is a major FIB. coincidently, a 0.236 bounce will reach 1229.45 (1209.75 vs. 1292.66). immediate support 1202 is the mean between 1228 and 1176 ------------------------------------------------------------------------
11/21 intraday status at this writing
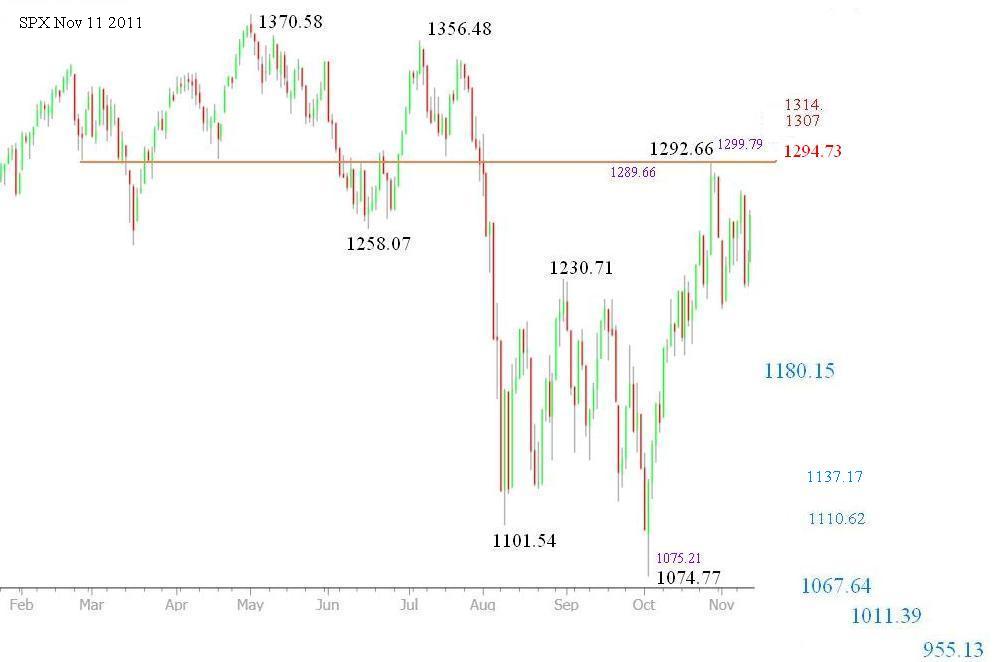
RUT--0.500--0685.59--actual 0696.72 S&P--0.500--1183.16--actual 1183.16-- first target is 1180.15 (refer to chart) NDX--0.618--2184.09--actual 2188.14
Indices exhibit different strength, NDX is the weakest.
The difference between the first target 1180.15 and 0.5 retracement 1183.16 (1292.66 vs. 1074.77) is small. however, when index dips below 1180.15 it is suggesting further decline is looming, bounces off 1183.16 says the local frame is still imposed (1292.66 vs. 1074.77). Soon we will know whether there is a meaningful low on December 20, step by step.
------------------------------------------------------------------------ Wednesday, November 16, 2011 12:48:19 AM investorshub.advfn.com/boards/read_msg.aspx?message_id=69037068
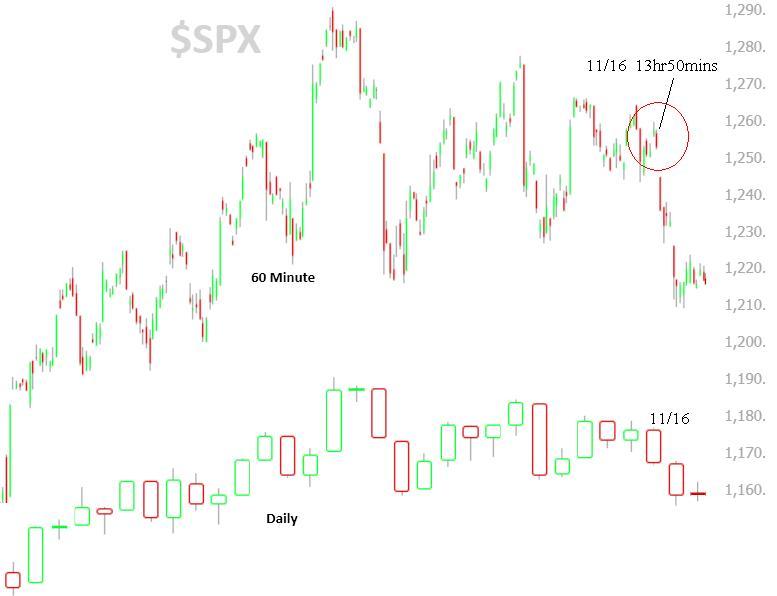
12 November 2011 - 05:22 PM http://investorshub.advfn.com/boards/read_msg.aspx?message_id=69037068 for 'near term' (loosely defined semantics), ..... When index dives below 1176, the downward flush will start. ------------------------------------------------------------------------
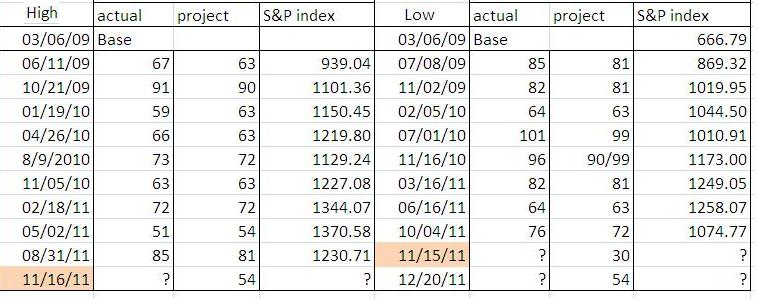
triangle shows its tails, breaks down just in time, see table below.
------------------------------------------------------------------------ Wednesday, November 16, 2011 2:02:36 PM investorshub.advfn.com/boards/read_msg.aspx?message_id=69061747 Table shows the High/Low conflict, however, any volatile rhythms will be washed out by the time machine , the triangle saga will end soon. ------------------------------------------------------------------------
 News
News  Market Data
  Discover