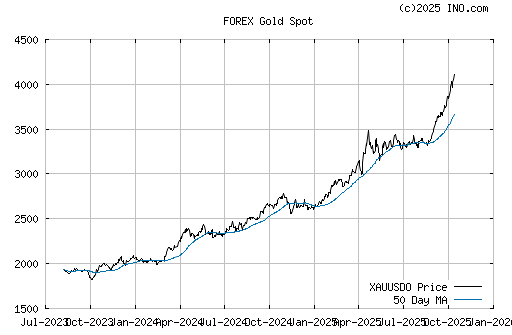
Gold Spot (FOREX:XAUUSDO) haven't seen anything yet - when its Au Mother start UP fiat$100++/day the people who lost the Gold will lynch the bolsheviks 666banksters evils who fooled robbed the people of the Au power bricks -
a repeat let's take a look - HUI Gold Mining Stocks: Major Uptrend In Progress - The major trend move underway in the Gold Bugs Index -
Although they're more volatile than Gold, if you can position yourself on the 'right' side of their dominant trend, investments in fundamentally sound Gold mining shares can be even more profitable than investing in physical Gold. Here's a look at the major trend move underway in the Gold Bugs index, one of the most widely regarded indexes that scores of precious metals equity traders and investors rely on.
My, how times do change. Less than a year ago, the share prices of virtually every senior and junior Gold mining company were on the proverbial 'ash heap,' and some market analysts had doubts that the bull run in the precious metals sector would ever regain a solid footing, much less soar to new highs. And yet, that's just what happened - a complete recovery across the entire sector (including Silver and Silver mining companies, too), with Gold now at all-time highs and Silver up more than 100% in less than 12 months. Even better for those who trade Gold mining stocks, the Gold Bugs index (which tracks the performance of some of the biggest and most fundamentally sound Gold miners) is up a mind-jarring 200% since October 2008 - and the uptrend doesn't appear to be waning yet. Let's have a closer look at the weekly technical chart of the Gold Bugs index and examine the key trend indicators as see what they may be telling us about the future trajectory of prices for this volatile and potentially profitable sector of the market.
Graphic credit: Metastock v.11
Let's start at the top of the chart to focus on recent developments first; note the huge, wide-range weekly candle that just printed, one that took out the prior weekly swing high of 448.31. As you probably know, the very definition of an 'uptrend' is that a stock, commodity or index must have a series of higher highs and higher lows, and that's exactly what we see on this weekly chart of the Gold Bugs index. Now, look just below the recent weekly candle and witness the ever-increasing spread between the 20-week (red line) and the 50-week (blue line) exponential moving averages (EMA's). Note how they are both sloping upward and that the spread between them is also increasing at a steady rate; this is a sign of increasing upward momentum in the index. Moving toward the lower area of the chart, notice that the Aroon (14) trend intensity index is solidly biased toward the bullish side of its range (when the blue line is above the red line and both lines are at opposing extremes, a powerful uptrend is in motion) even as the Relative Strength index (RSI)(14) is also in a powerful uptrend. It's also interesting to note that RSI readings above 60 are usually indicative of a powerful trend move, and with a current reading of 66.94, we can therefore conclude that this latest rally in the Gold Bugs index is no fluke. An interesting side note: Gold (cash basis) is up about 48% since making a major low late last year (at about $713), but did you notice that Gold stocks (as represented by the Gold Bugs index) posted gains of about four times as much during the same time period?
Does this mean that the shares of Gold mining companies are on a non-stop ride toward ever-increasing gains? Not necessarily; in fact, there are strong overhead resistance areas near 479 and then 520 that will likely act as (temporary?) consolidation and/or reversal point for the index. However, with the monthly chart of the Gold Bugs index (not shown) also displaying powerful trend characteristics, there can be little doubt that either of those key resistance areas will eventually be challenged. A solid break above 520.00 puts the Gold Bugs index into an extremely bullish posture, and that's a price level that all Gold equity traders will be monitoring in the weeks and months to come. If the price of Gold also continues to rise (it also featuring many of the same bullish trend characteristics of the Gold Bugs index), that will also be extremely favorable toward those trading the shares of the biggest and most fundamentally attractive Gold mining companies.
This may be the most exciting time to be a Gold/Gold stock trader since at least 1979-1980, and if current trends keep strengthening, we may be on the threshold of an era in the precious metals markets that will be talked about for generations to come. Stay tuned - it's sure to be a fascinating and potentially profitable time to be involved with the precious metals markets!
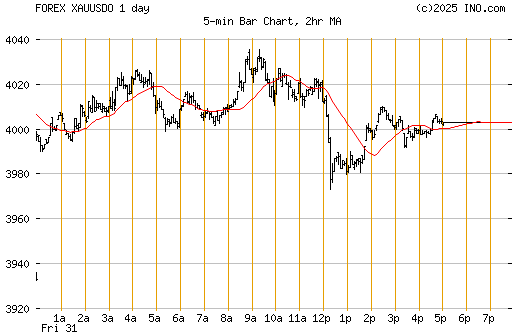
Last trade 1076.35 Change +12.97 (+1.22%) Open 1063.38 Previous Close 1063.38 High 1077.90 Low 1055.00 Bid 1076.35 Ask 1076.86 2009-11-03 10:56:45, 0 min delay
Got Gold hard rock treasures - ex..of a Gold venture penny play CQRLF - The Calm Before The Run LexLuthor
Drilling has begun. I believe GoldCorp is watching this company very close. This is stock is currently under the radar and should gain some attention very soon. Drilling results have to be positive. Stay tuned......
well, CQR still an Ausome bargain..
dd..listen to.. Presentation by John F. Kearney, Conquest's Chairman on "InvestmentPitch.com"....
Here are 10 compelling reasons why gold is going to do well this year.
The Stimulus Effect: Including $1 trillion in cash infusions, the stimulus plan will pump $9.7 trillion into the economy, according to Bloomberg. As the Globe & Mail reports flatly, “Many believe that the monetary stimulus efforts will cause a spike in inflation,” driving gold higher.
COMEX Traders Predict $1,600 Gold… by December: If gold trades at or above $1,600 by December, some 100,000 call option contracts will be “in the money.” Big-money players Goldman Sachs and JPMorgan are reportedly helping to drive the action, ahead of a huge purchase of gold futures contracts.
“Big Money” Inflows: In 2008, NYC-based hedge fund Paulson & Co’s flagship fund returned 37%, as the world markets burned. Paulson’s bullish on gold, big time, including the Mar. 17 purchase of 39.9 million shares of AngloGold, worth $1.28 billion. Other major hedge funds are piling into gold, too, including Eton Park Capital, Green light Capital and Hayman Advisors.
China’s Doubling Down! China just revealed that it has doubled its gold holdings to 1,054 tons. Yet that still only equals 1.6% of its overall reserves. As China moves out of U.S. Treasuries and into gold, this will help fuel the next leg of the run-up.
Demand Building across the Board: Worldwide demand for gold jumped by $29.7 billion in the first quarter, a 36% bolt, according to the World Gold Council. Demand for gold ETFs (Exchange Traded Funds) rocketed 540%... another trigger for the coming gold boom.
The Paper Dollar’s 30% Drop: Since 2001, the U.S. Dollar Index has tanked 30%... while gold has risen 300%. With all the downward pressure on the dollar, and inflation on the way, this trend is about to pick up steam.
Gold/Dow Ratio Signals $8,000 Gold: During major gold bull markets (and corresponding equity bears), gold and the Dow converge at a 1-to-1 ratio. During the last gold bull, the Dow sank to 850 and gold rose to $850. The Dow is now over 8,000… But even if it fell to 4,000, we could see $4,000 gold before this bull run is over!
U.S. Treasury Dept. Signals $5,468 Gold: Currently, the U.S. government holds about 286.9 million ounces of gold. It has printed about $1.569 trillion worth of paper dollars. If each dollar were backed by gold, that would put the price at $5,468.80 an ounce.
Riding the “Commodity Super Cycle”: Jim Rogers expects the Commodity Super Cycle to drive commodity prices higher for another eight years… including gold. And he’s stockpiling the yellow metal by the day. Every pullback, says Rogers, is another buying opportunity. Considering he’s been dead right on every major trend of the past 40 years, we wouldn’t bet against him.
Historic Model Predicts $6,214 Gold: During the last gold bull, the yellow metal ran from $35 an ounce to $850, a 24-fold increase. This bull started with gold at $255.95, meaning that if historic trends hold, the price target would be $6,214 an ounce.
 News
News  Market Data
  Discover