


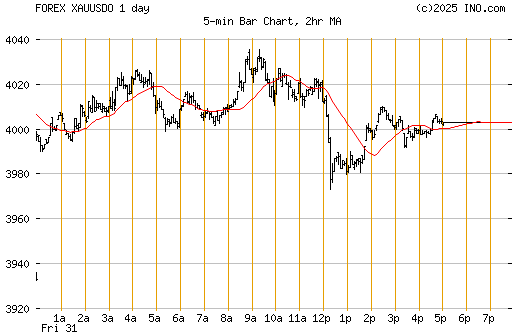
Last trade 998.92 Change -4.51 (-0.45%)
Open 1003.43 Previous Close 1003.43
High 1004.58 Low 993.70
Bid 998.92 Ask 999.42
Gold Spot 5 day chart
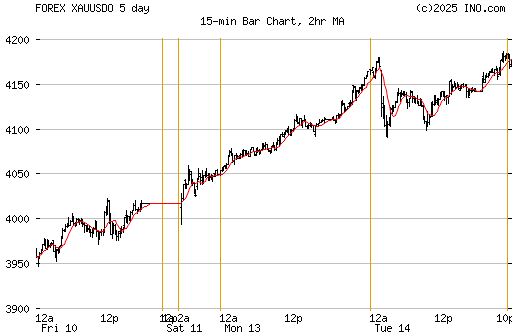
Gold had a good week, adding $11.80 (+1.19%) to close at 1006.20.
Its all-time high is about 3% above at $1033.
The weekly chart shows the inverse head & shoulders formation
still intact.
Price is bumping into overhead resistance, represented by
the neckline (white slanted line).
For the formation to be confirmed, price needs to break above
the neckline on expanding volume, turning resistance into
support.
A strong breakout has the potential to reach $1300.00.
Expanding volume is crucial.
It is possible that gold does not break through on the first
attempt.
A lot depends on the dollar. If the dollar continues to
weaken, it will put a wind to gold's back.
If the dollar rises, it could dampen gold's advance.

U.S fedz-fiatz$ INDEX (NYBOT:DX)
--
Conquest Resources Ltd. '
well, its still an Ausome pennyplay bargain
dd..listen to..
Presentation by John F. Kearney, Conquest's Chairman on "InvestmentPitch.com"....
http://www.investmentpitch.com/media/514/Conquest_Resources_Ltd.__TSXV_CQR/
WHY RED LAKE GOLD BELT?
http://investorshub.advfn.com/boards/read_msg.aspx?message_id=41185478
imo. tia.
God Bless

VHAI - Vocodia Partners with Leading Political Super PACs to Revolutionize Fundraising Efforts • VHAI • Sep 19, 2024 11:48 AM
Dear Cashmere Group Holding Co. AKA Swifty Global Signs Binding Letter of Intent to be Acquired by Signing Day Sports • DRCR • Sep 19, 2024 10:26 AM
HealthLynked Launches Virtual Urgent Care Through Partnership with Lyric Health. • HLYK • Sep 19, 2024 8:00 AM
Element79 Gold Corp. Appoints Kevin Arias as Advisor to the Board of Directors, Strengthening Strategic Leadership • ELMGF • Sep 18, 2024 10:29 AM
Mawson Finland Limited Further Expands the Known Mineralized Zones at Rajapalot: Palokas step-out drills 7 metres @ 9.1 g/t gold & 706 ppm cobalt • MFL • Sep 17, 2024 9:02 AM
PickleJar Announces Integration With OptCulture to Deliver Holistic Fan Experiences at Venue Point of Sale • PKLE • Sep 17, 2024 8:00 AM

